Abstract
Purpose
To evaluate an optimized stack of radials ultrashort echo time (UTE) three-dimensional MRI sequence for breath-hold and free breathing imaging of the human lung.
Methods
A 3D stack of ultrashort echo time radials trajectory was optimized for coronal and axial lower resolution breath-hold and higher resolution free breathing scans using Bloch simulations. The sequence was evaluated in ten volunteers, without the use contrast agents. SNR mean and 95% confidence interval were determined from separate signal and noise images in a semi-automated fashion. The four scanning schemes were evaluated for significant differences in image quality using the Student’s t-test. Ten clinical patients were scanned with the sequence and findings were compared with concomitant CT in nine patients. Breath-hold 3D spokes images were compared with 3D stack of radials in five volunteers. Mann-Whitney U test was performed to test significance in both cases.
Results
Breath-hold imaging of the entire lung in volunteers was performed with SNR (mean = 42.5 [CI]: 35.5 – 49.5; mean = 34.3 [CI]: 28.6 – 40) in lung parenchyma for coronal and axial scans respectively, which can be used as a quick scout scan. Longer respiratory triggered free breathing scan enabled high resolution UTE scanning with mean SNR of 14.2 ([CI]: 12.9 – 15.5) and 9.2 ([CI]: 8.2 – 10.2) for coronal and axial scans, respectively. Axial free breathing scans showed significantly higher image quality (P = 0.008) than the three other scanning schemes. The mean score for comparison with CT was 1.67 (score 0: N = 0; 1: N = 3; 2: N = 6). There was no significant difference between CT and MRI (P = 0.25). 3D stack of radials images were significantly better than 3D spokes images (P < 0.001).
Conclusion
The optimized 3D stack of radials trajectory was shown to provide high quality MR images of the lung parenchyma without the use of MRI contrast agents. The sequence may offer the possibility of breath-hold imaging and provides greater flexibility in trading off slice thickness and parallel imaging for scan time.
Keywords: 3D stack of radials, lung parenchyma, breath-hold, free breathing
INTRODUCTION
MRI of the lung has advanced to provide complimentary tools for the evaluation of lung structure and function (1) clinically. Although CT has been traditionally the method of choice, recent improvements in MRI hardware and sequences have made MRI an attractive alternative. Lack of ionizing radiation allows for repeated longitudinal studies over short time periods. Furthermore, MRI without use of gadolinium contrast agents is indicated in patients with renal failure as well as being attractive for pediatric imaging. MRI offers several advantages beyond the scope of x-ray based techniques. This includes improved tissue contrast and the greater potential for functional information. Most lung diseases result in an increase in tissue, cells or blood which results in increased MRI signal and can therefore be visualized using MRI. For example, pulmonary nodules and infiltrates can be depicted with standard sequences such as 3D fast field echo or single-shot spin echo imaging (2).
However, certain pathologies such as chronic obstructive pulmonary disease (COPD), asthma and cystic fibrosis may manifest themselves in reduced signal from the lungs due to destruction of lung tissue and airways (3,4). Structural imaging of the lung parenchyma is challenging due to the extremely short T2* of lung, the low proton density and the possibility of motion related artifacts on relatively longer MRI scans. Standard sequences based on gradient echo and spin-echo need to be used in conjunction with gadolinium based contrast agents to improve signal-to-noise ratio. The mechanism of improved SNR is through a reduction in T1 allowing higher excitation angles to be used. However, use of a contrast agent does not address the T2* related reduction in SNR. MRI scanning based on ultra-short echo time imaging (UTE) has been around for decades. However, earlier use of the technique was hampered by poor gradient hardware and other shortcomings unique to a radial trajectory beginning at the center of k-space such as gradient delays and eddy currents (5). Current advances have brought ultra-short echo time imaging into the realm of everyday use on standard scanners. UTE imaging is uniquely suited for native morphological lung imaging. A short echo time ensures reduced T2* related signal loss and blurring. In addition, a radial trajectory is more robust to motion artifacts (6,7). Several different implementations of UTE exist in the literature. These include techniques such as SWIFT (8), TPI (9) and ZTE (10). Most of the techniques could be described as experimental. The more common implementations of UTE sequences are based on 2D using half pulse excitation (11) or 3D cush-ball trajectory (12,13). Johnson et al. (13) proposed a modified radial trajectory along with reduced FOV and improved RF pulses to increase SNR.
A hybrid 3D stack of radials (STAR) trajectory has previously been used to acquire full k-space radial lines for dynamic contrast enhanced (DCE) myocardial perfusion imaging (14), DCE liver imaging (15), pediatric abdominopelvic imaging (16) and in MR angiography (17). 3D STAR with ultrashort echo time provides reduced T2* decay while allowing flexibility along the slice direction. As a result, scanning time can be traded off for slab coverage or slice resolution allowing for breath-hold as well as free-breathing scans. The purpose of this work was to evaluate an optimized 3D stack of radials ultrashort echo time (UTE) MRI sequence for breath-hold and free breathing imaging of the human lung.
METHODS
Sequence Description
For 3D STAR imaging, RF excitation pulse is followed by a kz encoding gradient prior to radial acquisition using trapezoidal waveforms. The STAR k-space geometry has unique advantages which allow for breath-hold (BH) scans in a reasonable time. Radial sampling in the in-plane direction ensures short echo time while Cartesian sampling along kz provides tradeoff between resolution and coverage. In addition, parallel imaging can be applied in a straightforward manner along the kz direction to reduce breath-hold time. For shortest echo time, a non-selective pulse is used. To reduce wraparound artifacts (along the foot to head direction) in axial scans, a slab selective RF pulse is employed at the expense of slightly increased echo time (by ~ 0.05 ms). The slab selective pulse was a short duration (100 μs; 30 μs from isocenter to end of pulse) Gaussian modulated sinc pulse with one left lobe. In conjunction with the slab selective gradient, this increased the echo time by ~0.05 ms. The T2* of lung at 1.5T and 3T has been measured to be 2.1 ms and 0.74 ms, respectively (18). Optimal SNR for a radial acquisition scheme has been studied by Rahmer et al. (19) where nominal resolution (resulting from blurring) was offset against SNR considerations in order to determine the optimal data acquisition window. For a stack of radials trajectory such as used in this work, the optimal occurs when the acquisition window ~ 0.81 × T2* (19). Consequently, the acquisition window was fixed at 0.6 ms. The bandwidth for each scan was adjusted to provide the targeted acquisition window (BW/pixel = 1.7 KHz for BH and 1.66 KHz for FB scans). T1 of lung parenchyma has been measured to be 1374 ms at 3T (20). With a spoiled gradient echo radial sampling scheme as used here, the optimal flip angle is given by the Ernst angle: θ= cos−1(exp(−TR/T1)).
Simulations
The magnetization resulting from the spoiled gradient STAR trajectory was simulated using sequence parameters corresponding to the breath-hold scanning sequence.
Parameters used were: TR/TE = 2/0.09 ms, θ = 3.1° (Ernst angle), Tacq = 0.6 ms, T2* = 0.74 ms, FOV = 380 mm, res = 2 mm, 494 radial arms.
Bloch simulation for magnetization evolution with transverse and longitudinal relaxation using T1/T2 values for lungs given earlier was performed. Once the signal along all radial arms (sequential ordering) was determined, sampling density compensation was performed prior to gridding as described by Jackson et al (21). This was followed by a 2D inverse Fourier transform. The reconstruction was implemented in Matlab®.
Volunteer Scanning
Ten volunteers (7 male, 3 female) were scanned on a Philips 3T Achieva TX scanner using the lower resolution breath-hold and the higher resolution free breathing scans. The volunteers were scanned under an IRB approved protocol and informed consent was obtained after the nature of the procedures was fully explained. A respiratory pad was employed to monitor the breathing cycle and for triggering the free breathing scans. A 16-channel receive coil (SENSE Torso-XL) was used for the study.
Breath hold Scans
Parameters for the coronal and axial end-expiration breath-hold scans were as given below. Coronal: FOV =38–39 cm, TR/TE = 2/0.09 ms, radial spokes = 494, parallel imaging: SENSE (z) = 2, 25–34 slices for full lung coverage, res = 2 × 2 × 8mm3, scan time: 16–21s.
Axial: Same as coronal scan except res = 2.5 × 2.5 × 8 mm3, radial spokes = 365, selective RF (TE = 0.14ms), 19–23 slices, scan time: 18–23s and SENSE (z) = 1. With coronal scans, use of SENSE (with full coverage along the A/P direction) made shorter breath-hold scans possible with a slightly higher in-plane resolution (2 × 2 mm2) than the axial scans (2.5 × 2.5 mm2). Parallel imaging (along slice encoding direction) could not be used for axial scans due to foldover artifacts resulting from signal outside the selected slab showing up at an unfavorable location (near center of 3D slab). In addition, to avoid artifacts from outside the FOV along the axial direction, a slab selective RF pulse was employed. For the imaging parameters used, this would entail just a 7% drop in signal due to increased TE while preventing aliasing.
High Resolution Free Breathing Scans
Axial and coronal free breathing scans were performed with the following scan parameters: FOV = 38–39 cm, res = 1.5 × 1.5 × 5 mm3, segment factor = 201–208 radial arms; respiratory triggered.
Coronal scans: TR/TE = 2.4/0.09 ms, flip angle θ = 3.2°, slices: 40 – 61, scan time: 5:06 – 7:48
Axial scans: TR/TE = 2.5/0.14 ms, flip angle θ = 3.3°, slices: 34 – 39, scan time: 5:00 – 6:54 based on number of slices and respiratory rate.
The shot duration per respiratory trigger was ~500 ms and trigger delay was set to 700 ms.
Measurements
The SNR in lung parenchyma was determined from signal and noise only images for all slices (second breath-hold for BH scans) in the same scan. The noise only images were obtained as a second acquisition with the RF switched off (22). A semi-automated technique was implemented in Matlab® to measure whole lung signal by manually drawing a region in the chest wall around the lungs to exclude airways and surrounding tissue and using thresholding to segment out the lungs from airways and vessels. In cases where the automated thresholding algorithm didn’t agree with visually identified lung tissue, adjustments were made to the threshold value. The same segmented region was applied to the noise only images to obtain the standard deviation of noise. SNR was calculated as mean (signal)/std(noise) in the lung roi. A correction factor of 1.42 for multi-channel magnitude images was applied to calculate SNR (23,24). A coefficient of variation (CV) measure was determined as (σ/μ) where σ= (Σ stds)/N where Σ is over the N volunteers and stds refers to the standard deviation of the SNR values across slices. μ is the mean SNR across all slices and subjects. This metric provides a measure of the homogeneity of the lung signal across slices.
Semi-quantitative Assessment
The volunteer images were also scored for image quality independently by two observers (NG: 22 yrs and AM: 10 yrs MRI experience) according to the following guidelines: (a) Lung tissue visibility (scale: 0 (same as air); 1 (barely distinguished from airways); 2 (uniformly different from airways). (b) Airways and vessels: 0 – cannot be distinguished, 1 – trachea can be distinguished, 2 – primary level, 3 – segmental level and 4 – extending to periphery (c) Artifacts: 0 – severe artifacts, 1 – moderate artifacts, 2 – some artifacts interfere with interpretation, 3 – no artifacts. Mean and standard deviation of the scores for the two observers was calculated. Total score for each scan was determined and the mean and standard deviation was computed for both observers. Student t-test was performed to determine significant differences between the four different scans.
Patient Scanning
Ten patients (age: 37.3 ± 20.3 yrs; range: [17 – 74] yrs) with prior or suspected lung disease were scanned with BH and FB sequences. All MR sessions were successfully completed within 20 minutes without any adverse events. In nine of the ten cases, concomitant low dose CT scans (SOMATOM Force, Siemens, Germany) were performed. One patient had a two month follow up on both CT and MRI. The findings were reported by board certified body radiologists who reported the CT and MRI studies separately.
Semi-quantitative Assessment
In addition, the nine patient MRI and CT images were scored by a trained body radiologist (AM: 10 yrs experience) based on the following scale for correlation of findings: 0 (poor correlation); 1 (good correlation but some features < 4 mm not visible on MRI); 2 (excellent correlation with all findings being the same). Mann-Whitney U test was performed to test for differences between MRI and CT images. The higher resolution used here was limited by the need for a reliably high SNR (>5) in native lung parenchyma. However, 3D STAR can provide higher resolution images with increase in scan time. The feasibility was demonstrated in a volunteer where 1 mm3 images were acquired with a scan time of 11 min 40 s.
In addition, to show the advantage of 3D STAR over 3D spokes for breath-hold images, comparison was done in five volunteers (3 male, 2 female) using the same breath-hold time of 20 s and the same voxel size. Resolution for 3D STAR images was 2 × 2 × 8 mm3 while it was 3.2 × 3.2 × 3.2 mm3 (voxel size matched) for the 3D spokes trajectory. Two observers (NG: 22 yrs and AM: 10 yrs MRI experience) scored the images obtained from the two scans after all identifying information had been stripped for each subject. Scoring was as follows: 0 = preference for 3D spokes over 3D STAR; 1 = no perceptible difference between the two sets; 2 = 3D STAR preferred over 3D spokes.
RESULTS
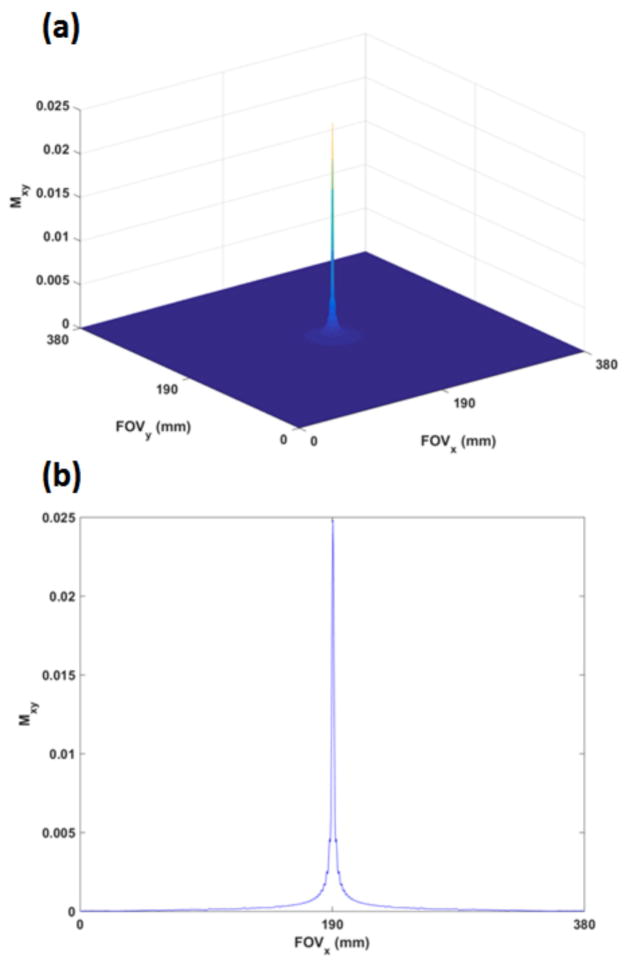
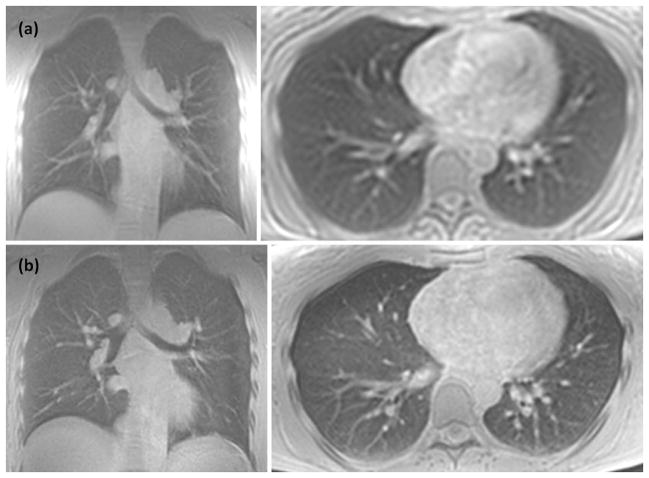
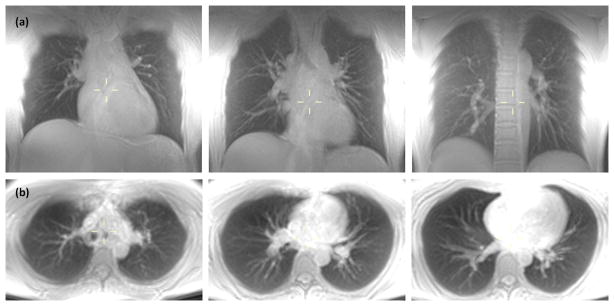
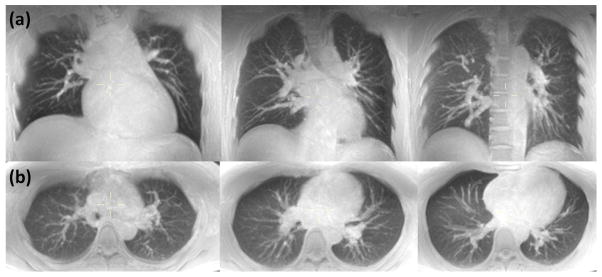
From simulations, peak of the point spread function (PSF) was 0.025 (where peak PSF = 1 denotes the magnitude without relaxation and with θ = 90°) while the FWHM radius (obtained from area in pixels ≥ PSFmax/2) was 0.85 mm which is in agreement with the theoretically derived value of 0.49 × (TAQ/T2) (19). Figure 1(a) shows the PSF in the x–y plane (Cartesian sampling along kz). Figure 1(b) shows the 1-D profile corresponding to y = FOV/2. The FWHM for this central profile was ~ 2 mm. Figure 2 shows sample axial and coronal images obtained from breath-hold and free breathing scans. Figure 3 provides a perspective of the entire lung from representative maximum intensity projected (MIP) (25 mm slab thickness) axial and coronal breath-hold images for a volunteer at three different levels while Figure 4 shows the corresponding MIP images obtained from the same volunteer with the free breathing higher resolution scans. In all cases, lung parenchyma has a sufficiently high SNR to be clearly distinguished from signal-less background.
Figure 1.
(a): The simulated PSF in the x–y plane with the breath-hold scan parameters and typical lung relaxation parameters at 3T. Mxy = 1 corresponds to magnetization devoid of both T1 and T2 relaxation and for θ = 90°. The radius at FWHM was 0.85 mm (b) a 1-D profile of the PSF depicted at the center plane in Figure 1(a). FWHM was measured to be ~2 mm.
Figure 2.
Single slice from coronal and axial lower resolution breath-hold (a) and higher resolution free breathing (b) scans of a normal volunteer.
Figure 3.
MIP (25 mm slab thickness) of breath-hold lung images obtained at three different levels for (a) coronal and (b) axial scans. Native resolution was 2 × 2 × 8 mm3 for coronal scan and 2.5 × 2.5 × 8 mm3 for axial scan. Scan time was 18.5 s and 21 s, respectively, for complete coverage along the two directions.
Figure 4.
MIP (25 mm slab thickness) of respiratory triggered free breathing lung images obtained at three different levels for (a) coronal and (b) axial scans. Native resolution was 1.5 × 1.5 × 5 mm3 for both scans. Scan time was 5:06 and 6:54 for complete coverage along the coronal and axial directions, respectively.
Table 1 shows the mean SNR for breath-hold and free breathing coronal and axial scans across the 10 volunteers. CV was higher for the coronal scans than the axial scans indicating greater inhomogeneity in signal across slices.
Table 1.
| Coronal | Axial | |||
|---|---|---|---|---|
| Mean SNR | Mean CV | Mean SNR | Mean CV | |
| Breath-hold | 42.5 ± 11.3 | 0.308 | 34.3 ± 9.2 | 0.117 |
| Free breathing | 14.2 ± 2.0 | 0.214 | 9.2 ± 1.7 | 0.136 |
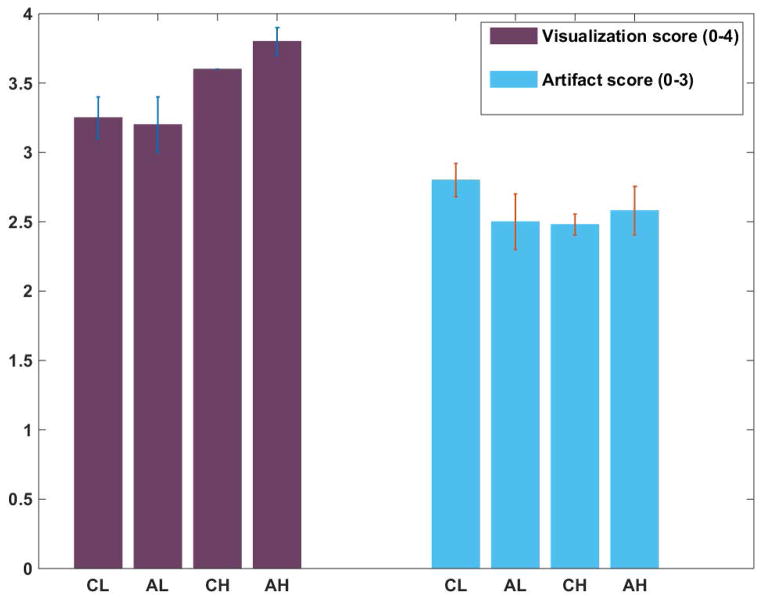
Figure 5 shows the mean and standard deviation of scores obtained from qualitative assessment of images by the two observers. (Lung tissue visibility was scored at 2 for all cases by both observers and is not shown.) As expected, higher resolution free breathing scans provided better visualization of the bronchi and vessels than breath-hold scans. Axial free-breathing scans provided the best results (as determined using the t-test) relatively unhindered by chest wall signal. Mean score for FB axial scans was 8.38 ± 0.28 which was significantly higher than the next score of 8.08± 0.07 for FB coronal scans (p = 0.008). FB and BH coronal scans were in turn significantly better than BH axial scans (P = 0.02 and 0.03, respectively).
Figure 5.
Semi-quantitative analysis of images for visualization of vessels and airways and the presence of artifacts. CL and AL refer to low resolution breath-hold coronal and axial images while CH and AH refer to high resolution FB coronal and axial scans, respectively. Note that maximum score for visualization was 4 (all the way to the periphery of lungs) while the best score for artifacts was 3 (no artifacts).
Findings in the ten patients included lung nodules, cysts, scarring, atelectasis, fibrotic parenchymal changes, bronchiestases and post-surgical changes, such as lobectomy. There was complete agreement between the readers for detection of scarring, atelectasis, bronchiectasis, cyst and nodules > 4 mm. In the case of the patient with two month follow up, a single nodule (~ 4mm) in the right upper lobe showed a slight decrease compatible with resolving infection. CT showed superior sensitivity to 3D STAR MRI for better definition of lung nodules (two patients), ground glass opacities (one patient) and calcified granulomas (one patient).
Semiquantitative analysis on the findings from CT and MRI for the nine patients resulted in a mean score of 1.67 (score 0: N = 0; score 1: N = 3 and score 2: N = 6). The difference in the findings between CT and MRI was not significant (P = 0.25).
Subjective assessment of images by the two observers indicated a preference for 3D STAR images over 3D spokes in all five cases. The difference was significant (P < 0.001).
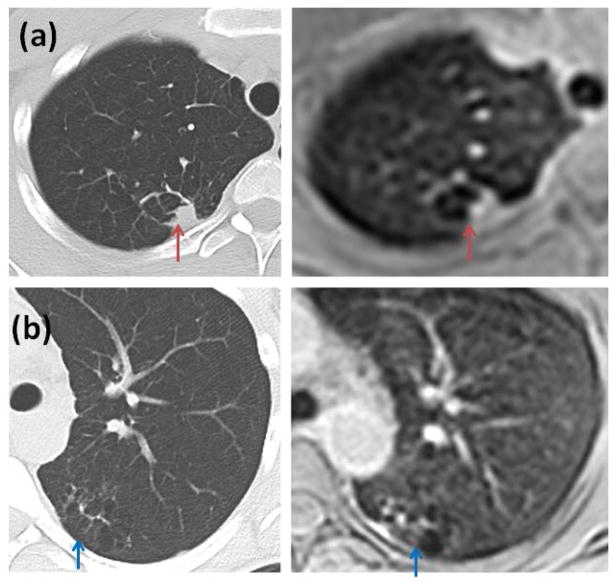
Sample images from a patient are shown in Figure 6. The patient exhibited atelectasis or scarring of lung tissue in the left and right lungs. Comparison scanning with CT done on the same day showed similar findings as non-contrast 3D STAR MRI. Although CT provides higher resolution, MRI provides comparable visualization.
Figure 6.
Scarring or atelectasis exhibited by a patient (CT and MRI done sequentially). (a) CT image compared with lower resolution breath-hold axial MRI image (red arrows) (b) CT image compared with free breathing axial MRI image (blue arrows). Although CT offers higher resolution, MR images provide comparable visualization.
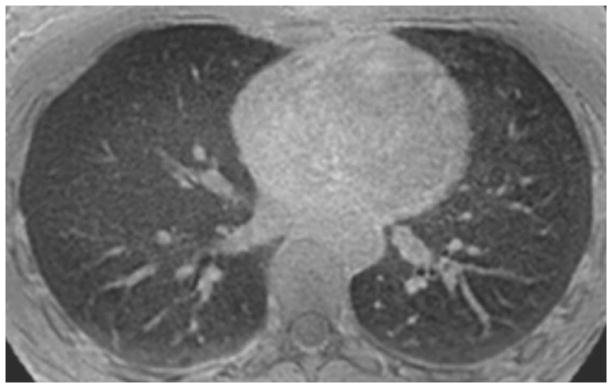
Images obtained with a resolution of 1mm3 are shown in Figure 7. Sub-segmental airways were visible on these higher resolution images.
Figure 7.
Sample high resolution non-contrast MR image obtained with an isotropic resolution of 1 mm using a free breathing 3D STAR trajectory. Nominal scan time was 11 min 40 s. Sub-segmental airways are clearly visible on this image.
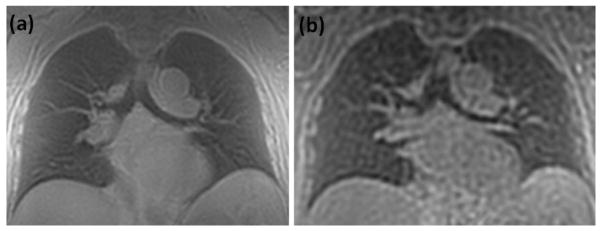
Figure 8 shows breath-hold images obtained using the 3D STAR and the 3D spokes trajectory.
Figure 8.
Comparison images obtained with the (a) 3D STAR and (b) the 3D spokes trajectory. Scan time was 20 s for each case. Resolution was fixed to the same voxel size (32 mm3) for each (2 × 2 × 8 mm3 for 3D STAR and 3.2 × 3.2 × 3.2 mm3 for 3D spokes.
DISCUSSION
While isotropic imaging as done with a 3D spokes trajectory provides reformatted images along the three dimensions, performing separate breath-hold scans (with higher in-plane resolution) along more than one orientation as done here mitigates some of the drawbacks of non-isotropic STAR imaging. Slice encoding along the z direction leads to slightly increased TEs. For example, minimum TE increased by 0.04 ms for BH scans and 0.05 ms for FB scans. While 3D spokes requires no slice encoding, flexibility along slice direction (and consequently scan time) is lost. ZTE imaging (10) on the other hand requires estimation of the data at center of k-space and may be unsuitable for routine imaging.
As mentioned earlier, the objective of this study was to visualize lung parenchyma reliably and evaluate the intrinsic SNR. The Rose criterion (25) from image processing states that an object can be differentiated with 100% certainty when SNR > 5.
The intrinsic speed of a sequence is governed by the required Nyquist sampling frequency (26). Thus, a 3D Cartesian sampling scheme requires (Ny × Nz × TR) scan time where Ny = FOVy/yres and Nz = FOVz/zres; Nx = FOVx/xres samples are acquired each TR. Fulfilling Nyquist criterion for the 3D STAR trajectory requires approximately (Nz × π × NR) acquisitions where NR refers to the number of samples along the radial arm starting from the center of kx–ky space (i.e. NR = Nx/2 = Ny/2). A 3D spokes trajectory needs 4 × π × (NR)2 acquisitions in order to fulfill the Nyquist criterion. In this case, NR = Ny/2 = Nz/2). For the case of isotropic imaging, Nyquist criterion for Cartesian, 3D STAR and 3D spokes based trajectories require acquisitions which scale by 1, π/2 and π, respectively. When Nz < Ny (through plane resolution is lower than in-plane resolution for 3D Cartesian and STAR trajectories), 3D spokes requires even greater acquisition multiples and scan time. Efforts to reduce the scan time include reduced FOV imaging, parallel imaging, compressed sensing (especially for dynamic angiography studies), view sharing (again for dynamic studies) or reducing the angular sampling (for non-Cartesian trajectories) which are equally applicable to all the sampling schemes although the ease of application typically goes down as one goes from 3D Cartesian to 3D STAR to the 3D spokes trajectory. Reduced angular sampling density manifests as noise (reduced SNR) and/or streaking artifacts. In addition, iterative reconstruction methods used to reduce streaking are computationally intensive and dependent on appropriate choice of parameters which could lead to blurring and contrast changes especially when intrinsic contrast is low as for contrast free imaging (27). In short, reconstruction of anatomic images from highly undersampled data sets can be clinically cumbersome. In addition, MRI of lung parenchyma remains a low SNR application and most acceleration methodologies typically result in further SNR reduction. Further reduction in scan time for respiratory triggered scans can be achieved by increasing the shot duration (from ~500 ms or less than 15% of a typical respiratory cycle used here) at the expense of increasing motion artifacts.
To achieve the same voxel resolution for 3D spokes as the breath-hold 3 STAR (2 × 2 × 8 mm3) would imply an isotropic resolution of ~ 3.2 mm3. For our example, the number of acquisitions would be approximately 7760 for 3D STAR and 44300 for the 3D spokes trajectory to get the same voxel volume. If angular sampling density is kept constant, a breath-hold scan which can be performed in ~15 s with STAR trajectory would then require ~1 minute for 3D spokes trajectory, making it prohibitively long. Achieving the same breath-hold time with equivalent voxel size as 3D STAR requires gross under sampling (based on Nyquist criterion) for 3D spokes based trajectories.
SNR for free breathing scans when compared with breath-hold scans were lower than the predicted ratio. This could be related to partial volume effects resulting from two effects. Higher resolution scans provide better separation between lung parenchyma and higher signal vascular and muscle components. Secondly, noise only images were acquired as a second acquisition (a second breath-hold or a second free-breathing acquisition) while the mask employed was from the first acquisition (signal) which could result in slight misregistration errors between the signal and noise images. Increased CV along the coronal slab when compared to the axial slab was due to increased signal in the dependent part of the lungs (28). Breath-hold and free breathing have their own merits. While breath-hold imaging provides relatively lower resolution images, it can be an invaluable tool for a quick scout scan or in clinical situations where time is of the essence. Breath-hold scans of the order of 20 s or less are typically well tolerated in the patient population. On the other hand, although respiratory triggered free breathing scans provide higher resolution, there is an added risk of respiratory and gross motion artifacts which can only be retrospectively realized after the entire scan is completed. This makes the reacquisition of the scan near impossible in a clinical setting where high scanner throughput is a necessity. Although none of the scans needed reacquisition in our study, breath-hold scans offer the advantage of the possibility of reacquisition in case of failure to breath-hold.
Reliable shimming in the chest region is challenging due to the large region of low signal from air in the lungs. Therefore end expiration should be the preferred breath-hold mode. However, performing end inspiration and end expiration MRI could provide information related to tracheomalacia, sleep apnea and other restrictive or obstructive lung diseases and assessment of conditions such as emphysema.
As stated earlier, SENSE could not be used for the axial scans as a result of unfavorable coil direction and wraparound artifacts from motion showing up at the center of the slab. A possible alternative is to use a SENSE factor of 1 with FOV oversampling to move artifacts outside the region of interest (29). At 3T, using a slab selective RF pulse as done here resulted in a minor penalty (~ 7% decrease) in lung signal.
Although T2* at 3T is roughly 2.9 times lower than at 1.5T, the expected SNR is still higher by a factor of 1.8 due to the approximately twofold gain in proton signal at 3T when compared with 1.5T. However, increased inhomogeneity due to background gradients and flow effects could result in higher signal variation at 3T. Further reduction in scan time could be achieved with use of non-Cartesian parallel imaging techniques such as in (30–32). Since the lung exhibits a much reduced proton signal, the increased utility of further acceleration and consequent increase in noise makes the choice of increased acceleration moot.
Contrast-enhancing or signal suppression techniques were not employed in the current study partly due to the difficulty of achieving isotropic contrast enhancement with segmented (along kx – ky) radial acquisition and partly due to the irrelevance of certain contrast techniques (such as fat suppression when lung parenchyma is the tissue of interest). Navigators could have been employed in lieu of respiratory triggering but at the expense of added SAR and acoustic noise.
This study was limited to resolution necessary to reliably visualize lung parenchyma as indicated by the measured intrinsic SNR. Higher resolution scans are possible as demonstrated but at the expense of increased scan time, reduced SNR and possibly increased motion artifacts. SNR was measured only in end expiration for breath-hold scans since parallel imaging can only be reliably used at end expiration. Measured values are likely to vary based on the volume of air remaining at end expiration (resulting in different susceptibility) in addition to any physiological changes. While care was taken to exclude all vascular structures and chest wall through semi-automated thresholding, some variance is possible due to signal and noise images being acquired in different breath-holds or as a second RT scan. Bloch simulations did not take into account susceptibility, B1 inhomogeneity or magnetization transfer effects. Comparison with the 3D spokes was limited to a single case due to the very apparent difference in image quality. The evaluation of MRI and CT scans of the clinical cases was subjective and only looked at the diagnostic value of the images. Image quality was not assessed. However, CT did provide superior images where pathological structures were better defined.
The optimized 3D STAR technique has been shown to potentially provide robust lower resolution breath-hold and higher resolution free breathing full coverage lung images with relatively high SNR. Other favorable properties over competing techniques include the flexibility with respect to slice thickness and the straightforward use of parallel imaging along the slice encoding direction for offsetting scan time against SNR.
Acknowledgments
This work was supported by the Intramural Research Program of the NIH Clinical Center
References
- 1.Hoffman EA, Lynch DA, Barr RG, van Beek EJ, Parraga G Investigators I. Pulmonary CT and MRI phenotypes that help explain chronic pulmonary obstruction disease pathophysiology and outcomes. J Magn Reson Imaging. 2015 doi: 10.1002/jmri.25010. Epub ahead of print. [DOI] [PMC free article] [PubMed] [Google Scholar]
- 2.Kauczor HU, Ley-Zaporozhan J, Ley S. Imaging of pulmonary pathologies: focus on magnetic resonance imaging. Proc Am Thorac Soc. 2009;6(5):458–463. doi: 10.1513/pats.200901-002AW. [DOI] [PubMed] [Google Scholar]
- 3.Wielputz M, Kauczor HU. MRI of the lung: state of the art. Diagn Interv Radiol. 2012;18(4):344–353. doi: 10.4261/1305-3825.DIR.5365-11.0. [DOI] [PubMed] [Google Scholar]
- 4.Zhang WJ, Hubbard Cristinacce PL, Bondesson E, et al. MR Quantitative Equilibrium Signal Mapping: A Reliable Alternative to CT in the Assessment of Emphysema in Patients with Chronic Obstructive Pulmonary Disease. Radiology. 2015;275(2):579–588. doi: 10.1148/radiol.14132953. [DOI] [PubMed] [Google Scholar]
- 5.Atkinson IC, Lu A, Thulborn KR. Characterization and correction of system delays and eddy currents for MR imaging with ultrashort echo-time and time-varying gradients. Magn Reson Med. 2009;62(2):532–537. doi: 10.1002/mrm.22016. [DOI] [PubMed] [Google Scholar]
- 6.Glover GH, Pauly JM. Projection reconstruction techniques for reduction of motion effects in MRI. Magn Reson Med. 1992;28(2):275–289. doi: 10.1002/mrm.1910280209. [DOI] [PubMed] [Google Scholar]
- 7.Gai N, Axel L. Correction of motion artifacts in linogram and projection reconstruction MRI using geometry and consistency constraints. Med Phys. 1996;23(2):251–262. doi: 10.1118/1.597713. [DOI] [PubMed] [Google Scholar]
- 8.Idiyatullin D, Corum C, Park JY, Garwood M. Fast and quiet MRI using a swept radiofrequency. J Magn Reson. 2006;181(2):342–349. doi: 10.1016/j.jmr.2006.05.014. [DOI] [PubMed] [Google Scholar]
- 9.Boada FE, Gillen JS, Shen GX, Chang SY, Thulborn KR. Fast three dimensional sodium imaging. Magn Reson Med. 1997;37(5):706–715. doi: 10.1002/mrm.1910370512. [DOI] [PubMed] [Google Scholar]
- 10.Weiger M, Hennel F, Pruessmann KP. Sweep MRI with algebraic reconstruction. Magn Reson Med. 2010;64(6):1685–1695. doi: 10.1002/mrm.22516. [DOI] [PubMed] [Google Scholar]
- 11.Bergin CJ, Pauly JM, Macovski A. Lung parenchyma: projection reconstruction MR imaging. Radiology. 1991;179(3):777–781. doi: 10.1148/radiology.179.3.2027991. [DOI] [PubMed] [Google Scholar]
- 12.Takahashi M, Togao O, Obara M, et al. Ultra-short echo time (UTE) MR imaging of the lung: comparison between normal and emphysematous lungs in mutant mice. J Magn Reson Imaging. 2010;32(2):326–333. doi: 10.1002/jmri.22267. [DOI] [PMC free article] [PubMed] [Google Scholar]
- 13.Johnson KM, Fain SB, Schiebler ML, Nagle S. Optimized 3D ultrashort echo time pulmonary MRI. Magn Reson Med. 2013;70(5):1241–1250. doi: 10.1002/mrm.24570. [DOI] [PMC free article] [PubMed] [Google Scholar]
- 14.Chen L, Adluru G, Schabel MC, McGann CJ, Dibella EV. Myocardial perfusion MRI with an undersampled 3D stack-of-stars sequence. Med Phys. 2012;39(8):5204–5211. doi: 10.1118/1.4738965. [DOI] [PMC free article] [PubMed] [Google Scholar]
- 15.Chandarana H, Feng L, Ream J, et al. Respiratory Motion-Resolved Compressed Sensing Reconstruction of Free-Breathing Radial Acquisition for Dynamic Liver Magnetic Resonance Imaging. Invest Radiol. 2015 doi: 10.1097/RLI.0000000000000179. [DOI] [PMC free article] [PubMed] [Google Scholar]
- 16.Chandarana H, Block KT, Winfeld MJ, et al. Free-breathing contrast-enhanced T1-weighted gradient-echo imaging with radial k-space sampling for paediatric abdominopelvic MRI. Eur Radiol. 2014;24(2):320–326. doi: 10.1007/s00330-013-3026-4. [DOI] [PubMed] [Google Scholar]
- 17.Peters DC, Korosec FR, Grist TM, et al. Undersampled projection reconstruction applied to MR angiography. Magn Reson Med. 2000;43(1):91–101. doi: 10.1002/(sici)1522-2594(200001)43:1<91::aid-mrm11>3.0.co;2-4. [DOI] [PubMed] [Google Scholar]
- 18.Yu J, Xue Y, Song HK. Comparison of lung T2* during free-breathing at 1.5 T and 3. 0 T with ultrashort echo time imaging. Magn Reson Med. 2011;66(1):248–254. doi: 10.1002/mrm.22829. [DOI] [PMC free article] [PubMed] [Google Scholar]
- 19.Rahmer J, Bornert P, Groen J, Bos C. Three-dimensional radial ultrashort echo-time imaging with T2 adapted sampling. Magn Reson Med. 2006;55(5):1075–1082. doi: 10.1002/mrm.20868. [DOI] [PubMed] [Google Scholar]
- 20.Nichols MB, Paschal CB. Measurement of longitudinal (T1) relaxation in the human lung at 3. 0 Tesla with tissue-based and regional gradient analyses. J Magn Reson Imaging. 2008;27(1):224–228. doi: 10.1002/jmri.21243. [DOI] [PubMed] [Google Scholar]
- 21.Jackson JI, Meyer CH, Nishimura DG, Macovski A. Selection of a convolution function for Fourier inversion using gridding [computerised tomography application] IEEE Trans Med Imaging. 1991;10(3):473–478. doi: 10.1109/42.97598. [DOI] [PubMed] [Google Scholar]
- 22.Kellman P, McVeigh ER. Image reconstruction in SNR units: a general method for SNR measurement. Magn Reson Med. 2005;54(6):1439–1447. doi: 10.1002/mrm.20713. [DOI] [PMC free article] [PubMed] [Google Scholar]
- 23.Constantinides CD, Atalar E, McVeigh ER. Signal-to-noise measurements in magnitude images from NMR phased arrays. Magn Reson Med. 1997;38(5):852–857. doi: 10.1002/mrm.1910380524. [DOI] [PMC free article] [PubMed] [Google Scholar]
- 24.Koay CG, Basser PJ. Analytically exact correction scheme for signal extraction from noisy magnitude MR signals. J Magn Reson. 2006;179(2):317–322. doi: 10.1016/j.jmr.2006.01.016. [DOI] [PubMed] [Google Scholar]
- 25.Rose A. Vision: human and electronic. New York: Plenum; 1973. [Google Scholar]
- 26.Haacke EM. Magnetic resonance imaging : physical principles and sequence design. New York: J. Wiley & Sons; 1999. pp. 191–263. [Google Scholar]
- 27.Wright KL, Hamilton JI, Griswold MA, Gulani V, Seiberlich N. Non-Cartesian parallel imaging reconstruction. J Magn Reson Imaging. 2014;40(5):1022–1040. doi: 10.1002/jmri.24521. [DOI] [PMC free article] [PubMed] [Google Scholar]
- 28.Bankier AA, Storey P, Mai VM, Edelman RR, Chen Q. Gravity-dependent signal gradients on MR images of the lung in supine and prone positions: a comparison with isogravitational signal variability. J Magn Reson Imaging. 2006;23(2):115–122. doi: 10.1002/jmri.20478. [DOI] [PubMed] [Google Scholar]
- 29.Winkelmann R, Bornert P, Nehrke K, Dossel O. Efficient foldover suppression using SENSE. MAGMA. 2005;18(2):63–68. doi: 10.1007/s10334-004-0081-5. [DOI] [PubMed] [Google Scholar]
- 30.Pruessmann KP, Weiger M, Bornert P, Boesiger P. Advances in sensitivity encoding with arbitrary k-space trajectories. Magn Reson Med. 2001;46(4):638–651. doi: 10.1002/mrm.1241. [DOI] [PubMed] [Google Scholar]
- 31.Seiberlich N, Breuer FA, Blaimer M, Barkauskas K, Jakob PM, Griswold MA. Non-Cartesian data reconstruction using GRAPPA operator gridding (GROG) Magn Reson Med. 2007;58(6):1257–1265. doi: 10.1002/mrm.21435. [DOI] [PubMed] [Google Scholar]
- 32.Lustig M, Pauly JM. SPIRiT: Iterative self-consistent parallel imaging reconstruction from arbitrary k-space. Magn Reson Med. 2010;64(2):457–471. doi: 10.1002/mrm.22428. [DOI] [PMC free article] [PubMed] [Google Scholar]


