Abstract
Eosinophilic esophagitis (EoE) is an allergic inflammatory disease of the esophagus featuring increased esophageal interleukin 13 (IL-13) levels and impaired barrier function. Herein, we investigated leucine-rich repeat–containing protein 31 (LRRC31) in human EoE esophageal tissue and IL-13–treated esophageal epithelial cells. LRRC31 had basal mRNA expression in colonic and airway mucosal epithelium. Esophageal LRRC31 mRNA and protein increased in active EoE and strongly correlated with esophageal eosinophilia and IL13 and CCL26 mRNA expression. IL-13 treatment increased LRRC31 mRNA and protein in air-liquid interface–differentiated esophageal epithelial cells (EPC2s). At baseline, differentiated LRRC31-overexpressing EPC2s had increased barrier function (1.9-fold increase in transepithelial electrical resistance [P < 0.05] and 2.8-fold decrease in paracellular flux [P < 0.05]). RNA sequencing analysis of differentiated LRRC31-overexpressing EPC2s identified 38 dysregulated genes (P < 0.05), including 5 kallikrein (KLK) serine proteases. Notably, differentiated LRRC31-overexpressing EPC2s had decreased KLK expression and activity, whereas IL-13–treated, differentiated LRRC31 gene-silenced EPC2s had increased KLK expression and suprabasal epithelial detachment. We identified similarly dysregulated KLK expression in the esophagus of patients with active EoE and in IL-13–treated esophageal epithelial cells. We propose that LRRC31 is induced by IL-13 and modulates epithelial barrier function, potentially through KLK regulation.
INTRODUCTION
Eosinophilic esophagitis (EoE) is a chronic disease of the esophagus that has emerged over the past two decades as a unique and complex clinicopathologic condition associated with esophageal dysfunction.1 The disease is driven by T helper type 2 (Th2) immune responses to food antigens, and recent genetic and genome-wide association studies suggest that the esophageal epithelium has a critical function in EoE pathogenesis.2-5 Anatomically, the lumen of the esophagus is lined with non-keratinized stratified squamous epithelium that is made of 3 layers, organized from the esophageal lumen to the basement membrane as the stratum corneum (SC), the stratum spinosum, and the stratum germinativum (SG).6 In EoE, esophageal tissue has disorganized epithelium with loss of the SC, expansion of the SG, and impaired barrier function (IBF), demonstrated by decreased transepithelial electrical resistance (TER) and increased small-molecule paracellular flux.7 IBF is at least partially caused by the effects of interleukin 13 (IL-13) on esophageal epithelial cells.3 IL-13, which is highly upregulated in esophageal tissue of patients with EoE, is sufficient to promote IBF in differentiated esophageal epithelial cells (EPC2s) grown at the air-liquid interface (ALI).3,7-9 Interestingly, desmoglein-1 (DSG1) is downregulated by IL-13 treatment of these cells and in the esophagus of patients with EoE.7,10 Gene silencing of DSG1 in differentiated EPC2s is sufficient to induce IBF, though not to the extent of that induced by IL-13 treatment. Furthermore, IL-13 is sufficient to alter gene expression of esophageal epithelial cells in vitro, and these changes significantly overlap with the transcriptional changes observed in the esophagus of patients with EoE, including downregulation of epidermal differentiation complex (EDC) genes.9,11 Notably, mutations in EDC genes are associated with diseases involving IBF in the skin, a tissue that has a similar mucosal structure to the esophagus.3
Within the skin, barrier function is maintained in the SC by the cornified cell envelope, which is composed of proteins and lipids that provide mechanical strength and form a hydrophobic barrier, and corneodesmosomes, which are made up of cadherins, DSG1, and desmocollins (DSCs).12 The cornified cell envelope and corneodesmosomes are partially regulated by tissue kallikreins (KLKs), serine proteases that cleave filaggrin (FLG), DSG1, DSCs, and other molecules required for normal barrier formation.12,13 Genetic mutations in FLG and KLK inhibitors, such as serine peptidase inhibitor Kazal type 5 (SPINK5), cause barrier defects in the skin of patients with atopic dermatitis (AD).12 Interestingly, nearly 50% of patients with EoE have concurrent or past AD.3 However, the expression and function of KLKs has not been investigated in the esophageal epithelium or in EoE. Herein, we report that LRRC31 regulates esophageal epithelial barrier function, at least in part by modulating the expression and activity of KLKs.
RESULTS
Identification of LRRC31
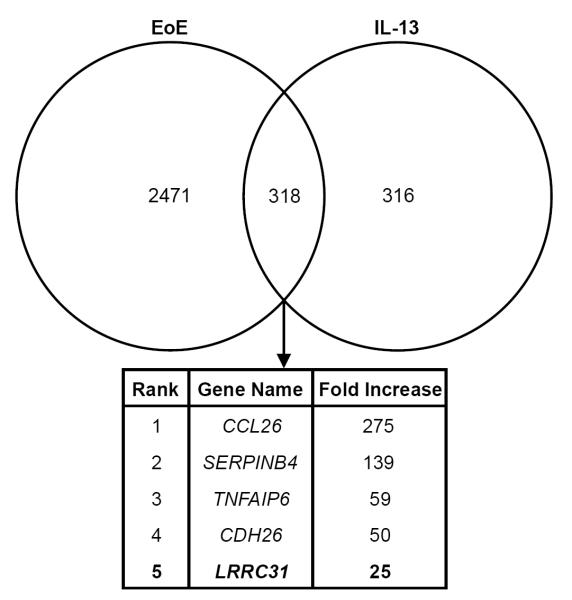
We identified 2789 genes that were differentially expressed ≥ 1.5 fold in EoE (P < 0.05) and 634 genes that were differentially expressed ≥ 1.5 fold in IL-13–treated primary esophageal epithelial cells (P < 0.05) by microarray gene expression analysis. Comparing these two sets of differentially expressed genes, we identified leucine-rich repeat–containing protein 31 (LRRC31) as one of the most highly upregulated genes in the esophagus of patients with active EoE and in IL-13–treated primary esophageal epithelial cells (Figure 1).9,11
Figure 1. Identification of LRRC31.
Venn diagram depicting genes differentially expressed ≥ 1.5 fold in the esophagus in EoE (2789 genes) and in IL-13 treated esophageal epithelial cells (634 genes) by microarray gene expression analysis. Genes overlapping between these two data sets were identified (318 genes). LRRC31 is in bold and was increased 25 fold.
LRRC31 is specifically induced in EoE
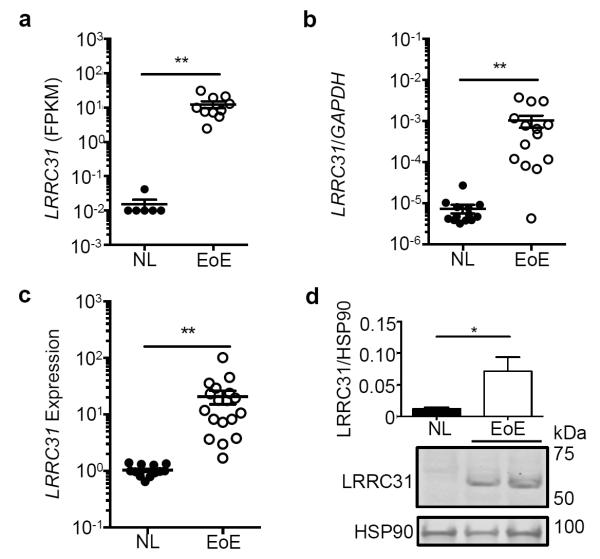
RNA sequencing of esophageal biopsies from controls patients (NL; n = 6) and patients with active EoE (n = 10) showed an EoE-specific 808-fold increase (P < 0.01) in LRRC31 mRNA expression (Figure 2a). In an additional cohort, qPCR detected a 137-fold increase (P < 0.01) in esophageal LRRC31 mRNA expression in patients with active EoE (n = 14) compared to in NL (n = 14) (Figure 2b). We found that LRRC31 mRNA expression increased 18 fold (P < 0.05) in patients with active EoE (n = 18) compared to NL (n = 14) as determined by microarray gene expression analysis (Figure 2c). Western blot analysis showed that LRRC31 protein was readily detectable in active EoE patient esophageal tissue and increased 6 fold (P < 0.05) in active EoE compared to NL patient esophageal tissue (Figure 2d). These cumulative data indicate upregulation of LRRC31 mRNA and protein expression occurs in the esophagus of patients with active EoE.
Figure 2. LRRC31 expression in the esophagus.
a, LRRC31 mRNA expression in esophageal biopsies of 16 subjects (6 normal controls [NL], 10 active eosinophilic esophagitis [EoE]) determined by RNA sequencing analysis. b, Normalized LRRC31 mRNA expression in esophageal biopsies (13 NL, 14 EoE) determined by quantitative PCR (qPCR) analysis. c, Normalized LRRC31 mRNA expression in esophageal biopsies (14 NL, 18 EoE) determined by microarray gene expression analysis. d, LRRC31 (61.5 kD) protein expression in esophageal biopsies (12 NL, 13 EoE) determined by western blot analysis. Image shown is a representative experiment; HSP90 (90 kD) loading control is shown. Expression level of LRRC31 protein was quantified and normalized to the level of HSP90 protein (mean normalized signal of all patients are graphed). For a-c, data points represent individual subjects. For a-d, data are represented as the mean ± SEM. *P < 0.05, **P < 0.01.
LRRC31 is expressed in the colon and mucosal tissue
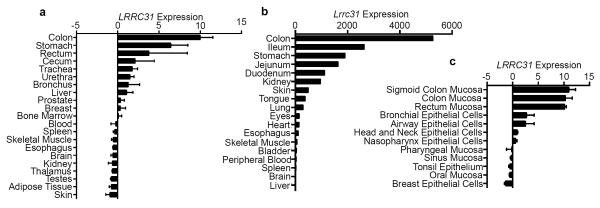
Interestingly, microarray gene expression analysis of a spectrum of human tissues derived from healthy controls retrieved from BioGPS.org revealed that the colon had the highest expression levels of LRRC31 mRNA, whereas the esophagus did not express detectable levels of LRRC31 mRNA under homeostatic conditions (Figure 3a).14,15 Quantitative PCR (qPCR) analysis of Lrrc31 mRNA in C57BL/6 murine tissue exhibited a similar pattern of expression, with the colon having the highest mRNA expression and the esophagus having no detectable mRNA expression under homeostatic conditions (Figure 3b). An additional survey of microarray gene expression data from more specific human tissue compartments retrieved from BioGPS.org identified that mucosal epithelia showed the highest LRRC31 mRNA expression, specifically the mucosal epithelium of the large intestine and bronchial and airway epithelial cells (Figure 3c).14,15 Collectively, these data suggest that LRRC31 mRNA displays a conserved pattern of homeostatic expression, in that it is highly expressed in the mucosal epithelium of the colon and lung, and not expressed in the esophagus.
Figure 3. Expression of LRRC31 in human and murine tissue.
a, Normalized LRRC31 mRNA expression in various normal human tissues determined by microarray expression analysis. Data from GeneAtlas microarray dataset.14,15 b, Normalized Lrrc31 mRNA expression in various normal murine tissues (C57BL/6) determined by qPCR analysis. c, Normalized LRRC31 mRNA expression in healthy human mucosal epithelium and epithelial cell lines determined by microarray expression analysis. Data from Barcode on Normal Tissue microarray dataset.14,15 For a and c, data are represented as the mean ± SEM.
LRRC31 expression parallels disease activity
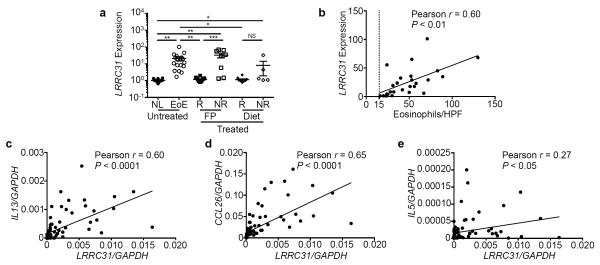
EoE cases were stratified by responsiveness to topical fluticasone propionate (FP), a glucocorticoid that has been shown to be effective in controlling disease activity, and to diet therapy. LRRC31 mRNA expression decreased 17 fold (P < 0.01) in FP-responsive cases (n = 14) but remained increased 32 fold (P < 0.001) in FP-unresponsive cases (n = 8) as determined by microarray gene expression analysis (Figure 4a).9 Furthermore, LRRC31 mRNA expression decreased 18 fold (P < 0.05) in diet-responsive cases (n = 10), but did not change in diet-unresponsive cases (n = 5) (Figure 4a). These data indicate that LRRC31 mRNA is dynamically expressed as a function of disease activity.
Figure 4. LRRC31 correlation with esophageal eosinophilia and disease-associated gene expression.
a, Normalized LRRC31 mRNA expression in esophageal biopsies of patients with untreated, fluticasone propionate (FP)–treated, or diet therapy–treated EoE (14 normal controls [NL], 18 active eosinophilic esophagitis [EoE], 24 EoE treatment responders [R], 12 EoE treatment non-responders [NR]) by microarray gene expression analysis. b, Correlation of biopsy eosinophil count per high-power field (hpf) and normalized LRRC31 mRNA expression in esophageal biopsies of patients with active EoE determined by microarray gene expression analysis. Dotted line represents 15 eosinophils/hpf, the diagnostic threshold for EoE. Correlation of normalized LRRC31 mRNA expression with normalized IL13 (c), CCL26 (d), and IL5 (e) mRNA expression in esophageal biopsies of patients with active EoE determined by qPCR analysis. For a, data points represent individual subjects and data are represented as the mean ± SEM. NS, not significant; *P < 0.05, **P < 0.01, ***P < 0.001.
LRRC31 expression correlates with esophageal eosinophilia and IL13 expression
LRRC31 mRNA expression showed a strong positive correlation (Pearson r = 0.60, P < 0.01) with esophageal eosinophil levels (Figure 4b) and with esophageal IL13 mRNA expression (Pearson r = 0.60, P < 0.0001) (Figure 4c).7,9 Esophageal LRRC31 mRNA expression also had a strong positive correlation with chemokine (C-C- motif) ligand 26 (CCL26) mRNA expression (Pearson r = 0.65, P < 0.0001), an eosinophil chemokine and IL-13–induced gene (Figure 4d).9,11 In contrast, LRRC31 mRNA expression had a weak positive correlation with the eosinophil pro-differentiation, activation, and survival cytokine interleukin 5 (IL5) mRNA expression (Pearson r = 0.27, P < 0.05) (Figure 4e).16
IL-13 induces LRRC31 in epithelial cells
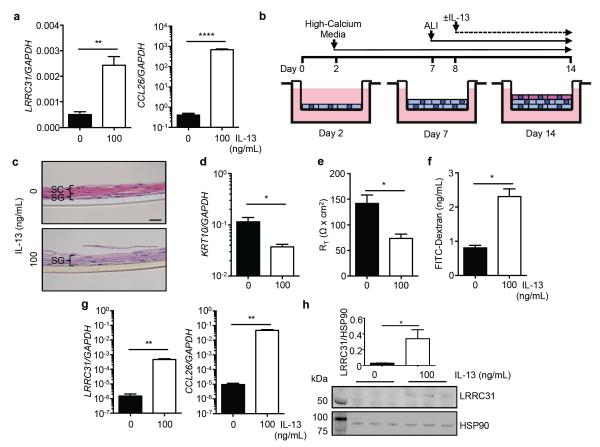
Induction of LRRC31 mRNA expression in IL-4–treated human bronchial epithelial cells and in IL-13–treated human tracheal epithelial cells has been previously reported (Supplementary Figure 1a,b).17,18 Since we identified the colon as the tissue where LRRC31 mRNA is most abundantly expressed, we treated Caco2-bbe cells (colorectal adenocarcinoma cells, brush border expressing clone) with IL-13 and found that LRRC31 mRNA expression increased 2.7 fold (P < 0.05) and CCL26 mRNA expression increased 62 fold (P < 0.05) as determined by qPCR analysis (Supplementary Figure 1c). Similarly, in primary esophageal epithelial cells treated with IL-13, LRRC31 mRNA expression increased 28 fold (P < 0.05) and CCL26 mRNA expression increased 56 fold (P < 0.001) as determined by microarray gene expression analysis (Supplementary Figure 1d).9 We used qPCR analysis to replicate this observation in primary esophageal epithelial cells derived from separate patients, treated with IL-13 (100 ng/mL, 48 hours), and found that LRRC31 mRNA expression increased 4.8 fold (P < 0.01) and CCL26 mRNA expression increased 1705 fold (P < 0.0001) (Figure 5a). To determine if LRRC31 was a direct target of IL-13–STAT6 signaling, we identified two putative STAT6 binding sites within the 2 kb upstream putative promoter of LRRC31 using publicly available ChIP-Seq data from CD4+ T cells (Supplementary Figure 2a).19 However, using a luciferase reporter assay we observed a 1.2 fold decrease in luciferase activity in TE-7 esophageal epithelial cells transfected with the LRRC31 gene promoter following IL-13 treatment; as a positive control, the CCL26 2 kb upstream gene promoter had an 11 fold increase in luciferase activity following IL-13 treatment (Supplementary Figure 2b). Interestingly, LRRC31 mRNA expression was not induced in EPC2 esophageal epithelial cells grown in vitro in submerged, undifferentiated monolayer culture (data not shown).
Figure 5. LRRC31 expression in esophageal epithelial cells.
a and CCL26 mRNA expression in primary esophageal epithelial cells treated with IL-13 (100 ng/mL) for 48 hours determined by qPCR analysis. b, Differentiated EPC2 esophageal epithelial cells were grown for 12 days in high-calcium media. Cells were brought to the ALI starting at day 7, and ±IL-13 treatment (100 ng/mL) started at day 8. c, Hematoxylin and eosin (H&E)-stained sections of differentiated EPC2s at day 14. Stratum corneum (SC, pink layer) and stratum germinativum (SG, purple layer) are indicated. A representative experiment is shown (n = 3). Scale bar represents 20 μm. d, Normalized LRRC31 and CCL26 mRNA expression in differentiated EPC2s at day 14 determined by qPCR. A representative experiment is shown (n = 3). e, LRRC31 protein expression in differentiated EPC2s at day 14 determined by western blot analysis. Image shown is a representative experiment (n = 3); HSP90 (90 kD) loading control is shown. Left lane is the molecular weight ladder. Expression level of LRRC31 protein was quantified and normalized to the level of HSP90 protein. For a and d-h, data are represented as the mean ± SEM; *P < 0.05, **P < 0.01, **** P < 0.0001.
Therefore, we used EPC2s grown at the air-liquid interface (ALI) in high-calcium conditions to induce differentiation and stratification, in order to model the in vivo esophageal epithelium more accurately (Figure 5b). Briefly, EPC2s were grown on a permeable transwell support in low calcium ([Ca2+] = 0.09 mM) for 2 days, followed by high calcium ([Ca2+] = 1.8 mM) for the next 12 days. Cells were brought to the ALI on day 7 and grown until day 14 at the ALI, resulting in an in vitro stratified squamous epithelium. Hematoxylin and eosin (H&E)-stained differentiated EPC2s at day 14 demonstrated well-defined SC and SG (Figure 5c). The addition of IL-13 at day 8 to EPC2s grown at the ALI followed by H&E staining at day 14 showed disrupted formation of the epithelium with loss of the SC and expansion of the SG, a characteristic seen in the esophagus of patients with active EoE (Figure 5c).1,7 In addition, differentiated EPC2s, verified by increased KRT10 mRNA expression, demonstrated a marked increase in barrier function, assessed by increased TER and decreased paracellular flux.7 IL-13 treatment decreased KRT10 mRNA expression levels 3.1 fold (P < 0.05), impaired barrier formation as indicated by decreased TER (1.9 fold, P < 0.05), and increased paracellular flux (2.8 fold, P < 0.05), modeling the IBF observed in the esophageal epithelium of patients with active EoE (Figure 5d-f). Interestingly, LRRC31 mRNA expression was increased 312 fold (P < 0.01) and CCL26 mRNA expression increased 4853 fold (P < 0.01) in IL-13–treated, differentiated EPC2s compared to untreated, differentiated EPC2s, as demonstrated by qPCR analysis (Figure 5g). In addition, LRRC31 protein expression was detectable by western blot analysis in IL-13–treated, differentiated EPC2s, and its expression relative to HSP90 loading control was increased 14 fold (P < 0.05) compared to untreated, differentiated EPC2s (Figure 5h). These data show that LRRC31 mRNA and protein were induced in epithelial cells treated with IL-13.
Overexpression of LRRC31 increases barrier function
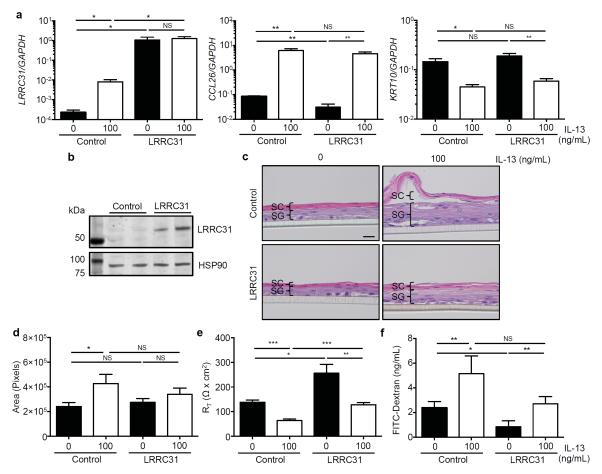
In order to understand the function of LRRC31 in the esophageal epithelium, we overexpressed LRRC31 in differentiated EPC2s. Briefly, EPC2s were transduced with either empty vector (control) or FLAG epitope-tagged LRRC31 lentiviral expression constructs and grown at the ALI. LRRC31 mRNA expression increased 36 fold (P < 0.05) in IL-13–treated control EPC2s and 4423 fold (P < 0.05) in untreated LRRC31-overexpressing EPC2s when compared to untreated control EPC2s as determined by qPCR analysis (Figure 6a). Following IL-13 treatment, LRRC31 mRNA expression showed a 154-fold increase (P < 0.05) in LRRC31-overexpressing EPC2s compared to IL-13–treated control EPC2s as determined by qPCR analysis (Figure 6a). CCL26 mRNA expression increased 73 fold (P < 0.01) in IL-13–treated control EPC2s and 148 fold (P < 0.01) in IL-13–treated LRRC31-overexpressing EPC2s as determined by qPCR analysis (Figure 6a). KRT10 mRNA expression decreased 3.2 fold (P < 0.05) in IL-13–treated control EPC2s and 3.2 fold (P < 0.01) in IL-13–treated LRRC31-overexpressing EPC2s compared to untreated EPC2s as determined by qPCR analysis (Figure 6a). Western blot analysis confirmed a marked increase in LRRC31 protein expression in LRRC31-overexpressing EPC2s compared to control EPC2s (Figure 6b).
Figure 6. Epithelial barrier function in differentiated LRRC31-overexpressing EPC2 cells.
EPC2 esophageal epithelial cells transduced with either empty vector (control) or flag-epitope tagged LRRC31 lentiviral expression constructs were cultured as described in Figure 5b. a, Normalized LRRC31, CCL26, and KRT10 mRNA expression in differentiated control and LRRC31-overexpressing (LRRC31) EPC2s at day 14 determined by qPCR analysis. A representative experiment shown (n = 3). b, LRRC31 (61.5 kD) protein expression in differentiated control and LRRC31-overexpressing EPC2s at day 14 determined by western blot analysis. Image shown is a representative experiment (n = 3); HSP90 (90 kD) loading control is shown. Left lane is the molecular weight ladder. c, H&E staining of differentiated control and LRRC31-overexpressing EPC2s at day 14. Scale bar represents 20 μm. A representative experiment is shown (n = 3). d, Cross-sectional area of H&E stained sections from differentiated control and LRRC31-overexpressing EPC2s at day 14. A representative experiment is shown (n = 3). e, TER measured across differentiated control and LRRC31-overexpressing EPC2s at day 14. A representative experiment is shown (n = 3). RT, resistance. f, FITC-dextran (3-5 kD) paracellular flux measured at 3 hours after FITC-dextran was added to luminal surface of differentiated control and LRR31-overexpressing EPC2s at day 14. A representative experiment is shown (n = 3). For a and d-f, data are represented as the mean ± SEM; NS, not significant; *P < 0.05, **P < 0.01, ***P < 0.001.
H&E staining of untreated control EPC2s and untreated LRRC31-overexpressing EPC2s showed similar histology (Figure 6c). Interestingly, IL-13–treated control EPC2s had increased epithelial thickness (1.8 fold, P < 0.05) with loss of the SC and expansion of the SG when compared to untreated control EPC2s (Figure 6d). However, untreated and IL-13–treated LRRC31-overexpressing EPC2s had similar epithelial thickness and morphology (Figure 6c, 6d). In assessing the IBF of IL-13–treated EPC2s, we found TER decreased 2.2 fold (P < 0.001) in control EPC2s and 2.0 fold (P < 0.01) in LRRC31-overexpressing EPC2s (Figure 6e). However, untreated LRRC31-overexpressing EPC2s had 1.9-fold increased (P < 0.05) TER when compared to untreated control EPC2s, and IL-13–treated LRRC31-overexpressing EPC2s had 2.0-fold increased (P < 0.001) TER when compared to IL-13–treated control EPC2s (Figure 6e). Similarly, IL-13 treatment increased paracellular flux 2.1 fold (P < 0.05) in control EPC2s and 2.2 fold (P < 0.05) in LRRC31-overexpressing EPC2s (Figures 6f). Furthermore, untreated LRRC31-overexpressing EPC2s had 2.8-fold increased (P < 0.05) paracellular flux compared to untreated control EPC2s (Figure 6f). Taken together, these data suggest a function for LRRC31 in regulating the esophageal epithelial barrier function in vitro.
LRRC31 regulates epithelial serine proteases
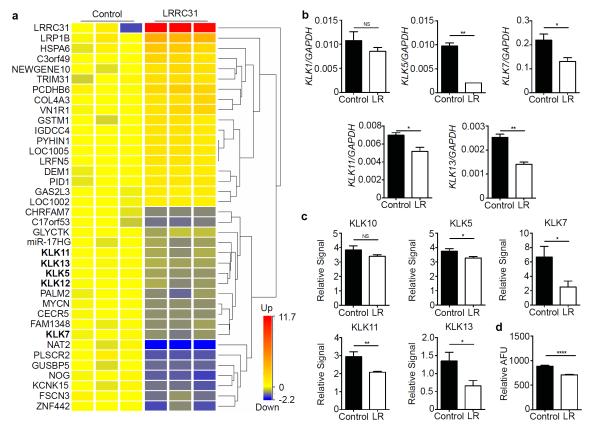
We undertook RNA-sequencing analysis to gain insight into the mechanism by which LRRC31 regulated the epithelial barrier. Applying a moderated t-test with Benjamini-Hochberg False Discovery Rate analysis (P < 0.05), we identified 38 genes that changed ≥ 1.5 fold in differentiated LRRC31-overexpressing EPC2s when compared to control EPC2s (Figure 7a). As expected, the most highly upregulated mRNA transcript in the LRRC31-overexpressing EPC2s was LRRC31. Among the downregulated mRNA transcripts was noggin (NOG), a ligand that antagonizes bone morphogenetic proteins (BMPs), which are members of the transforming growth factor β (TGFβ)-family of cytokines.20 Interestingly, gene ontology analysis done using the Database for Annotation, Visualization, and Integrated Discovery (DAVID) identified one cluster of 5 KLK serine proteases, KLK5, KLK7, KLK11, KLK12, and KLK13, with an enrichment score of 2.71, which were downregulated in LRRC31-overexpressing EPC2s, suggesting that LRRC31 may be a negative regulator of KLK proteases.21,22
Figure 7. Differentiated LRRC31-overexpressing EPC2 cell transcriptome.
a, Heat diagram representing RNA sequencing analysis of differentiated empty vector (control) and LRRC31-overexpressing EPC2s. Differentially expressed genes were identified by filtering on FPKM ≥ 1, moderated t-test with Benjamini-Hochberg False Discovery Rate (P < 0.05), and fold change ≥ 1.5. KLK family members are bolded. b, Normalized KLK1, KLK5, KLK7, KLK11, and KLK13 mRNA expression in differentiated control and LRRC31-overexpressing (LR) EPC2s determined by qPCR analysis. A representative experiment is shown (n = 3). c, Total protein normalized KLK10, KLK5, KLK7, KLK11, and KLK13 protein expression in differentiated control and LRRC31-overexpressing EPC2 supernatants determined by protease array analysis. A representative experiment is shown (n = 3). d, KLK serine protease activity in differentiated control and LRRC31-overexpressing EPC2 supernatants (AFU, arbitrary fluorescence units normalized to total protein). A representative experiment is shown (n = 3). For b-d, data are represented as the mean ± SEM; NS, not significant; *P < 0.05, **P < 0.01, ****P < 0.0001.
We further showed decreased KLK5 (4.74 fold, P < 0.01), KLK7 (1.68 fold, P < 0.05), KLK11 (1.35 fold, P < 0.05), and KLK13 (1.81 fold, P < 0.01) mRNA expression in LRRC31-overexpressing EPC2s in an independent experiment by qPCR analysis; KLK1 mRNA expression was unchanged as a control (Figure 7b). Moreover, using a protease array, we detected decreased protein expression of KLK5 (1.15 fold, P < 0.05), KLK7 (2.7 fold, P < 0.05), KLK11 (1.4 fold, P < 0.01), and KLK13 (2.1 fold, P < 0.05) in the supernatants of LRRC31-overexpressing EPC2s; KLK10 protein expression was unchanged as a control (Figure 7c). The supernatants from LRRC31-overexpressing EPC2s also had decreased KLK protease activity (1.25-fold, P < 0.05), assessed using a fluorogenic peptide substrate specific for KLK4, KLK5, KLK8, KLK13, and KLK14 (Figure 7d). Taken together, these data support the observation that KLK proteases are negatively regulated by LRRC31.
Loss of LRRC31 increases KLK expression
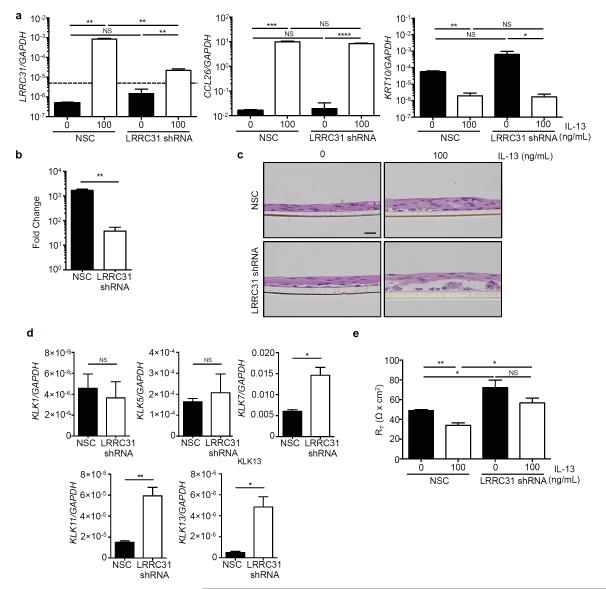
In order to understand the function of LRRC31 in response to IL-13 treatment, we used short-hairpin RNA (shRNA) to silence LRRC31 mRNA expression in differentiated EPC2s. Briefly, EPC2s were transduced with non-silencing control (NSC) or LRRC31-specific shRNA-containing lentiviral expression constructs and grown at the ALI. At baseline, the LRRC31 mRNA expression was below the limit of detection by qPCR (≥ 34 CT). Following IL-13 treatment, LRRC31 mRNA expression was detected in NSC EPC2s and was reduced 31 fold (P < 0.01) in LRRC31 gene-silenced EPC2s (Figure 8a,b). As a control, CCL26 and KRT10 mRNA expression was not decreased in LRRC31 gene-silenced EPC2s (Figure 8a). Notably, following IL-13 treatment LRRC31 gene-silenced EPC2s had suprabasal detachment within the SG (Figure 8c, Supplementary Figure 3).
Figure 8. KLK expression following LRRC31 gene-silencing in differentiated EPC2 cells.
EPC2 esophageal epithelial cells transduced with either non-silencing control (NSC) or LRRC31 short hairpin RNA (LRRC31 shRNA) lentiviral expression constructs were cultured as described in Figure 5b. a, Normalized LRRC31 and CCL26 mRNA expression in differentiated NSC and LRRC31 shRNA EPC2s at day 14 determined by qPCR analysis. Dashed line represents limit of detection. b, Fold change in LRRC31 mRNA expression following IL-13–treatment in differentiated NSC and LRRC31 shRNA EPC2s at day 14. c, H&E-stained sections from differentiated NSC and LRRC31 shRNA EPC2s at day 14. d, Normalized KLK1, KLK5, KLK7, KLK11, and KLK13 mRNA expression in IL-13–treated differentiated NSC and LRRC31 shRNA EPC2 cells at day 14 determined by qPCR. e, TER measured across differentiated NSC and LRRC31 shRNA EPC2s at day 14. RT, resistance. For a-e, a representative experiment is shown (n = 3). For a, b, d, and e, data are represented as the mean ± SEM; NS, not significant; *P < 0.05, **P < 0.01, ***P < 0.001, ****P < 0.0001.
Since LRRC31-overexpressing EPC2s had decreased expression of KLK proteases, we used qPCR analysis to determine the expression of KLK mRNA in IL-13–treated LRRC31 gene-silenced EPC2s. We identified increased mRNA expression levels for KLK7 (2.4 fold, P < 0.05), KLK11 (3.9 fold, P < 0.01), and KLK13 (9.5 fold, P < 0.05) in IL-13–treated LRRC31 gene-silenced EPC2s compared to NSC EPC2s (Figure 8d). However, KLK1 and KLK5 mRNA expression did not change in IL-13–treated LRRC31 gene-silenced EPC2s compared to NSC EPC2s (Figure 8d).
In addition, TER decreased 1.4 fold (P < 0.01) in IL-13–treated NSC EPC2s, but was similar in untreated and IL-13–treated LRRC31 gene-silenced EPC2s (Figure 8e). However, the TER in untreated LRRC31 gene-silenced EPC2s was increased 1.5 fold (P < 0.05) compared to untreated NSC EPC2s, and the TER in IL-13–treated LRRC31 gene-silenced EPC2s was increased 1.7 fold (P < 0.05) compared to IL-13–treated NSC EPC2s (Figure 8e). These data show that IL-13–treated, differentiated LRRC31 gene-silenced EPC2s have disrupted epithelial morphology and decreased IBF, which may result from increased KLK expression.
KLK expression in EoE and in response to IL-13
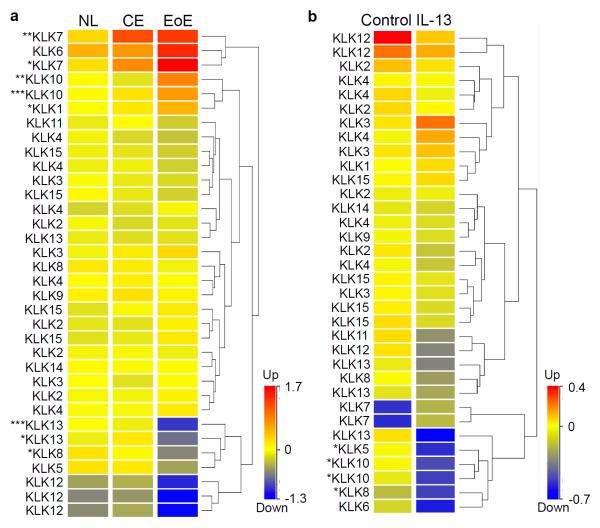
We sought to characterize the changes in KLK expression in the esophagus of patients with active EoE and in primary esophageal epithelial cells following IL-13 treatment. In the esophagus, we identified downregulation of KLK8 (P < 0.05) and KLK13 (P < 0.05) mRNA expression specifically in patients with active EoE compared to control patients, using ANOVA analysis (P < 0.05) on microarray gene expression data (Figure 9a). In contrast, there was increased KLK7 (P < 0.05) and KLK10 (P < 0.01) mRNA expression in both chronic esophagitis (CE) and EoE. In primary esophageal epithelial cells treated with IL-13, we identified downregulation of KLK5 (P < 0.05), KLK8 (P < 0.05), and KLK10 (P < 0.05) mRNA expression using a moderated t-test analysis (P < 0.05) (Figure 9b). No KLKs were significantly upregulated by IL-13 treatment of primary esophageal epithelial cells. Taken together, these data show dysregulation of KLKs, specifically downregulation of KLK13 and KLK5 in EoE and in primary esophageal epithelial cells following IL-13 treatment, respectively.
Figure 9. KLK expression in esophageal biopsies and IL-13–treated primary esophageal epithelial cells.
a, Heat diagram of KLK mRNA expression in esophageal biopsies of NL, chronic esophagitis (CE), and EoE patients determined by microarray gene expression analysis. b, Heat diagram of KLK mRNA expression in primary esophageal epithelial cells stimulated with IL-13 (100 ng/mL) for 48 hours determined by microarray gene expression analysis. Each row represents one microarray probe. Hierarchical clustering used to analyze data and generate heat diagrams. Statistical analysis by ANOVA (a) and moderated t-test (b) with P < 0.05. *P < 0.05, **P < 0.01, ***P < 0.001.
DISCUSSION
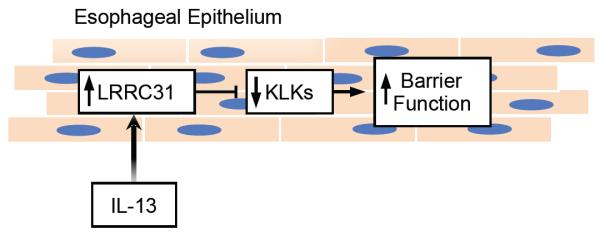
The data presented herein characterize the expression, cytokine regulation, and role of LRRC31 in esophageal cells. We identified LRRC31 as a dysregulated gene in both the active EoE esophagus and in esophageal epithelial cells treated with IL-13. We provide evidence that LRRC31 mRNA and protein is increased in the esophagus of patients with EoE, is normalized following FP and diet therapy, but remains increased in patients who had EoE resistant to therapy. It is notable that even diet non-responders had a decrease in LRRC31 mRNA expression, suggesting that its change may be an early biomarker of response. LRRC31 mRNA expression significantly correlated with biopsy eosinophils, IL13, and CCL26 mRNA expression and was induced by IL-13 in differentiated esophageal epithelial cells. Furthermore, LRRC31-overexpressing EPC2s had increased epithelial barrier function in parallel with decreased KLK protein expression and protease activity. Several KLKs expressed in the esophagus were dysregulated in EoE and in epithelial cells following IL-13 treatment, which overlapped with KLKs dysregulated in differentiated LRRC31-overexpressing EPC2s. Taken together, we propose that LRRC31 is induced in the esophageal epithelium by IL-13 and regulates esophageal epithelial barrier function likely by modulating expression and activity of KLKs, at least in part (Figure 10).
Figure 10. Function of LRRC31 in the esophageal epithelium.
IL-13 induces LRRC31 expression in esophageal epithelial cells that inhibits specific KLKs to increase barrier function.
To understand how LRRC31 may regulate esophageal epithelial barrier function, we undertook RNA sequencing analysis of differentiated LRRC31-overexpressing EPC2s. Interestingly, overexpressing LRRC31 resulted in downregulation of noggin (NOG) mRNA expression. NOG is an antagonist of the BMP signaling pathway, which regulates esophageal differentiation during development.20,23 Interestingly, BMP signaling was shown to be active in differentiated squamous epithelium but not in basal progenitor cells, which express follistatin, another BMP antagonist like NOG.20 In both human esophageal biopsies from EoE patients and in a mouse model of EoE, reduced esophageal epithelial squamous differentiation is associated with high levels of follistatin and disrupted BMP signaling.20 Thus, downregulation of NOG in LRRC31-overexpressing EPC2s supports a role for LRRC31 as a negative regulator of esophageal epithelial differentiation, possibly contributing to IBF.
Five KLK serine proteases, which have been shown to regulate skin barrier function in AD, were also downregulated in differentiated LRRC31-overexpressing EPC2s.12 This finding was particularly notable considering the recent association of genetic variants in the intracellular cysteine protease calpain-14 (CAPN14) in patients with EoE, and emerging literature indicating that KLKs and CAPNs share common substrates; for example, KLK6 and CAPN1 both cleave α-synuclein in neurons.5,12,24 KLKs are extracellular proteases that are secreted in the SC of stratified squamous epithelium and cleave substrates such as DSG1, corneodesmosin, and DSCs.12 Interestingly, DSG1 is downregulated in the esophagus in EoE and in primary esophageal epithelial cells following IL-13 treatment, and gene silencing of DSG1 in differentiated EPC2s resulted in IBF in vitro.7 It is interesting to speculate that the balance between esophageal epithelial proteases such as CAPNs and KLKs, and protease inhibitors such as SPINKs and serine protease inhibitors (SERPINs), may be lost, subsequently compromising the epithelial barrier function, as occurs in AD.12 In vitro models may not accurately replicate the balance between proteases or the complex biological state found in vivo. For example, the barrier function in LRRC31 overexpressing EPC2 cells may have increased in the absence of IL-13, and upon IL-13 treatment decreased similar to control EPC2 cells, because additional molecules in the LRRC31 pathway were not expressed in the absence of IL-13 treatment in EPC2 cells. Alternatively, LRRC31 may be counterregulatory, a function that is further supported by gene silencing of LRRC31 in differentiated EPC2s.
Gene silencing of LRRC31 in differentiated EPC2s showed suprabasal detachment of the epithelium when treated with IL-13. It is notable that LRRC31 gene silenced EPC2s had modulated barrier function using TEER but not paracellular flux (Supplementary Figure 4). LRRC31 gene-silenced EPC2s also had increased mRNA expression of KLK7, KLK11, and KLK13 following IL-13 treatment. These data further support a role for LRRC31 in regulating KLK expression, activity, and protease equilibrium, which subsequently disrupts normal differentiation of non-keratinized stratified squamous epithelium in vitro. Interestingly, KLKs are dysregulated in EoE and in IL-13–treated primary esophageal epithelial cells in a manner that overlaps with LRRC31-overexpressing EPC2s. Thus, IL-13–induced LRRC31 may be specifically regulating a subset of KLKs in the esophageal epithelial response to IL-13 and in EoE.
On the basis of its primary amino acid sequence, the primary isoform of LRRC31 (Q6UY01-1; 552 amino acids) is predicted to contain nine leucine rich repeats (LRRs) (Supplementary Figure 5a). Additionally, LRRC31 contains a putative nuclear export signal (NES; amino acids 113-121) and a nuclear localization signal (NLS; amino acids 517-545).25-27 Differential exon splicing of LRRC31 produces two additional translated isoforms (Q6UY01-2 and Q6UY01-3 are 496 amino acids and 346 amino acids, respectively) that each possess a different complement of LRRs than the primary isoform (Supplementary Figure 5a). Using the I-TASSER (Iterative Threading Assembly Refinement) server for protein and structural predictions, LRRC31 is predicted to have a horseshoe-shaped tertiary structure with a hydrophobic substrate-binding pocket (Supplementary Figure 5b).28 This structure suggests LRRC31 participates in protein-protein interactions. Ribonuclease/angiogenin inhibitor 1, a ribonuclease inhibitor that binds to endogenous and exogenous ribonucleases to block ribonuclease activity, shared the highest homology score with LRRC31 (score = 224; E value = 1 × 10⁻¹⁹) (Supplementary Figure 6a).29,30 Additional homologous molecules include other members of the LRR-containing family of proteins such as LRRC32 and LRRC34, members of the NLRP (NACHT [NAIP – neuronal apoptosis inhibitor protein, CIITA – class II major histocompatibility complex transactivator, HET-E – incompatibility locus protein from Podospora anserine, TP1 – telomerase-associated protein], LRR, and pyrin domain [PYD] or NOD-like receptor family PYD containing) family of inflammasome proteins, antigen-sensing and immune-activating toll-like receptors, and adaptor proteins involved in ubiquitination and post-translational regulation of signaling pathways, such as flightless-1 homolog. These molecules participate in immunomodulatory events within cells.31-33 It is notable that LRRC31 is highly conserved in humans, primates, and even through Xenopus tropicalis, consistent with a non-redundant function for this protein (Supplementary Figure 6b).34
In summary, we have shown that LRRC31 is specifically increased in EoE and dynamically expressed as a function of disease activity and therapy, and its expression is proportional to esophageal eosinophilia and IL13 mRNA expression. LRRC31 is induced by IL-13 treatment in epithelial cells, including differentiated esophageal epithelial cells. Considering the downregulation of KLKs and reduced KLK protease activity in differentiated LRRC31-overexpressing cells, we propose that LRRC31 is induced by IL-13 and regulates epithelial barrier function in the esophagus possibly by modulating expression of tissue KLKs.
METHODS
Patient sample selection
Diagnosis was established based on the maximum eosinophil count of > 15 per 400X high-power field (hpf).11 Normal control (NL) patients were defined as having no history of EoE, 0 eosinophils per hpf in the esophagus at the time of biopsy, and no concomitant swallowed glucocorticoid treatment. EoE patients were defined as having > 15 eosinophils per hpf in the esophagus and no concomitant swallowed glucocorticoid treatment in patients on proton pump inhibitor (PPI) therapy; except for the samples in the microarray experiment.11 EoE patients receiving topical/swallowed fluticasone propionate glucocorticoid therapy (FP) and diet therapy were defined as responders (R) if they had ≤ 1 eosinophil per hpf at the time of biopsy or as non-responders (NR) if they had ≥ 6 eosinophils per hpf.
Microarray gene expression analysis
For each patient, 1 distal esophageal biopsy sample was immersed in RNAlater (QIAGEN, Hilden, Germany) and total RNA was extracted using the RNeasy Mini Kit (QIAGEN). Hybridization to human Affymetrix U133 Plus 2.0 GeneChip DNA microarray (Affymetrix, Santa Clara, CA) was performed by the Microarray Core at CCHMC.35 Gene transcript levels were determined following quantification and normalization of microarray data using GeneSpring (Agilent Technologies, Santa Clara, CA).
RNA Sequencing Analysis
RNA isolated from esophageal biopsies or differentiated EPC2s was subjected to RNA sequencing at the Gene Discovery and Genetic Variation Core at CCHMC.7 The paired-end sequencing reads were aligned against the GRCh37 genome model using TopHat 2.04 with Bowtie 2.03.36,37 The separate alignments were then merged using Cuffmerge with RefSeq gene models as a reference. The aligned reads were quantified for differential expression analysis using Cuffdiff.38 Normalization and statistical analysis was performed using GeneSpring (Agilent Technologies).
qPCR analysis
Total RNA (500 ng) was DNAase treated, and complementary DNA was generated using the iScript complementary DNA synthesis kit (Bio-Rad Laboratories, Hercules, CA). qPCR was performed with the Applied Biosystems Incorporated 7900HT Fast Real-Time System (Life Technologies, Grand Island, NY) and LightCycler FastStart DNA Master SYBR Green as a ready-to-use reaction mix with ROX (Roche, Basel, Switzerland). Relative expression was calculated using a standard curve method, as described.39,40 Results were normalized to GAPDH and fold induction compared with controls. cDNAs were amplified using TaqMan Gene Expression Assay (Hs00226845_m1) and primers (Integrated DNA Technologies, Coralville, IA) (Supplementary Table 1).41
Western blot analysis
Total cell lysates were prepared from biopsy protein following Qiazol (QIAGEN) RNA extraction. Briefly, protein pellets were resuspended in Laemmli buffer, incubated at 37°C for 30 minutes, vortexed briefly, and heated to 95°C for 5 minutes before electrophoresis. Cells were lysed using MPER lysis buffer (Sigma-Aldrich, St. Louis, MO) supplemented with protease inhibitors (Roche) and sodium orthovanadate (10 mM) (Sigma-Aldrich). Loading buffer (Life Technologies) was added and samples were heated to 95°C for 5 minutes, subjected to electrophoresis on 4-12% NuPAGE Bis-Tris gels (Life Technologies), transferred to nitrocellulose membranes (Life Technologies), and visualized using the Odyssey CLx system (LI-COR Biosciences, Lincoln, NE) with IRDye 800RD goat anti-rabbit (LI-COR) and IRDye 680RD goat anti-mouse (LI-COR Biosciences) secondary antibodies. Primary antibodies were: anti-LRRC31 (ab100379; Abcam PLC, Cambridge, UK) and anti-HSP90 (AF7247; R&D Systems, Minneapolis, MN). Blots were quantified using Image Studio (LI-COR).
Primary cell culture
Distal esophageal biopsy specimens from patients with EoE were collected and subsequently digested with trypsin, cultured in modified F-media (3:1 F-12/Dulbecco Modified Eagle’s medium) supplemented with FBS (5%), adenine (24.2 mg/mL), cholera toxin (1024 mM), insulin (5 mg/mL), hydrocortisone (0.4 mg/mL), and epidermal growth factor (10ng/mL) in the presence of penicillin, streptomycin, and amphotericin (Life Technologies).9 Cells were cultured for 2 weeks, and fibroblasts were depleted by means of differential trypsinization.
EPC2 cell culture
The esophageal epithelial cell line (human telomerase reverse transcriptase-immortalized EPC2 cell line) was a kind gift from Dr. Anil Rustgi (University of Pennsylvania, Philadelphia, PA).42-44 EPC2s were cultured in Keratinocyte Serum-Free media (Life Technologies) supplemented with bovine pituitary extract, epidermal growth factor, and amphotericin (Life Technologies). For differentiated EPC2 cell cultures, EPC2s were grown to confluence for 2 days while being fully submerged in low-calcium ([Ca2+] = 0.09 mM) supplemented Keratinocyte Serum-Free media on 0.4 μm pore-size permeable supports (Corning Incorporated, Corning, NY). Confluent monolayers were then switched to high-calcium ([Ca2+] = 1.8 mM) media for an additional 5 days. The culture medium was removed from the inner chamber of the permeable support in order to expose the cell monolayer to the air interface at day 7. Differentiated EPC2s were analyzed 7 days after ALI induction.
Lentiviral transduction
EPC2s were transduced with virus containing FLAG epitope-tagged LRRC31 coding sequence or empty vector control using the pMIRNA1 lentiviral system (SystemBiosciences, Mountain View, CA). EPC2s were transduced with shRNA targeting the coding sequence of LRRC31 or a NSC shRNA using the GIPZ lentiviral system (Thermo Fisher Scientific, Waltham, MA). Lentiviral particles were prepared at the CCHMC Viral Vector Core. Twenty-four hours after transduction, EPC2s were selected for stable integration using puromycin (1 μg/mL) for 48 hours. Transduction efficiency was assessed by GFP fluorescence and overexpression or silencing efficiency was assessed by qPCR compared to empty vector control transduced cells.
TER and paracellular flux assays
For differentiated EPC2s, TER and 3-5 kD FITC-Dextran (Sigma-Aldrich) paracellular flux were measured at day 7 after ALI induction as previously described using an EVOM (World Precision Instruments, Sarasota, FL) and a fluorescence plate reader (BioTek, Winooski, VT), respectively.45
Protease array and KLK activity assay
Supernatants from differentiated EPC2s were collected and total protein was quantified using the BCA assay (Life Technologies). The Proteome Profiler Human Protease Array Kit (R&D Systems) was used to quantify protease expression, which was quantified using Image Studio Software (LI-COR) and normalized to total protein. For the KLK activity assay, equal protein (1μg) was mixed with Boc-V-P-R-AMC Fluorogenic Peptide Substrate (R&D Systems) and reaction buffer, and the plate containing the reactions was incubated overnight at 37°C. The plate was read with excitation at 380 nm and emission at 460 nm using a fluorescence plate reader (BioTek).
Luciferase activity assay
The 2 kb upstream gene promoter for LRRC31 was cloned into the pGL3-basic construct and co-transfected with pRL-TK into TE-7 cells, which were treated with IL-13 (100 ng/ml) for 48 hours. Luciferase activity was determined using the Dual-Luciferase Reporter Assay System (Promega, Madison, WI) as per manufacturer instructions.
Histological analyses
Cross-sectional area of H&E stained sections was calculated using thresholding image processing with ImageJ (US National Institutes of Health, Bethesda, MD).
Statistical analyses
Statistical significance was determined using a t-test and ANOVA test. Pearson correlation was used to test for correlated gene expression. All statistical analyses were performed using GraphPad Prism (GraphPad Software Incorporated, La Jolla, CA).
Study approvals
For human subjects, written informed consent was obtained before a patient’s enrollment in the studies, and all human studies were approved by the CCHMC Institutional Review Board (IRB protocol 2008-0090). All experiments involving mice were approved by the CCHMC IACUC.
Supplementary Material
Supplemental Figure 1 ∣ LRRC31 expression in esophageal epithelial cells. a, Fold change in normalized LRRC31 and CCL26 mRNA expression in bronchial epithelial cells treated with IL-4 (10 ng/mL) for 18 hours determined by microarray gene expression analysis.17 b, Normalized LRRC31 and CCL26 mRNA expression in tracheal epithelial cells treated with IL-13 (50 ng/mL) for 23 days determined by microarray gene expression analysis.18 c, Normalized LRRC31 and CCL26 mRNA expression in Caco2-bbe colonic epithelial cells treated with IL-13 (100 ng/mL) for 48 hours determined by microarray gene expression analysis. d, Normalized LRRC31 and CCL26 mRNA expression in esophageal epithelial cells treated with IL-13 (100 ng/mL) for 48 hours determined by microarray gene expression analysis. For a-d, data are represented as the mean ± SEM; *P < 0.05, ***P < 0.001, ****P < 0.0001.
Supplemental Figure 2 ∣ IL-13–STAT6 effect on LRRC31 gene promoter activity. a, Identification of putative STAT6 binding sites within the 2 kb 5′ upstream region of the LRRC31 transcription start site (TSS) from publicly available ChIP-Seq data.19 b, Normalized luciferase activity in empty vector control, LRRC31 gene promoter (LRRC31), and CCL26 gene promoter (CCL26) transfected TE-7 esophageal epithelial cells treated with IL-13 (100 ng/ml) for 48 hours. A representative experiment is shown (n = 3). For b, data are represented as the mean ± SEM; NS, not significant; *P < 0.05, ***P < 0.001.
Supplementary Figure 3 ∣ LRRC31 gene-silenced EPC2s. Additional images of H&E-stained sections from differentiated NSC and LRRC31 shRNA EPC2s at day 14.
Supplemental Figure 4 ∣ Paracellular flux measurements in LRRC31 gene silenced, differentiated EPC2 cells. FITC-dextran (3-5 kD) paracellular flux measured at 3 hours after FITC-dextran was added to luminal surface of differentiated NSC and LRR31 shRNA EPC2s at day 14. A representative experiment is shown (n = 3). Data are represented as the mean ± SEM; NS, not significant.
Supplementary Figure 5 ∣ LRRC31 structure. a, Representation of LRRC31 protein amino acid primary sequence with 9 exons indicated and putative domains (LRR, leucine-rich repeat; NES, nuclear export signal; NLS, nuclear localization signal).25,26 b, Images representing predicted tertiary structure of LRRC31 generated using I-TASSER Online Protein Structure and Function Predictions.27
Supplementary Figure 6 ∣ LRRC31 homology and phylogeny. a, Analysis of LRRC31 amino acid similarity to pBLAST-predicted homologous human proteins using Jukes Cantor modeling.28 b, Analysis of LRRC31 amino acid similarity to eggNOG-predicted orthologous proteins using Jukes Cantor modeling.33
Supplementary Table 1
Acknowledgments
This work was supported in part by NIH U19 AI070235, NIH R01 DK076893, the PHS Grant P30 DK0789392, the Food Allergy Research & Education, the Buckeye Foundation, and the Campaign Urging Research for Eosinophilic Diseases (CURED) Foundation. We thank Dr. Anil Rustgi (University of Pennsylvania) for the EPC2-human telomerase reverse transcriptase cell line. We also thank Shawna Hottinger for editorial assistance, all of the participating families and the Cincinnati Center for Eosinophilic Disorders, and members of the Division of Allergy and Immunology.
ABBREVIATIONS
- AD
Atopic dermatitis
- ALI
Air-liquid interface
- CE
Chronic esophagitis
- EoE
Eosinophilic esophagitis
- FP
Fluticasone propionate
- GERD
Gastroesophageal reflux disease
- hpf
High-power field (400X)
- IBF
Impaired barrier function
- LRR
Leucine-rich repeat
- NL
Normal controls
- NR
Non-responders
- R
Responders
- shRNA
Short hairpin RNA
- SC
Stratum corneum
- SG
Stratum germinativum
- TER
Transepithelial electrical resistance
Footnotes
Authorship
RJD, NPA, SPH, and MER were involved in study concept and design. RJD, JMC, TW, JDS were involved in data acquisition. RJD and MER analyzed and interpreted data. RJD, JMC, SPH, and MER were involved in the writing and critical revision of the manuscript.
Conflicts of interest: MER has an equity interest in reslizumab (Teva Pharmaceuticals); is a consultant and has an equity interest in Receptos, Celsius Therapeutics, NKT Therapeutics, and Immune Pharmaceuticals; and is the inventor of several eosinophilic esophagitis–related patents owned by Cincinnati Children’s Hospital Medial Center. SPH is a consultant for Immune Pharmaceuticals. TW is the inventor of several eosinophilic esophagitis–related patents owned by Cincinnati Children’s Hospital Medial Center. The remaining authors declare no conflict of interest.
References
- 1.Liacouras CA, et al. Eosinophilic esophagitis: updated consensus recommendations for children and adults. The Journal of allergy and clinical immunology. 2011;128:3–20. e26. doi: 10.1016/j.jaci.2011.02.040. quiz 21-22, doi:10.1016/j.jaci.2011.02.040. [DOI] [PubMed] [Google Scholar]
- 2.Rothenberg ME, et al. Common variants at 5q22 associate with pediatric eosinophilic esophagitis. Nature genetics. 2010;42:289–291. doi: 10.1038/ng.547. doi:10.1038/ng.547. [DOI] [PMC free article] [PubMed] [Google Scholar]
- 3.Blanchard C, et al. Coordinate interaction between IL-13 and epithelial differentiation cluster genes in eosinophilic esophagitis. Journal of immunology. 2010;184:4033–4041. doi: 10.4049/jimmunol.0903069. doi:10.4049/jimmunol.0903069. [DOI] [PMC free article] [PubMed] [Google Scholar]
- 4.Sherrill JD, Rothenberg ME. Genetic dissection of eosinophilic esophagitis provides insight into disease pathogenesis and treatment strategies. The Journal of allergy and clinical immunology. 2011;128:23–32. doi: 10.1016/j.jaci.2011.03.046. quiz 33-24, doi:10.1016/j.jaci.2011.03.046. [DOI] [PMC free article] [PubMed] [Google Scholar]
- 5.Kottyan LC, et al. Genome-wide association analysis of eosinophilic esophagitis provides insight into the tissue specificity of this allergic disease. Nature genetics. 2014;46:895–900. doi: 10.1038/ng.3033. doi:10.1038/ng.3033. [DOI] [PMC free article] [PubMed] [Google Scholar]
- 6.Orlando RC. The integrity of the esophageal mucosa. Balance between offensive and defensive mechanisms. Best Pract Res Clin Gastroenterol. 2010;24:873–882. doi: 10.1016/j.bpg.2010.08.008. doi:10.1016/j.bpg.2010.08.008. [DOI] [PMC free article] [PubMed] [Google Scholar]
- 7.Sherrill JD, et al. Desmoglein-1 regulates esophageal epithelial barrier function and immune responses in eosinophilic esophagitis. Mucosal immunology. 2014;7:718–729. doi: 10.1038/mi.2013.90. doi:10.1038/mi.2013.90. [DOI] [PMC free article] [PubMed] [Google Scholar]
- 8.Straumann A, Bauer M, Fischer B, Blaser K, Simon HU. Idiopathic eosinophilic esophagitis is associated with a T(H)2-type allergic inflammatory response. The Journal of allergy and clinical immunology. 2001;108:954–961. doi: 10.1067/mai.2001.119917. doi:10.1067/mai.2001.119917. [DOI] [PubMed] [Google Scholar]
- 9.Blanchard C, et al. IL-13 involvement in eosinophilic esophagitis: transcriptome analysis and reversibility with glucocorticoids. The Journal of allergy and clinical immunology. 2007;120:1292–1300. doi: 10.1016/j.jaci.2007.10.024. doi:10.1016/j.jaci.2007.10.024. [DOI] [PubMed] [Google Scholar]
- 10.Sherrill JD, et al. Analysis and expansion of the eosinophilic esophagitis transcriptome by RNA sequencing. Genes and immunity. 2014;15:361–369. doi: 10.1038/gene.2014.27. doi:10.1038/gene.2014.27. [DOI] [PMC free article] [PubMed] [Google Scholar]
- 11.Blanchard C, et al. Eotaxin-3 and a uniquely conserved gene-expression profile in eosinophilic esophagitis. The Journal of clinical investigation. 2006;116:536–547. doi: 10.1172/JCI26679. doi:10.1172/JCI26679. [DOI] [PMC free article] [PubMed] [Google Scholar]
- 12.Cork MJ, et al. Epidermal barrier dysfunction in atopic dermatitis. The Journal of investigative dermatology. 2009;129:1892–1908. doi: 10.1038/jid.2009.133. doi:10.1038/jid.2009.133. [DOI] [PubMed] [Google Scholar]
- 13.Prassas I, Eissa A, Poda G, Diamandis EP. Unleashing the therapeutic potential of human kallikrein-related serine proteases. Nat Rev Drug Discov. 2015;14:183–202. doi: 10.1038/nrd4534. doi:10.1038/nrd4534. [DOI] [PubMed] [Google Scholar]
- 14.Su AI, et al. A gene atlas of the mouse and human protein-encoding transcriptomes. Proceedings of the National Academy of Sciences of the United States of America. 2004;101:6062–6067. doi: 10.1073/pnas.0400782101. doi:10.1073/pnas.0400782101. [DOI] [PMC free article] [PubMed] [Google Scholar]
- 15.Wu C, et al. BioGPS: an extensible and customizable portal for querying and organizing gene annotation resources. Genome biology. 2009;10:R130. doi: 10.1186/gb-2009-10-11-r130. doi:10.1186/gb-2009-10-11-r130. [DOI] [PMC free article] [PubMed] [Google Scholar]
- 16.Sanderson CJ. Interleukin-5, eosinophils, and disease. Blood. 1992;79:3101–3109. [PubMed] [Google Scholar]
- 17.Shum BO, et al. The adipocyte fatty acid-binding protein aP2 is required in allergic airway inflammation. The Journal of clinical investigation. 2006;116:2183–2192. doi: 10.1172/JCI24767. doi:10.1172/JCI24767. [DOI] [PMC free article] [PubMed] [Google Scholar]
- 18.Alevy YG, et al. IL-13-induced airway mucus production is attenuated by MAPK13 inhibition. The Journal of clinical investigation. 2012;122:4555–4568. doi: 10.1172/JCI64896. doi:10.1172/JCI64896. [DOI] [PMC free article] [PubMed] [Google Scholar]
- 19.Weirauch MT, et al. Determination and inference of eukaryotic transcription factor sequence specificity. Cell. 2014;158:1431–1443. doi: 10.1016/j.cell.2014.08.009. doi:10.1016/j.cell.2014.08.009. [DOI] [PMC free article] [PubMed] [Google Scholar]
- 20.Jiang M, et al. BMP-driven NRF2 activation in esophageal basal cell differentiation and eosinophilic esophagitis. The Journal of clinical investigation. 2015 doi: 10.1172/JCI78850. doi:10.1172/JCI78850. [DOI] [PMC free article] [PubMed] [Google Scholar]
- 21.Huang da W, Sherman BT, Lempicki RA. Systematic and integrative analysis of large gene lists using DAVID bioinformatics resources. Nature protocols. 2009;4:44–57. doi: 10.1038/nprot.2008.211. doi:10.1038/nprot.2008.211. [DOI] [PubMed] [Google Scholar]
- 22.Huang da W, Sherman BT, Lempicki RA. Bioinformatics enrichment tools: paths toward the comprehensive functional analysis of large gene lists. Nucleic acids research. 2009;37:1–13. doi: 10.1093/nar/gkn923. doi:10.1093/nar/gkn923. [DOI] [PMC free article] [PubMed] [Google Scholar]
- 23.Potti TA, Petty EM, Lesperance MM. A comprehensive review of reported heritable noggin-associated syndromes and proposed clinical utility of one broadly inclusive diagnostic term: NOG-related-symphalangism spectrum disorder (NOG-SSD) Human mutation. 2011;32:877–886. doi: 10.1002/humu.21515. doi:10.1002/humu.21515. [DOI] [PubMed] [Google Scholar]
- 24.Miners JS, Renfrew R, Swirski M, Love S. Accumulation of alpha-synuclein in dementia with Lewy bodies is associated with decline in the alpha-synuclein-degrading enzymes kallikrein-6 and calpain-1. Acta neuropathologica communications. 2014;2:164. doi: 10.1186/s40478-014-0164-0. doi:10.1186/s40478-014-0164-0. [DOI] [PMC free article] [PubMed] [Google Scholar]
- 25.Ota T, et al. Complete sequencing and characterization of 21,243 full-length human cDNAs. Nature genetics. 2004;36:40–45. doi: 10.1038/ng1285. doi:10.1038/ng1285. [DOI] [PubMed] [Google Scholar]
- 26.la Cour T, et al. Analysis and prediction of leucine-rich nuclear export signals. Protein engineering, design & selection : PEDS. 2004;17:527–536. doi: 10.1093/protein/gzh062. doi:10.1093/protein/gzh062. [DOI] [PubMed] [Google Scholar]
- 27.Kosugi S, Hasebe M, Tomita M, Yanagawa H. Systematic identification of cell cycle-dependent yeast nucleocytoplasmic shuttling proteins by prediction of composite motifs. Proceedings of the National Academy of Sciences of the United States of America. 2009;106:10171–10176. doi: 10.1073/pnas.0900604106. doi:10.1073/pnas.0900604106. [DOI] [PMC free article] [PubMed] [Google Scholar]
- 28.Zhang Y. I-TASSER server for protein 3D structure prediction. BMC bioinformatics. 2008;9:40. doi: 10.1186/1471-2105-9-40. doi:10.1186/1471-2105-9-40. [DOI] [PMC free article] [PubMed] [Google Scholar]
- 29.States DJ, Gish W. Combined use of sequence similarity and codon bias for coding region identification. Journal of computational biology : a journal of computational molecular cell biology. 1994;1:39–50. doi: 10.1089/cmb.1994.1.39. [DOI] [PubMed] [Google Scholar]
- 30.Dickson KA, Haigis MC, Raines RT. Ribonuclease inhibitor: structure and function. Progress in nucleic acid research and molecular biology. 2005;80:349–374. doi: 10.1016/S0079-6603(05)80009-1. doi:10.1016/S0079-6603(05)80009-1. [DOI] [PMC free article] [PubMed] [Google Scholar]
- 31.Wilmanski JM, Petnicki-Ocwieja T, Kobayashi KS. NLR proteins: integral members of innate immunity and mediators of inflammatory diseases. Journal of leukocyte biology. 2008;83:13–30. doi: 10.1189/jlb.0607402. doi:10.1189/jlb.0607402. [DOI] [PMC free article] [PubMed] [Google Scholar]
- 32.McClure R, Massari P. TLR-Dependent Human Mucosal Epithelial Cell Responses to Microbial Pathogens. Frontiers in immunology. 2014;5:386. doi: 10.3389/fimmu.2014.00386. doi:10.3389/fimmu.2014.00386. [DOI] [PMC free article] [PubMed] [Google Scholar]
- 33.Wang T, et al. Flightless I homolog negatively modulates the TLR pathway. Journal of immunology. 2006;176:1355–1362. doi: 10.4049/jimmunol.176.3.1355. [DOI] [PubMed] [Google Scholar]
- 34.Powell S, et al. eggNOG v4.0: nested orthology inference across 3686 organisms. Nucleic acids research. 2014;42:D231–239. doi: 10.1093/nar/gkt1253. doi:10.1093/nar/gkt1253. [DOI] [PMC free article] [PubMed] [Google Scholar]
- 35.Zimmermann N, et al. Dissection of experimental asthma with DNA microarray analysis identifies arginase in asthma pathogenesis. The Journal of clinical investigation. 2003;111:1863–1874. doi: 10.1172/JCI17912. doi:10.1172/JCI17912. [DOI] [PMC free article] [PubMed] [Google Scholar]
- 36.Langmead B, Trapnell C, Pop M, Salzberg SL. Ultrafast and memory-efficient alignment of short DNA sequences to the human genome. Genome biology. 2009;10:R25. doi: 10.1186/gb-2009-10-3-r25. doi:10.1186/gb-2009-10-3-r25. [DOI] [PMC free article] [PubMed] [Google Scholar]
- 37.Trapnell C, et al. Differential analysis of gene regulation at transcript resolution with RNA-seq. Nature biotechnology. 2013;31:46–53. doi: 10.1038/nbt.2450. doi:10.1038/nbt.2450. [DOI] [PMC free article] [PubMed] [Google Scholar]
- 38.Garber M, Grabherr MG, Guttman M, Trapnell C. Computational methods for transcriptome annotation and quantification using RNA-seq. Nature methods. 2011;8:469–477. doi: 10.1038/nmeth.1613. doi:10.1038/nmeth.1613. [DOI] [PubMed] [Google Scholar]
- 39.Pfaffl MW. A new mathematical model for relative quantification in real-time RT-PCR. Nucleic acids research. 2001;29:e45. doi: 10.1093/nar/29.9.e45. [DOI] [PMC free article] [PubMed] [Google Scholar]
- 40.Zuo L, et al. IL-13 induces esophageal remodeling and gene expression by an eosinophil-independent, IL-13R alpha 2-inhibited pathway. Journal of immunology. 2010;185:660–669. doi: 10.4049/jimmunol.1000471. doi:10.4049/jimmunol.1000471. [DOI] [PMC free article] [PubMed] [Google Scholar]
- 41.Wen T, et al. Molecular diagnosis of eosinophilic esophagitis by gene expression profiling. Gastroenterology. 2013;145:1289–1299. doi: 10.1053/j.gastro.2013.08.046. doi:10.1053/j.gastro.2013.08.046. [DOI] [PMC free article] [PubMed] [Google Scholar]
- 42.Andl CD, et al. Epidermal growth factor receptor mediates increased cell proliferation, migration, and aggregation in esophageal keratinocytes in vitro and in vivo. The Journal of biological chemistry. 2003;278:1824–1830. doi: 10.1074/jbc.M209148200. doi:10.1074/jbc.M209148200. [DOI] [PubMed] [Google Scholar]
- 43.Harada H, et al. Telomerase induces immortalization of human esophageal keratinocytes without p16INK4a inactivation. Molecular cancer research : MCR. 2003;1:729–738. [PubMed] [Google Scholar]
- 44.Oyama K, et al. AKT induces senescence in primary esophageal epithelial cells but is permissive for differentiation as revealed in organotypic culture. Oncogene. 2007;26:2353–2364. doi: 10.1038/sj.onc.1210025. doi:10.1038/sj.onc.1210025. [DOI] [PMC free article] [PubMed] [Google Scholar]
- 45.Wu D, et al. Interleukin-13 (IL-13)/IL-13 receptor alpha1 (IL-13Ralpha1) signaling regulates intestinal epithelial cystic fibrosis transmembrane conductance regulator channel-dependent Cl− secretion. The Journal of biological chemistry. 2011;286:13357–13369. doi: 10.1074/jbc.M110.214965. doi:10.1074/jbc.M110.214965. [DOI] [PMC free article] [PubMed] [Google Scholar]
Associated Data
This section collects any data citations, data availability statements, or supplementary materials included in this article.
Supplementary Materials
Supplemental Figure 1 ∣ LRRC31 expression in esophageal epithelial cells. a, Fold change in normalized LRRC31 and CCL26 mRNA expression in bronchial epithelial cells treated with IL-4 (10 ng/mL) for 18 hours determined by microarray gene expression analysis.17 b, Normalized LRRC31 and CCL26 mRNA expression in tracheal epithelial cells treated with IL-13 (50 ng/mL) for 23 days determined by microarray gene expression analysis.18 c, Normalized LRRC31 and CCL26 mRNA expression in Caco2-bbe colonic epithelial cells treated with IL-13 (100 ng/mL) for 48 hours determined by microarray gene expression analysis. d, Normalized LRRC31 and CCL26 mRNA expression in esophageal epithelial cells treated with IL-13 (100 ng/mL) for 48 hours determined by microarray gene expression analysis. For a-d, data are represented as the mean ± SEM; *P < 0.05, ***P < 0.001, ****P < 0.0001.
Supplemental Figure 2 ∣ IL-13–STAT6 effect on LRRC31 gene promoter activity. a, Identification of putative STAT6 binding sites within the 2 kb 5′ upstream region of the LRRC31 transcription start site (TSS) from publicly available ChIP-Seq data.19 b, Normalized luciferase activity in empty vector control, LRRC31 gene promoter (LRRC31), and CCL26 gene promoter (CCL26) transfected TE-7 esophageal epithelial cells treated with IL-13 (100 ng/ml) for 48 hours. A representative experiment is shown (n = 3). For b, data are represented as the mean ± SEM; NS, not significant; *P < 0.05, ***P < 0.001.
Supplementary Figure 3 ∣ LRRC31 gene-silenced EPC2s. Additional images of H&E-stained sections from differentiated NSC and LRRC31 shRNA EPC2s at day 14.
Supplemental Figure 4 ∣ Paracellular flux measurements in LRRC31 gene silenced, differentiated EPC2 cells. FITC-dextran (3-5 kD) paracellular flux measured at 3 hours after FITC-dextran was added to luminal surface of differentiated NSC and LRR31 shRNA EPC2s at day 14. A representative experiment is shown (n = 3). Data are represented as the mean ± SEM; NS, not significant.
Supplementary Figure 5 ∣ LRRC31 structure. a, Representation of LRRC31 protein amino acid primary sequence with 9 exons indicated and putative domains (LRR, leucine-rich repeat; NES, nuclear export signal; NLS, nuclear localization signal).25,26 b, Images representing predicted tertiary structure of LRRC31 generated using I-TASSER Online Protein Structure and Function Predictions.27
Supplementary Figure 6 ∣ LRRC31 homology and phylogeny. a, Analysis of LRRC31 amino acid similarity to pBLAST-predicted homologous human proteins using Jukes Cantor modeling.28 b, Analysis of LRRC31 amino acid similarity to eggNOG-predicted orthologous proteins using Jukes Cantor modeling.33
Supplementary Table 1


