Abstract
This paper presents a portable paper-based microfluidic platform for multiplexed electrochemical detection of antibody markers of human immunodeficiency virus (HIV) and hepatitis C virus (HCV) in serum samples. To our best knowledge, this is the first paper-based electrochemical immunosensing platform, with multiplexing and telemedicine capabilities, for diagnosing HIV/HCV co-infection. The platform consists of an electrochemical microfluidic paper-based immunosensor array (E-μPIA) and a handheld multi-channel potentiostat, and is capable of performing enzyme-linked immunosorbent assays simultaneously on eight samples within 20 min (using a prepared E-μPIA). The multiplexing feature of the platform allows it to produce multiple measurement data for HIV and HCV markers from a single run, and its wireless communication module can transmit the results to a remote site for telemedicine. The unique integration of paper-based microfluidics and mobile instrumentation renders our platform portable, low-cost, user-friendly, and high-throughput.
I. INTRODUCTION
Human immunodeficiency virus (HIV) and hepatitis C virus (HCV) infections have been among the leading causes of morbidity and mortality worldwide in recently years. Due to their common routes of transmission, co-infection of HIV and HCV exists in an estimated one-third of HIV positive patients,1–4 which is a severe health problem in the world, especially in developing countries. Infection with HIV, when present in either HCV transmitting or HCV exposed patients, can cause an increase on the risk of transmission of HCV;5 apart from that, when exposed to HCV, HIV-infected patients are less likely to clear the acute infection.5,6
Point-of-care (POC) tests for sexually transmitted infections (STIs) are commercially available, but not often affordable or accessible to many patients in the developing world, where the burden of STIs is the greatest. Besides the affordability issue, the existing POC tests are usually designed to indicate a binary status (positive or negative) and cannot accurately quantify concentrations of the disease markers in a sample, which has a great meaning in determination of the infection stage. Thus, low-cost, quantitative POC tests with satisfactory performance are of urgent need for STI diagnosis.
Microfluidic paper-based analytical devices (μPADs), as an emerging tool for low-cost diagnostics, have recently gained significant research interests.7–9 Traditional μPADs methods are based on optical detection principles, such as colorimetric reaction10–12 and fluorescence assay,13 which rely on cameras, microscopes, and other optical instruments to translate the color information for assay quantification. Compared with optical μPADs, electrochemical μPADs (E-μPADs) are built on the mechanisms of electron transferring during redox reactions, which usually provide higher sensitivity, lower limit of detection, and more diverse sensing capabilities for developing POC tests.14–17 With advancement of portable electrochemical instrumentation, the integration of E-μPADs with portable, low-cost electrochemical readers (i.e., potentiostat) makes it possible for paper-based tests to be carried out remotely at the POC and/or in the field with enhanced analytical performance.18–20
Aiming at POC diagnosis of HIV/HCV co-infection, we develop a paper-based, integrated diagnostic platform capable of multiplexed electrochemical enzyme-linked immunosorbent assays (ELISAs) of HIV/HCV antibody markers and remote transmission of diagnostic results for telemedicine. There exists E-μPADs for carrying out ELISAs of cancer and tumor markers.21,22 However, to our best knowledge, no paper-based platform is reported previously for diagnosis of the HIV/HCV co-infection. The platform integrates an electrochemical microfluidic paper-based immunosensor array (E-μPIA) and a custom-made, handheld potentiostat; it can carry out ELISAs on eight serum samples in parallel, generate assay results in 20 min, and transmit the data to a host computer or smart phone via wireless transmission. Based on the developed platform, we optimize the ELISA protocol and improve the assay sensitivity via surface biofunctionalization of sensing electrodes. We demonstrate accurate quantification of antibodies against HIV p24 core antigen and HCV core antigen in mouse serum with limits of detection (LOD) of 300 pg/ml and 750 pg/ml, respectively. We also show negligible cross-reactivity of the HIV and HCV assays, proving the feasibility of diagnosing HIV/HCV co-infection in protein-rich serum samples.
II. EXPERIMENTAL DESIGN
A. Design and fabrication of the E-μPIA
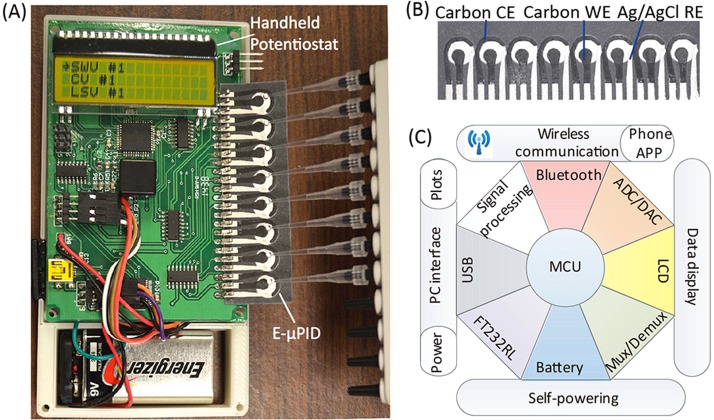
Fig. 1(a) shows the internal structure of the custom-made potentiostat with an E-μPIA inserted in its electrical connection slot. Fig. 1(b) shows the E-μPIA that has eight electrochemical immunosensors for detecting HIV and HCV antibodies (four immunosensors for each marker). Each immunosensor consists of a circular paper reaction zone and a group of three screen-printed electrodes (working electrode—WE, counter electrode—CE, and reference electrode—RE). The center spacing of adjacent reaction zones is 9 mm, which is compatible with the tip spacing of a standard multi-channel pipette and thus allows a user to add samples to the eight immunosensors simultaneously (Fig. 1(a)). The WE and the CE were made from carbon ink, and the RE was made from Ag/AgCl ink. The Ag/AgCl RE provides stable reference potential during electrochemical measurement and is widely used in screen-printed electrochemical cells.23–25 The RE is placed close to the WE and the CE to reduce the uncompensated resistance of the electrochemical cell between the WE and the RE.16,26 To fabricate an E-μPIA, we first patterned the eight reaction zones on a piece of cellulose chromatography paper (Whatman® CHR #1, GE Healthcare) via wax printing and then formed the electrodes on top of the reaction zones via stencil printing. Details of the device fabrication process can be found in a previous report.20
FIG. 1.
A portable paper-based diagnostic platform integrating an E-μPIA and a handheld potentiostat. (a) The handheld potentiostat inserted with an E-μPIA. (b) The E-μPIA. (c) Schematic architecture of the potentiostat circuit constructed based on a microcontroller unit (MCU).
B. Design of the potentiostat
To improve the throughput of HIV and HCV detection, we designed a handheld, eight-channel potentiostat for signal readout from the E-μPIA. Fig. 1(a) shows the printed circuit board (PCB) of the potentiostat. The circuit architecture of the potentiostat is illustrated in Fig. 1(c), which primarily includes a microcontroller unit (MCU; ATxmega32A4, Atmel) with a 12-bit analog-to-digital converter (ADC) and a 12-bit digital-to-analog converter (DAC), a signal multiplexing/demultiplexing unit (74HC4051D, NXP Semiconductors), a signal processing circuit (for converting an electrochemical current into a voltage), a liquid crystal display (LCD; EADOGM163EA, Electronic Assembly), a universal serial bus (USB) to universal asynchronous receiver/transmitter (UART) interface circuit (FT232RL, FTDI), a Bluetooth wireless communication unit, and a 9 V battery. The total material cost of the potentiostat is CAD $60 (calculated based on prices in small quantities). Through user programming, the potentiostat can perform different types of electrochemical measurements on the E-μPIA, including cyclic voltammetry (CV), linear sweeping voltammetry (LSV), chronoamperometry (CA), and square wave voltammetry (SWV).
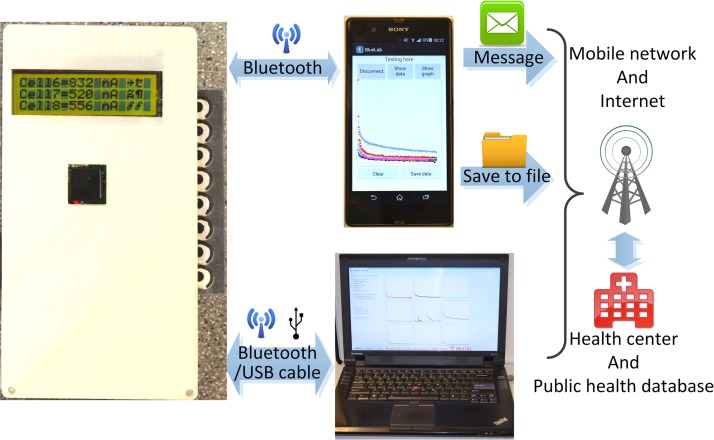
The basic design and working principle of the multiplexing potentiostat has been reported previously.20 In this work, we constructed an updated version of our previous potentiostat design and integrated a few additional features useful for POC diagnosis, including on-board battery, Bluetooth communication, and custom-made personal computer (PC) software and smart-phone Android application—APP (for data receiving and processing). Fig. 2 illustrates the wireless communication architecture of our diagnostic platform, from the handheld potentiostat, to a PC or a smart phone, and finally to a remote cite. The PC software and smart-phone APP both can open the Bluetooth port of the potentiostat, trigger the electrochemical measurement, and receive data via wireless communication. The assay data can also be transmitted from the potentiostat to a PC through the USB interface. The data can be further transmitted to a remote site (e.g., centralized hospital/laboratory or public health database) via the internet (by a PC or a smart phone) or the mobile network (by a smart phone), for tele-diagnosis or healthcare data collection.
FIG. 2.
Wireless data transmission of the diagnostic platform, from the potentiostat, to a PC or a smart phone, and finally to a remote site. The screens of the PC and the smart phone display the graphical user interfaces of the PC software and the Android APP, respectively.
C. Biofunctionalization of the reaction zone and the WE
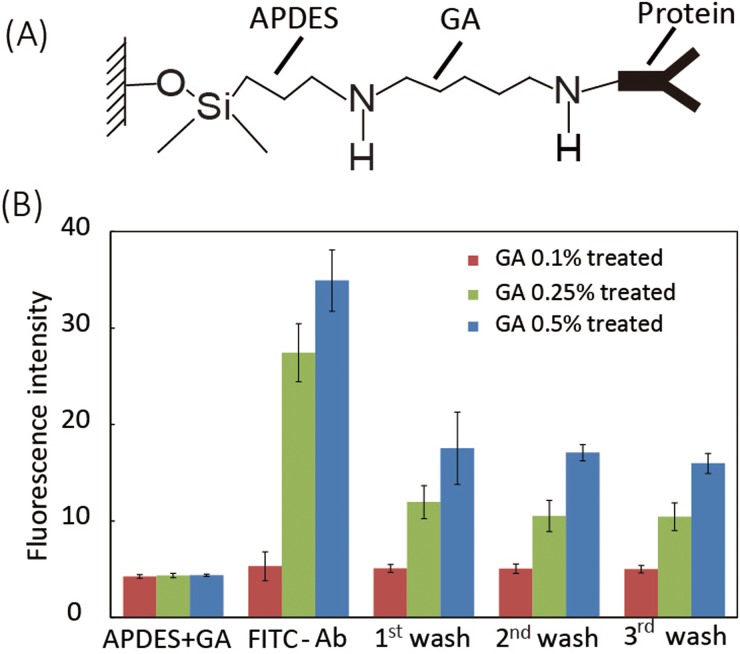
After 4–8 weeks of exposure to the HIV virus, a human body will produce a detectable level of antibodies due to the immune response against HIV.27 Tests detecting the presence of serum antibody against the HIV p24 core antigen have been commonly used for clinical HIV diagnosis.28 For HCV diagnosis, the antibody against HCV core antigen is a commonly used marker and provides accurate test results.29 We used indirect ELISA to quantify concentrations of HIV and HCV antibodies in serum samples, which is based on the sequential affinity bindings of the viral antigen, viral antibody, and secondary antibody. To capture the target antibodies in serum, the viral antigens need to be first immobilized on the WE and the reaction zones. We modified the paper reaction zone and the WE with 3-amino-propyldimethylethoxysilane (APDES) and glutaraldehyde (GA). APDES treatment improves the hydrophilicity of the carbon WE and the paper reaction zone,17,30 and the APDES molecule also bonds with the hydroxyl (-OH) groups on the surfaces of paper and WE, and thus provide amine (-NH2) groups for subsequent GA bonding (Fig. 3(a)). The GA, as an effective protein crosslinking reagent, was added onto the reaction zone to bond with -NH2 groups from APDES, providing aldehyde (CHO-) groups for protein immobilization (Fig. 3(a)).
FIG. 3.
Biofunctionalization process of the WE. (a) Molecular scheme of surface protein functionalization on the surfaces of the WE through APDES and GA linkages. (b) Fluorescence quantification of immobilized FITC-anti-IgG on WEs treated with GA at different concentrations (n = 3).
We first treated the working electrode with 2 μl of 2% (v/v) APDES for three times and waited for 10 min after each treatment. 2% of APDES is high enough to make the carbon WE more hydrophobic, but does not obviously attack the wax barrier of the reaction zone (we observed that treating the electrodes with >2% APDES made the wax barrier of the zone less hydrophobic and thus unable to confine fluids effectively). We then added 2 μl of GA onto the WE and waited for 30 min. We explored the effect of GA concentration on the protein immobilization efficiency. We found that GA solution at ≥0.5% became relatively viscous and made the reaction zone hydrophobic after treatment. Thus, we used 2 μl of GA at three different concentrations—0.1%, 0.25%, and 0.5% (v/v)—to treat the working electrode and investigated the hydrophilicity and protein immobilization efficiency of the electrode after the GA treatment. To quantify the protein immobilization efficiency, we applied 4 μl of 20 μg/ml Fluorescein isothiocyanate (FITC)-labelled IgG antibody (FITC-anti-IgG) to each WE, waited for 3 min, washed it with 30 μl of phosphate buffered saline (PBS) for three times, and finally quantified the fluorescence intensity of the zone.
Fig. 3(b) shows the fluorescence intensities of the working electrodes right after APDES and GA treatments (“APDES + GA”), after the addition of FITC-anti-IgG (“FITC-Ab”), and after three repeated washes (“1st wash” to “3rd wash”). We found that the treatment with 0.1% GA did not obviously decrease the hydrophilicity of the reaction zone and the WE; however, the electrodes treated with 0.1% GA only captured a limited amount of FITC-anti-IgG after three washes (fluorescence intensity increases by 24.9%). When treated with 0.25% GA, the reaction zone and the WE became less hydrophilic but still wicked fluids efficiently, and their protein immobilization efficiency increased significantly (fluorescence intensity increased by 140% after 3 washes). When the GA concentration was further increased to 0.5%, an even larger amount of FITC-anti-IgG was captured by the WE (fluorescence intensity increased by 300% after 3 washes). However, the WE and reaction zone treated with 0.5% GA became more hydrophobic, and thus did not allow fluids wick through the reaction zone effectively for carrying out the assay. Therefore, 0.25% GA was chosen in the finalized biofunctionalization protocol. One can also observe that, after protein immobilization on WE (treated with 0.25% GA), excess unbound FITC-anti-IgG can be efficiently washed off via three washes.
D. Protocol of electrochemical ELISA
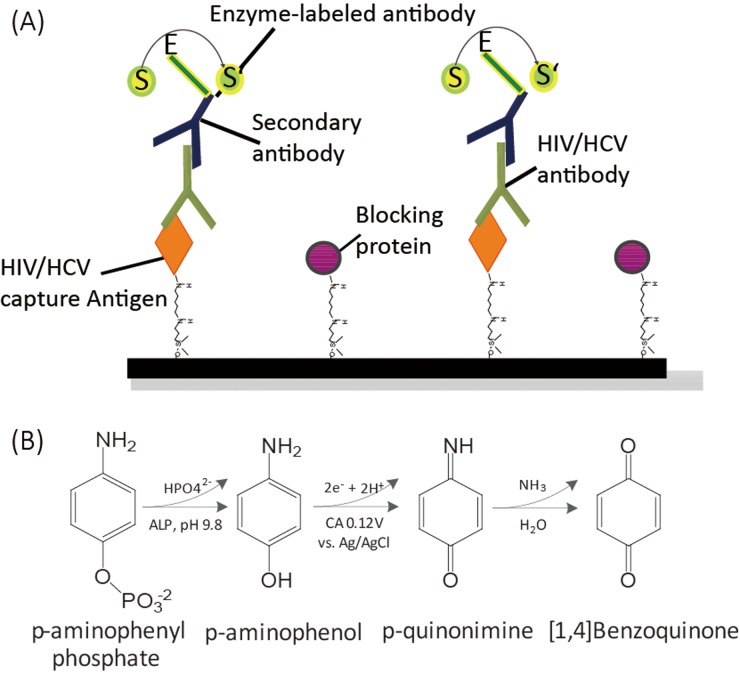
We employed indirect ELISAs (Fig. 4(a)) for detection of both HIV and HCV antibodies. To start a test, we first added 3 μl of 50 μg/ml viral core antigen (HIV p24 or HCV core antigen) to the APDES-GA-treated reaction zones of an E-μPIA (four zones for HIV tests and four zones for HCV tests) and incubated the device at ambient conditions for 10 min. We then spotted 6 μl of blocking buffer (Roche Blocking Reagent, cat. no.: 13906900) to the reaction zones and allowed them to dry at ambient conditions for 25 min (to prevent non-specific absorptions). After that, we added 3 μl of commercial mouse serum, spiked with different concentrations of HIV or HCV antibody, and waited for 3 min, during which the HIV or HCV antibody in the serum conjugated, as the primary antibody of the indirect ELISA, with the immobilized HIV or HCV antigen. We washed the reaction zone with 20 μl of 1× PBS for three times to remove the unbound species of the serum. We next added 4 μl of 40 μg/ml alkaline phosphatase (ALP) labeled goat anti-mouse IgG to the reaction zone, which served as the secondary antibody and bound with the primary HIV or HCV antibody. After 3-min incubation, we washed the reaction zone with 20 μl of 1 × PBS for three times. At this point, the amount of ALP bound to the reaction zone surface is proportional to the amount of HIV or HCV antibody bound to the same surface. Finally, we added 6 μl of an electrochemical substrate for ALP, p-aminophenyl phosphate or pAPP (5 mg/ml), to the reaction zone, which was catalyzed by the ALP and produced an amperometric current output during electrochemical measurement. After 3-min incubation, we performed CA measurement to quantify the produced current signal. The entire ELISA process took 55 min, including a 35-min device preparation time for immobilizing the capture antigens and blocking the void sites on the substrate. Thus, with a prepared E-μPIA, a user can complete the assay of eight samples in 20 min.
FIG. 4.
Protocol of indirect electrochemical ELISA. (a) Scheme of the indirect ELISA for detecting HIV/HCV antibodies. (b) Electrochemical reaction mechanism of pAPP and ALP-antibody.
Fig. 4(b) shows the reaction mechanism of pAPP and the ALP-labelled anti-mouse IgG (ALP-antibody). pAPP was first catalyzed by ALP to p-aminophenol (pAP), and the generated pAP was then oxidized by an electrochemical potential applied between the WE and the CE and produced two free electrons per molecule. The amperometric current was finally measured as the output signal of the indirect ELISA, which is proportional to the concentration of HIV or HCV antibody in the serum sample.
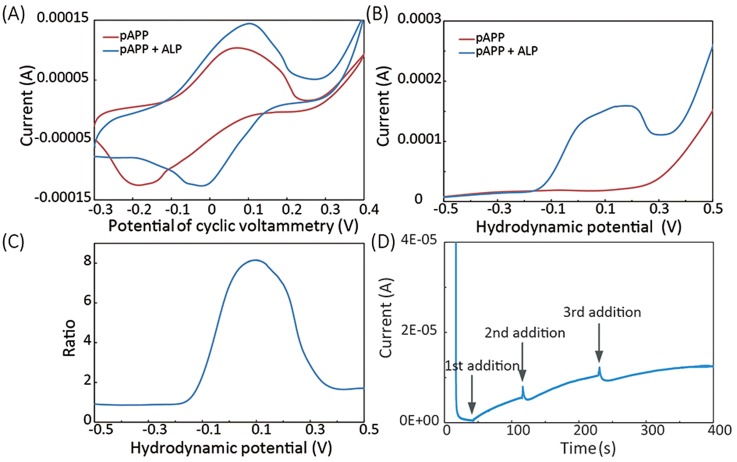
To characterize the electrochemical reaction of the pAPP and the ALP, we first performed CV on immunosensors added with a 4 μl mixture of 40 μg/ml ALP-antibody and 6 μl of 5 mg/ml pAPP (“pAPP + ALP” in Fig. 5(a)) or a 6 μl drop of 5 mg/ml pAPP alone (“pAPP” in Fig. 5(a)). The CV measurements were performed in a voltage range of −0.3 V to 0.4 V with a scan rate of 100 mV/s. The cyclic voltammograms, as shown Fig. 5(a), reveal that, compared to the solution of ALP-antibody plus pAPP, the solution of pAPP alone requires higher potential for oxidation and reduction and has a larger potential gap between the oxidation and reduction peaks. Since pAPP can be oxidized by high potentials without ALP-antibody, we should choose a lower potential for assay signal readout.
FIG. 5.
Electrochemical characterization of the reaction of pAPP and ALP-labelled anti-mouse IgG (ALP-antibody). (a) Cyclic voltammetry on solutions of pAPP plus ALP-antibody (“pAPP + ALP”) and pAPP along (“pAPP”). (b) Results of hydrodynamic linear sweeping on the solutions of “pAPP + ALP” and “ALP.” (c) The signal-to-background current ratio extracted from the hydrodynamic sweeping results. (d) Chronoamperometry measurement results on the solution of “pAPP” with ALP-antibody added subsequently. The CA potential of 0.12 V was used.
We employed CA to trigger the oxidation of the pAP (catalyzed from pAPP), and the CA technique has less interference with other species and thus offers higher accuracy and sensitivity than other electrochemical techniques. We optimized the CA step potential via hydrodynamic linear sweeping. With the solutions of “pAPP + ALP-antibody” and “pAPP” (with the same concentrations as the ones used in the CV measurement in Fig. 5(a)), we scanned their hydrodynamic potentials in the range of ±0.5 V at a rate of 100 mV/s. As shown in Fig. 5(b), the resultant current measured during the hydrodynamic potential scanning on the solution of “ALP + pAPP” presents an oxidation peak at ∼0.1 V, while the current measured from the solution of “pAPP” has no obvious oxidation peak.
Defining the ratio of the currents measured from the solutions of “ALP + pAPP” and “pAPP” as the signal-to-background-noise ratio, and one can find that the potential of 0.12 V yields the highest signal-to-background-noise ratio (Fig. 5(c)). Thus, the potential of 0.12 V was selected for CV measurements of the final assays. At the potential of 0.12 V, we also performed CA measurement on the solution of 6 μl of 5 mg/ml pAPP and added 4 μl of 40 μg/ml ALP-antibody consecutively, while the current signal was recorded. As shown in Fig. 5(d), the solution of pAPP gave a very low current before the first addition of ALP-antibody; the addition of ALP-antibody caused an instant current increase, and the current then reached to a steady state before the next addition.
III. RESULTS
A. Electrochemical characterization of the E-μPIA
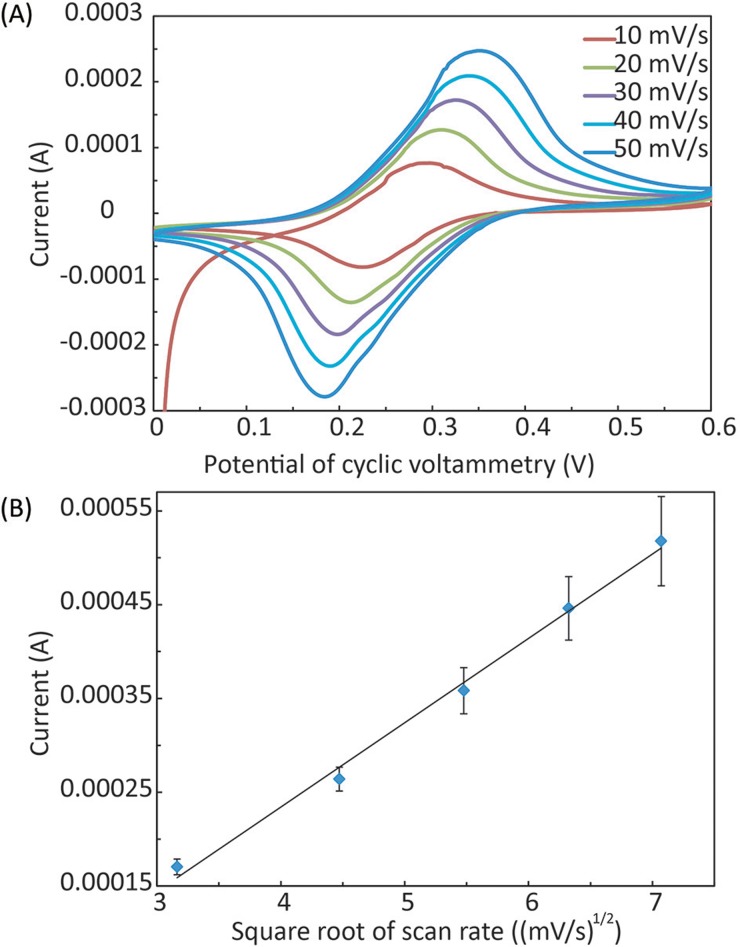
We characterized the electrochemical performance of the E-μPIA (after the APDES and GA treatment) via CV in the solution of 10 mM potassium ferricyanide (K3[Fe(CN)6]) and 1 M potassium chloride (KCl). We scanned 5 immunosensors within the range of 0–0.6 V at a rate of 10–50 mV/s. Fig. 6(a) shows typical cyclic voltammograms measured at different scan rates, and the magnitudes of anode peak currents (Ipa) and cathode peak current (Ipc) are approximately identical. The results of the current peak magnitude as a function of the square root of the scan rate also show a typical linear relationship (Fig. 6(b)). These results reveal that each immunosensor is a reversible electrochemical system.
FIG. 6.
Electrochemical characterization of the E-μPIA. (a) Cyclic voltammetry (CV) of individual immunosensors at the scanning rate from 10 mV/s to 50 mV/s. (B) Calibration results of the peak current magnitude vs. the square root of the scan rate (n = 5).
B. Detection of HIV/HCV antibodies in serum
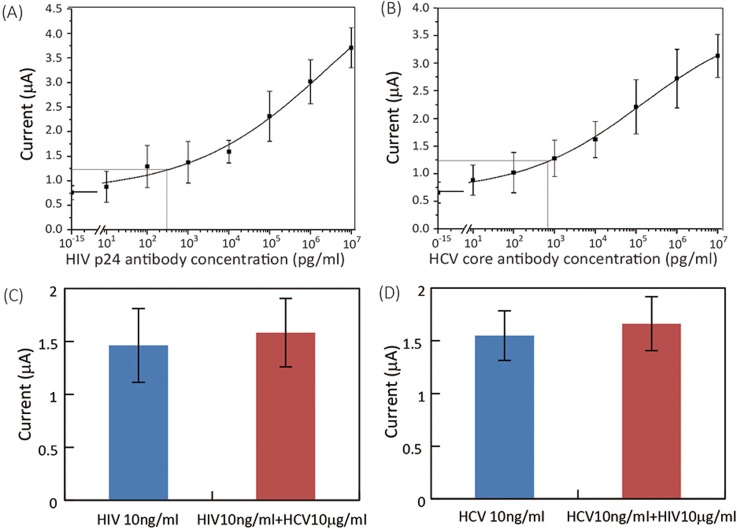
Using spiked mouse serum, we calibrated the E-μPIA and obtained typical S-shaped calibration curves for both HIV and HCV antibodies (Figs. 7(a) and 7(b)). The LODs for detecting HIV and HCV antibodies were determined to be 300 pg/ml and 750 pg/ml, respectively. These LODs are lower than that of existing tests for HIV antibody (1 ng/ml; Ref. 31) and HCV core antibody (5 ng/ml; Ref. 32).
FIG. 7.
Experimental results of device calibration and cross-reactivity testing for HIV/HCV antibody detections. (a) and (b) Calibration curves of (a) HIV and (b) HCV antibody detections (n = 8). (c) Output signals (n = 5) of HIV detection on serum samples with 10 ng/ml HIV antibody only (“HIV 10 ng/ml”) and with 10 ng/ml HIV antibody and 10 μg/ml interference HCV antibody (“HIV 10 ng/ml + HCV 10 μg/ml”). (d) Output signals (n = 5) of HCV detection on serum samples with 10 ng/ml HCV antibody only (“HCV 10 ng/ml”) and with 10 ng/ml HCV antibody and 10 μg/ml interference HIV antibody (“HCV 10 ng/ml + HIV 10 μg/ml”).
We also investigated the potential cross-reactivity of HIV and HCV antibody detections in the same sample by adding high-concentration interference analyte to serum samples with low-concentration target analyte. We added 10 μg/ml HCV antibody (interference analyte) to serum samples spiked with 10 ng/ml HIV antibody (target analyte) and vice versa, and compared the current outputs from serum samples with and without interference antibodies.
Figs. 7(c) and 7(d) show the current outputs of assays performed on: (i) serum samples with only target antibody (“HIV 10 ng/ml” in Fig. 7(c) and “HCV 10 ng/ml” in Fig. 7(d)); and (ii) serum samples with both target antibody and interference antibody (“HIV 10 ng/ml + HCV 10 μg/ml” in Fig. 7(c) and “HCV 10 ng/ml + HIV 10 μg/ml” in Fig. 7(d)). The current outputs from both types of serum samples have similar values, and not significant difference was found between data groups in Figs. 7(c) and 7(d). These results prove that the interference between HIV and HCV antibody assays is negligible, and that our diagnostic platform has a great potential for practical diagnosis of HIV/HCV co-infection.
IV. DISCUSSION
Laboratory ELISA tests for HIV and HCV have been widely used in medical practices, which help more and more people identify their HIV/HCV status, monitor their disease trends, and improve clinical outcomes. Nevertheless, low-cost, rapid POC tests for diagnosis of HIV/HCV co-infection are highly demanded for use in the developing countries, where the most basic health care facilities are still not readily accessible. The diagnostic platform presented in this work is the first integrated, paper-based electrochemical platform for low-cost diagnosis of HIV/HCV co-infection. The developed E-μPIA includes eight electrochemical immunosensors capable of carrying out ELISAs in parallel and testing multiple serum samples for both HIV and HCV antibody markers. The electrochemical ELISA is highly accurate and sensitive, and provides lower LODs to existing HIV and HCV antibody tests. The platform allows a user to perform ELISA tests of eight serum samples within 20 min. The handheld multiplexing potentiostat makes the entire platform portable and therefore significantly improves its adaptability to POC uses. Given the wide applicability of electrochemical detection to many types of molecules, this platform can be readily extended to the detection of other protein markers, metabolites, ions, and nucleic acids.
This work was focused on the design and demonstration of the paper-based microfluidic platform for diagnosis of HIV/HCV co-infection. To make the platform ready for practical uses, we still need to investigate the stability of the E-μPIA over long-term storage. There have been many studies in the literature on improving the antigen/antibody storage stability on paper substrates.33–35 Based on the previous results, we plan to improve the device stability by controlling the storage environment humidity and adding protein stabilizers to the E-μPIA. We will also work on the clinical testing of this platform using patient samples, and the further extension of the platform's diagnostic functionalities by targeting other protein markers.
V. CONCLUSIONS
We have successfully developed an integrated, paper-based diagnostic platform, with multiplexing and telemedicine capabilities, for detection of HIV/HCV co-infection. Indirect ELISAs of antibodies to HIV p24 and HCV core antigens were realized on an E-μPIA, and a handheld potentiostat with a Bluetooth module was developed for readout of output signals from the device. The electrochemical characterization of individual immunosensor revealed reversible electrochemical behavior. Using this platform, we demonstrated the detection of HIV and HCV antibodies in mouse serum at LODs of 300 pg/ml and 750 pg/ml, respectively. We also investigated the cross-reactivity of the HIV and HCV assays in serum samples and showed negligible interference effect between the HIV and HCV tests.
ACKNOWLEDGMENTS
This work was supported by a Star in Global Health Award from Grand Challenge Canada (0046-01-04-01-01), the Natural Sciences and Engineering Research Council of Canada—NSERC (RGPIN 418553-12), the Canada Foundation for Innovation (CFI-LOF 30316), and the McGill University (232201). We also acknowledge the financial support from the Canada Research Chairs Program (to X.L.; 237293) and the NSERC CREATE Training Program in Integrated Sensor Systems (to C.Z.).
References
- 1. Rider P. J. and Liu F., BMC Med. 10(1), 32 (2012). 10.1186/1741-7015-10-32 [DOI] [PMC free article] [PubMed] [Google Scholar]
- 2. Operskalski E. A. and Kovacs A., Curr. HIV/AIDS Rep. 8(1), 12–22 (2011). 10.1007/s11904-010-0071-3 [DOI] [PMC free article] [PubMed] [Google Scholar]
- 3. Alatrakchi N. and Koziel M. J., Lancet 362(9397), 1687–1688 (2003). 10.1016/S0140-6736(03)14881-7 [DOI] [PubMed] [Google Scholar]
- 4. Chen S. L. and Morgan T. R., Int. J. Med. Sci. 3(2), 47 (2006). 10.7150/ijms.3.47 [DOI] [PMC free article] [PubMed] [Google Scholar]
- 5. Rotman Y. and Liang T. J., J. Virol. 83(15), 7366–7374 (2009). 10.1128/JVI.00191-09 [DOI] [PMC free article] [PubMed] [Google Scholar]
- 6. Thomas D. L., Astemborski J., Rai R. M., Anania F. A., Schaeffer M., Galai N., Nolt K., Nelson K. E., Strathdee S. A., and Johnson L., JAMA 284(4), 450–456 (2000). 10.1001/jama.284.4.450 [DOI] [PubMed] [Google Scholar]
- 7. Martinez A. W., Phillips S. T., Whitesides G. M., and Carrilho E., Anal. Chem. 82(1), 3–10 (2009). 10.1021/ac9013989 [DOI] [PubMed] [Google Scholar]
- 8. Yetisen A. K., Akram M. S., and Lowe C. R., Lab Chip 13(12), 2210–2251 (2013). 10.1039/c3lc50169h [DOI] [PubMed] [Google Scholar]
- 9. Li X., Ballerini D. R., and Shen W., Biomicrofluidics 6(1), 011301 (2012). 10.1063/1.3687398 [DOI] [PMC free article] [PubMed] [Google Scholar]
- 10. Katis I. N., Holloway J. A., Madsen J., Faust S. N., Garbis S. D., Smith P. J., Voegeli D., Bader D. L., Eason R. W., and Sones C. L., Biomicrofluidics 8(3), 036502 (2014). 10.1063/1.4878696 [DOI] [PMC free article] [PubMed] [Google Scholar]
- 11. Cai L., Xu C., Lin S., Luo J., Wu M., and Yang F., Biomicrofluidics 8(5), 056504 (2014). 10.1063/1.4898096 [DOI] [PMC free article] [PubMed] [Google Scholar]
- 12. Weng C.-H., Chen M.-Y., Shen C.-H., and Yang R.-J., Biomicrofluidics 8(6), 066502 (2014). 10.1063/1.4902246 [DOI] [PMC free article] [PubMed] [Google Scholar]
- 13. Koo Y., Sankar J., and Yun Y., Biomicrofluidics 8(5), 054104 (2014). 10.1063/1.4894784 [DOI] [PMC free article] [PubMed] [Google Scholar]
- 14. Maxwell E. J., Mazzeo A. D., and Whitesides G. M., MRS Bull. 38(04), 309–314 (2013). 10.1557/mrs.2013.56 [DOI] [Google Scholar]
- 15. Ge S., Ge L., Yan M., Song X., Yu J., and Huang J., Chem. Commun. 48(75), 9397–9399 (2012). 10.1039/c2cc34887j [DOI] [PubMed] [Google Scholar]
- 16. Dungchai W., Chailapakul O., and Henry C. S., Anal. Chem. 81(14), 5821–5826 (2009). 10.1021/ac9007573 [DOI] [PubMed] [Google Scholar]
- 17. Nie Z., Nijhuis C. A., Gong J., Chen X., Kumachev A., Martinez A. W., Narovlyansky M., and Whitesides G. M., Lab Chip 10(4), 477–483 (2010). 10.1039/B917150A [DOI] [PMC free article] [PubMed] [Google Scholar]
- 18. Nemiroski A., Christodouleas D. C., Hennek J. W., Kumar A. A., Maxwell E. J., Fernández-Abedul M. T., and Whitesides G. M., Proc. Natl. Acad. Sci. 111(33), 11984–11989 (2014). 10.1073/pnas.1405679111 [DOI] [PMC free article] [PubMed] [Google Scholar]
- 19. Nie Z., Deiss F., Liu X., Akbulut O., and Whitesides G. M., Lab Chip 10(22), 3163–3169 (2010). 10.1039/c0lc00237b [DOI] [PMC free article] [PubMed] [Google Scholar]
- 20. Zhao C., Thuo M. M., and Liu X., Sci. Technol. Adv. Mater. 14(5), 054402 (2013). 10.1088/1468-6996/14/5/054402 [DOI] [PMC free article] [PubMed] [Google Scholar]
- 21. Zang D., Ge L., Yan M., Song X., and Yu J., Chem. Commun. 48(39), 4683–4685 (2012). 10.1039/c2cc16958d [DOI] [PubMed] [Google Scholar]
- 22. Wu Y., Xue P., Hui K. M., and Kang Y., ChemElectroChem 1(4), 722–727 (2014). 10.1002/celc.201300194 [DOI] [Google Scholar]
- 23. Li X., Zhao C., and Liu X., Microsyst. Nanoeng. 1, 15014 (2015). 10.1038/micronano.2015.14 [DOI] [Google Scholar]
- 24. Adkins J. A. and Henry C. S., Anal. Chim. Acta 891, 247–254 (2015). 10.1016/j.aca.2015.07.019 [DOI] [PubMed] [Google Scholar]
- 25. Dossi N., Toniolo R., Terzi F., Impellizzieri F., and Bontempelli G., Electrochim. Acta 146, 518–524 (2014). 10.1016/j.electacta.2014.09.049 [DOI] [Google Scholar]
- 26. Oldham K., J. Electroanal. Chem. (1959) 11(3), 171–187 (1966). 10.1016/0022-0728(66)80080-3 [DOI] [Google Scholar]
- 27. Hellerstein M., Hanley M., Cesar D., Siler S., Papageorgopoulos C., Wieder E., Schmidt D., Hoh R., Neese R., and Macallan D., Nat. Med. 5(1), 83–89 (1999). 10.1038/4772 [DOI] [PubMed] [Google Scholar]
- 28. Pandori M. W., Hackett J., Louie B., Vallari A., Dowling T., Liska S., and Klausner J. D., J. Clin. Microbiol. 47(8), 2639–2642 (2009). 10.1128/JCM.00119-09 [DOI] [PMC free article] [PubMed] [Google Scholar]
- 29. Alter M. J., Kuhnert W. L., and Finelli L., Guidelines for Laboratory Testing and Result Reporting of Antibody to Hepatitis C Virus ( Massachusetts Medical Society, 2003). [PubMed] [Google Scholar]
- 30. Li X., Nie Z., Cheng C., Goodale A., and Whitesides G. “ Paper-based electrochemical ELISA,” presented at the 14th International Conference on Miniaturized Systems for Chemistry and Life Sciences, Groningen, The Netherlands, 2010, pp. 1487–1489.
- 31. Bhimji A., Zaragoza A. A., Live L. S., and Kelley S. O., Anal. Chem. 85(14), 6813–6819 (2013). 10.1021/ac4009429 [DOI] [PubMed] [Google Scholar]
- 32. Moradpour D., Wakita T., Tokushige K., Carlson R. I., Krawczynski K., and Wands J. R., J. Med. Virol. 48(3), 234–241 (1996). [DOI] [PubMed] [Google Scholar]
- 33. Wu G., Srivastava J., and Zaman M. H., Anal. Biochem. 449, 147–154 (2014). 10.1016/j.ab.2013.12.012 [DOI] [PubMed] [Google Scholar]
- 34. Wang J., Yiu B., Obermeyer J., Filipe C. D., Brennan J. D., and Pelton R., Biomacromolecules 13(2), 559–564 (2012). 10.1021/bm2017405 [DOI] [PubMed] [Google Scholar]
- 35. Ferraz A. S., Belo E. F., Coutinho L. M., Oliveira A. P., Carmo A. M., Franco D. L., Ferreira T., Yto A. Y., Machado M. S., and Scola M. C., BMC Infect. Dis. 8(1), 30 (2008). 10.1186/1471-2334-8-30 [DOI] [PMC free article] [PubMed] [Google Scholar]


