

Abstract
Background
Sarcopenia is known to be related to an increased risk of chemotherapy toxicity and to a poor prognosis in patients with malignancy. We assessed the prognostic role of sarcopenia in patients with diffuse large B‐cell lymphoma (DLBCL).
Methods
In total, 187 consecutive patients with DLBCL treated with induction rituximab, cyclophosphamide, doxorubicin, vincristine, and prednisolone (R‐CHOP) immunochemotherapy were reviewed. Sarcopenia was defined as the lowest sex‐specific quartile of the skeletal muscle index, calculated by dividing the pectoralis muscle area by the height. Clinical outcomes were compared between the sarcopenic and non‐sarcopenic groups. A nomogram was constructed from the Cox regression model for overall survival (OS).
Results
Treatment‐related mortality (21.7 vs. 5.0%, P = 0.002) and early discontinuation of treatment (32.6 vs. 14.9%, P = 0.008) were more common in the sarcopenic group than in the non‐sarcopenic group. The 5 year progression‐free survival (PFS) rates were 35.3% in the sarcopenic group and 65.8% in the non‐sarcopenic group (P < 0.001). The 5 year OS rates were 37.3% in the sarcopenic group and 68.1% in the non‐sarcopenic group (P < 0.001). Sarcopenia and the five variables of the International Prognostic Index (IPI) were independent prognostic factors in a multivariate analysis for PFS and OS and were used to construct the nomogram. The calibration plot showed good agreement between the nomogram predictions and actual observations. The c index of the nomogram (0.80) was higher than those of other prognostic indices (IPI, 0.77, P = 0.009; revised‐IPI, 0.74, P < 0.001; National Comprehensive Cancer Network‐IPI, 0.77, P = 0.062).
Conclusions
Sarcopenia is associated with intolerance to standard R‐CHOP chemotherapy as well as a poor prognosis. Moreover, sarcopenia itself can be included in prognostic models in DLBCL.
Keywords: Sarcopenia, Diffuse large B‐cell lymphoma, Toxicity, Prognosis, Nomogram
Sarcopenia, defined as the loss of skeletal muscle mass and strength,1 is one of the criteria for cancer cachexia.2 A computed tomography (CT) scan has been accepted as one of the most preferred tools to assess sarcopenia.2 Measuring the extent of sarcopenia by CT in patients with malignancy has several advantages, including accurate quantification of muscle mass, precise differentiation between fat and muscle, and wide availability as a routine diagnostic tool in cancer.3, 4 Sarcopenia evaluated by CT is known to be related to an increased risk of chemotherapy toxicity,5, 6 poorer functional status,7 and reduced survival8, 9, 10 in malignancy.
Non‐Hodgkin's lymphoma (NHL) is the ninth most common neoplasm in Korea, and diffuse large B‐cell lymphoma (DLBCL) is the most common NHL in adults.11, 12 The International Prognostic Index (IPI), consisting of age, serum lactate dehydrogenase (LDH), Eastern Cooperative Oncology Group (ECOG) performance status (PS), Ann Arbor stage, and sites of involvement, have been used for risk stratification of patients with DLBCL.13 Because the addition of rituximab (R) to the ‘conventional’ cyclophosphamide, doxorubicin, vincristine, and prednisone (CHOP) regimen resulted in a dramatic improvement in survival in all age groups of patients with DLBCL,14, 15, 16, 17 the IPI does not identify a risk group with a less than 50% chance of survival.18, 19 New prognostic scoring systems, such as the revised IPI (R‐IPI)18 and an enhanced IPI using the National Comprehensive Cancer Network database (NCCN‐IPI),19 have been introduced and show a better capacity to predict the prognosis of patients with DLBCL than the conventional IPI. These two prognostic indices do not include any other clinical factor beyond those used in the conventional IPI.
Recently, it was reported that sarcopenia is an independent prognostic factor in patients with DLBCL. Lanic et al. first showed that the 2 year overall survival (OS) rate was significantly lower in a sarcopenic group than in a non‐sarcopenic group in a study of 82 elderly patients with DLBCL.20 In that study, a score incorporating sarcopenia and hypoalbuminaemia was more prognostic than either factor alone.20 Additionally, the authors suggested that a composite score, including adipopenia and sarcopenia, the so‐called cachexia score, can also be useful to predict outcomes in elderly patients with DLBCL, independent of body mass index (BMI) and the IPI.21 These two previous studies, however, included small numbers of patients and excluded younger patients. Moreover, the scoring systems suggested in these studies are difficult to apply clinically, because well‐known prognostic factors were not included at all in these scoring systems.
In this study, we investigated the prognostic value of sarcopenia in all age groups of patients with DLBCL using an extended cohort. Additionally, a new prognostic model, including sarcopenia and other significant prognostic factors, was constructed using a nomogram.
Methods
Patients
We retrospectively reviewed all consecutive patients histologically confirmed with DLBCL and treated with induction R‐CHOP immunochemotherapy between June 2003 and February 2015 at Gyeongsang National University Hospital (GNUH). Of these patients, those for whom a pre‐treatment CT scan of the chest was available were screened in the study. The following patients were excluded: (i) aged younger than 18 years, (ii) received induction therapy other than standard R‐CHOP‐21 immunochemotherapy, (iii) Richter's transformation from chronic lymphocytic leukaemia, and (iv) cases with missing values in any one of the baseline characteristics. This study was approved by the Institutional Review Board of GNUH.
Muscle mass measurement
CT examinations were performed using a 64‐detector CT (Brilliance‐64; Philips Medical Systems, The Netherlands). CT was performed with a detector configuration of 64 × 0.625 mm, a tube voltage of 120 kVp, a fixed tube current of 200 mAs, a pitch of 0.923, a gantry rotation time of 0.5 s, and a smooth reconstruction (Philips ‘B’) filter. The patient, in the arm‐raised position, was asked to hold his breath at full inspiration. The whole lung parenchyma, from the lung apex to the diaphragm, was scanned in the craniocaudal direction. Iohexol (80 mL; Omnipaque 350, GE Healthcare, Waukesha, WI, USA) was delivered at a rate of 2.5 mL/s. Bolus tracking was performed in the aortic arch with an attenuation threshold of 150 Hounsfield unit (HU). A minimal scan delay of 7 s was applied for each scan.
The mass of the pectoralis muscle, including the pectoralis major and the pectoralis minor, was measured by one radiologist with 7 years of experience. The measurement method was as follows. Reconstructed axial images with a 3 mm slice thickness and 3 mm interval were analysed at the level of the fourth thoracic vertebra using CT histogram software (the ‘X section’ analysis tool, Advantage Window 4.4; GE Healthcare). Second, the region of interest was placed as the outermost border of muscles using freehand manual drawing. Third, the area of these muscles, which ranged from −29 to 100 HU, was calculated using CT histogram analysis. Then, the mass of the muscles was calculated as the cross‐sectional area. Fourth, the bilateral masses of the muscles were measured separately, and both values were averaged. The muscle mass area was divided by height, and this value was reported as the T4 skeletal muscle index (T4 SMI, cm2/m2).
Clinical data collection and definitions
Clinical data were collected by reviewing electronic medical records. Patients in the sex‐specific lowest quartile of T4 SMI were considered to be the sarcopenic group, and the rest were the non‐sarcopenic group. The IPI, R‐IPI, and NCCN‐IPI were calculated in all patients and compared between the sarcopenic and non‐sarcopenic groups. Elevated LDH was defined as serum LDH > 225 IU/L and hypoalbuminaemia as serum albumin < 3.5 g/dL. Treatment response was assessed in available cases according to the revised International Working Group response criteria.22 Treatment toxicity was assessed according to the National Cancer Institute Common Toxicity Criteria (ver. 4.0). Treatment‐related mortality (TRM) was defined as death from any cause other than disease progression within 30 days of the last cycle of R‐CHOP immunochemotherapy or death caused directly by treatment at any time. Treatment completion was defined when a minimum of six cycles of R‐CHOP for localized or advanced disease and three to four cycles of R‐CHOP plus involved field radiotherapy for localized disease were performed. BMI was calculated from measured weight and height at pre‐treatment as kg/m2. Underweight was defined as BMI < 18.5 kg/m2. 23
Statistical analysis
A value of P < 0.05 was considered to indicate statistical significance. Comparisons between the two groups were performed using the χ2 or Fisher's exact test for categorical variables and the Mann–Whitney U‐test for continuous data. Correlations among continuous variables were tested using the Pearson correlation coefficient. Progression‐free survival (PFS) was defined as the time from the start of treatment to first progression, death from any cause, or last follow‐up. OS was defined as the time from the start of treatment to death from any cause or last follow‐up. Kaplan–Meier curves for PFS and OS were plotted and compared using the log‐rank test. Cox regression analysis was performed to identify independent prognostic factors. The proportional hazard assumption was satisfied for all variables tested by examining plots of the log minus log survival function. Potentially significant variables (P < 0.10) in univariate analyses were included in a multivariate analysis, and a backward elimination method with the Akaike information criterion (AIC) as a stopping rule24 was used to construct the final model. Then, a nomogram to predict the 3 and 5 year OS rates was developed from the final model to visualize the prognostic value of each risk factor. The predictive accuracy of the nomogram was evaluated by discrimination and calibration. Discrimination was measured via the concordance index (c index) with its respective confidence interval (CI), which quantifies the level of concordance between predicted probabilities and the actual chance of having the event of interest.25 A c index of 0.5 indicates that outcomes are completely random, whereas a c index of 1 indicates that the model is a perfect predictor. To reduce overfit bias, the bias‐corrected c index of the nomogram was calculated using 200 bootstrap samples. The nomogram and other prognostic indices were compared with the −2 log likelihood (−2LL) and the AIC in terms of goodness of fit, as well as by using the c index. Calibration was assessed by reviewing the plot of predicted probabilities from the nomogram vs. the actual probabilities, again using 200 bootstrap samples.25 The nomogram and its calibration plot were produced using the ‘R’ software (ver. 3.1.3; R Foundation for Statistical Computing, Vienna, Austria). All other statistical analyses were performed using the SPSS software (ver. 21.0; SPSS Inc., Chicago, IL, USA).
Results
Patient characteristics
In total, 187 patients were included according to the eligibility criteria. In this cohort, T4 SMI was weakly but significantly associated with BMI (r = 0.203, P = 0.005; Figure S1). The first quartile values of T4 SMI were 440 cm2/m2 (range: 219–967 cm2/m2) in male patients and 310 cm2/m2 (range: 189–630 cm2/m2) in female patients. In total, 46 patients with a value of T4 SMI less than the first quartile were classified as the sarcopenic group, with the remaining 141 patients classified as the non‐sarcopenic group. A comparison of patient characteristics between the two groups is shown in Table 1. The median age was higher in the sarcopenic group (66.5 years) than in the non‐sarcopenic group (60 years; P = 0.014). The proportions of patients with B symptoms (34.8 vs. 17.0%, P = 0.011) and hypoalbuminaemia (58.7 vs. 24.1%, P < 0.001) were also higher in the sarcopenic group than in the non‐sarcopenic group. In addition, the sarcopenic group had significantly more advanced IPI (P = 0.012), R‐IPI (P = 0.015), and NCCN‐IPI (P = 0.038) than did the non‐sarcopenic group.
Table 1.
Patients' characteristics
| Factor | Sarcopenic (n = 46) | Non‐sarcopenic (n = 141) | P |
|---|---|---|---|
| Age, years | 0.014 | ||
| Median | 66.5 | 60 | |
| Range | 24–89 | 17–86 | |
| Sex | 0.876 | ||
| Male | 28 (60.9) | 84 (59.6) | |
| Female | 18 (39.1) | 57 (40.4) | |
| ECOG PS | 0.071 | ||
| 0–1 | 29 (63.0) | 108 (76.6) | |
| 2–3 | 17 (37.0) | 33 (23.4) | |
| B‐symptoms | 0.011 | ||
| Absent | 30 (65.2) | 117 (83.0) | |
| Present | 16 (34.8) | 24 (17.0) | |
| Bulky disease | 0.158 | ||
| Non‐bulky | 35 (76.1) | 120 (85.1) | |
| Bulky | 11 (23.9) | 21 (14.9) | |
| Ann Arbor stage | 0.183 | ||
| I–II | 17 (37.0) | 68 (48.2) | |
| III–IV | 29 (63.0) | 73 (51.8) | |
| Extranodal involvement | 0.142 | ||
| 0–1 site | 28 (60.9) | 102 (72.3) | |
| >1 site | 18 (39.1) | 39 (27.7) | |
| LDH | 0.683 | ||
| Normal | 18 (39.1) | 60 (42.6) | |
| Elevated | 28 (60.9) | 81 (57.4) | |
| IPI | 0.012 | ||
| Low to low intermediate | 19 (41.3) | 88 (62.4) | |
| High intermediate to high | 27 (58.7) | 53 (37.6) | |
| R‐IPI | 0.015 | ||
| Very good | 3 (6.5) | 26 (18.4) | |
| Good | 17 (37.0) | 67 (47.5) | |
| Poor | 26 (56.5) | 48 (34.0) | |
| NCCN‐IPI | 0.038 | ||
| Low to low intermediate | 17 (37.0) | 77 (54.6) | |
| High intermediate to high | 29 (63.0) | 64 (45.4) | |
| Albumin | <0.001 | ||
| Normal | 19 (41.3) | 107 (75.9) | |
| Hypoalbuminaemia | 27 (58.7) | 34 (24.1) | |
| Treatment response | 0.004 | ||
| CR | 27 (58.7) | 114 (80.9) | |
| PR, SD, or PD | 11 (23.9) | 20 (14.2) | |
| Not availablea | 8 (17.4) | 7 (5.0) | |
Data are presented as number of patients (%) except age.
ECOG PS, Eastern Cooperative Oncology Group performance status; LDH, lactate dehydrogenase; IPI, International Prognostic Index; R‐IPI, revised International Prognostic Index; NCCN‐IPI, National Comprehensive Cancer Network International Prognostic Index; CR, complete response; PR, partial response; SD, stable disease; PD, progressive disease.
Information for treatment response was not available in 15 patients because of the following reasons: early discontinuation of treatment because of treatment toxicity after the first cycle of chemotherapy (eight patients), patient's own will to withdraw the treatment (five patients), and loss of follow‐up (two patients).
Treatment toxicity, compliance, and response
Toxicity and compliance of R‐CHOP immunochemotherapy were compared between the sarcopenic and non‐sarcopenic groups (Table 2). The rate of grade 3–4 anaemia in the sarcopenic group was higher than in the non‐sarcopenic group (34.8 vs. 12.1%, P < 0.001). Grade 3–4 thrombocytopenia was more likely to occur in the sarcopenic group than in the non‐sarcopenic group (30.4 vs.17.7%, P = 0.066). Although there was no difference in grade 3–4 neutropenia, the rate of grade 3 or greater febrile neutropenia was significantly higher in the sarcopenic group than in the non‐sarcopenic group (47.8 vs. 28.4%, P = 0.015). Grade 4–5 non‐haematologic toxicity was also more commonly observed in the sarcopenic group than the non‐sarcopenic group (19.6 vs. 6.4%, P = 0.017). In the sarcopenic group, 21.7% (vs. 5.0% in the non‐sarcopenic group, P = 0.002) and 32.6% (vs. 14.9% in the non‐sarcopenic group, P = 0.008) of patients experienced TRM and did not complete the treatment, respectively.
Table 2.
Comparison of toxicity and compliance for immunochemotherapy according to sarcopenia status
| Sarcopenic (n = 46) | Non‐sarcopenic (n = 141) | P | |
|---|---|---|---|
| Grade 3–5 haematologic toxicity | |||
| Anaemiaa | 16 (34.8) | 17 (12.1) | <0.001 |
| Neutropeniaa | 35 (76.1) | 120 (85.1) | 0.158 |
| Thrombocytopeniaa | 14 (30.4) | 25 (17.7) | 0.066 |
| Febrile neutropenia | 22 (47.8) | 40 (28.4) | 0.015 |
| Any grade 3–5 non‐haematologic toxicity | 20 (43.5) | 46 (32.6) | 0.181 |
| Any grade 4–5 non‐haematologic toxicity | 9 (19.6) | 9 (6.4) | 0.017 |
| Treatment‐related mortality | 10 (21.7) | 7 (5.0) | 0.002 |
| Treatment completion | 0.008 | ||
| Completed | 31 (67.4) | 120 (85.1) | |
| Discontinued because of any reasonb | 15 (32.6) | 21 (14.9) |
Data are presented as number of patients having an event (%).
Grade 3–4.
One sarcopenic and two non‐sarcopenic patients discontinued the treatment after three cycles of R‐CHOP because of early disease progression but not because of treatment toxicity.
Treatment response could be assessed in 172 of 187 patients (Table 1). Information for treatment response was not available in 15 patients for the following reasons: early discontinuation of treatment because of treatment toxicity after the first cycle of R‐CHOP (eight patients), patient's own wish to withdraw the treatment (five patients), and loss to follow‐up (two patients). Among the total of 187 patients, the rate of complete response (CR) was much lower in the sarcopenic group than in the non‐sarcopenic group (58.7 vs. 80.9%, P = 0.004). When treatment response was evaluated in 154 patients, excluding those who discontinued treatment because of any cause other than early disease progression, however, there was no statistically significant difference in the CR rate between the sarcopenic and non‐sarcopenic groups (78.1 vs. 90.2%, P = 0.076).
Survival analysis
Overall, with a median follow‐up duration of 60.9 months (range: 0.2–145.3 months), the 5 year PFS and OS rates were 58.4 and 60.7%, respectively. The 5 year PFS rate (35.3 vs. 65.8%, P < 0.001; Figure 1A) and the 5 year OS rate (37.3 vs. 68.1%, P < 0.001; Figure 1B) were significantly lower in the sarcopenic group than in the non‐sarcopenic group. Subgroup analysis revealed a survival disadvantage in the sarcopenic group in nearly all subgroups (Figure 2).
Figure 1.
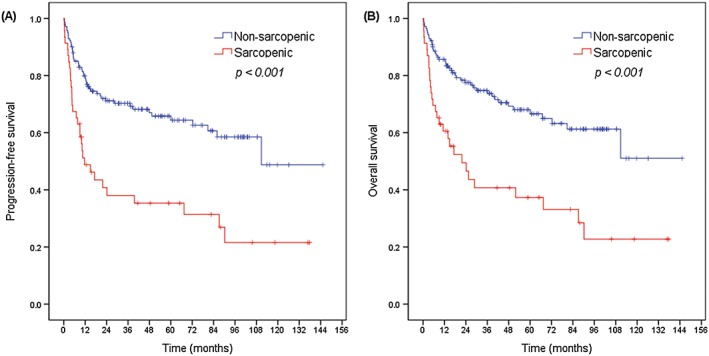
Kaplan–Meier plots for (A) progression‐free survival and (B) overall survival according to sarcopenia status.
Figure 2.
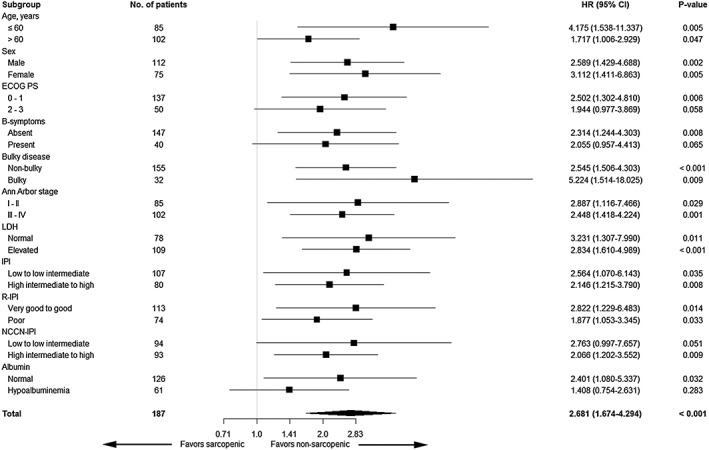
Forest plot for the subgroup analysis of overall survival.
On univariate analyses, the five components of the IPI, B symptoms, hypoalbuminaemia, and sarcopenia were associated with worse PFS and OS. On multivariate analysis, sarcopenia was one of the independent poor prognostic factors for PFS [hazard ratio (HR) = 2.074, 95% CI: 1.298‐3.312, P = 0.002] and OS (HR = 2.112, 95% CI: 1.299‐3.435, P = 0.003), together with the five components of the IPI (Table 3).
Table 3.
Univariate and multivariate analyses for PFS and OS
| Factor | PFS | OS | ||||||||||
|---|---|---|---|---|---|---|---|---|---|---|---|---|
| Univariate | Multivariate | Univariate | Multivariate | |||||||||
| HR | 95% CI | P | HR | 95% CI | P | HR | 95% CI | P | HR | 95% CI | P | |
| Age, years | ||||||||||||
| ≤60 | Ref. | Ref. | Ref. | Ref. | ||||||||
| >60 | 2.969 | 1.801–4.894 | <0.001 | 1.947 | 1.152–3.288 | 0.013 | 3.580 | 2.077–6.171 | <0.001 | 2.522 | 1.435–4.434 | 0.001 |
| Sex | ||||||||||||
| Female | Ref. | Ref. | ||||||||||
| Male | 1.362 | 0.860–2.158 | 0.187 | — | 1.304 | 0.808–2.107 | 0.277 | — | ||||
| ECOG PS | ||||||||||||
| 0–1 | Ref. | Ref. | Ref. | Ref. | ||||||||
| 2–3 | 3.451 | 2.187–5.447 | <0.001 | 2.323 | 1.419–3.805 | 0.001 | 4.049 | 2.513–6.524 | <0.001 | 2.592 | 1.551–4.333 | <0.001 |
| B‐symptoms | ||||||||||||
| Absent | Ref. | Ref. | ||||||||||
| Present | 3.037 | 1.911–4.826 | <0.001 | — | 3.171 | 1.964–5.119 | <0.001 | — | ||||
| Bulky disease | ||||||||||||
| Non‐bulky | Ref. | Ref. | ||||||||||
| Bulky | 0.718 | 0.378–1.362 | 0.310 | — | 0.788 | 0.413–1.504 | 0.470 | — | ||||
| Ann Arbor stage | ||||||||||||
| I–II | Ref. | Ref. | Ref. | Ref. | ||||||||
| III–IV | 4.569 | 2.689–7.764 | <0.001 | 2.619 | 1.332–5.150 | 0.005 | 4.350 | 2.513–7.532 | <0.001 | 2.457 | 1.194–5.057 | 0.015 |
| Extranodal involvement | ||||||||||||
| 0–1 site | Ref. | Ref. | Ref. | Ref. | ||||||||
| >1 site | 4.637 | 2.937–7.322 | <0.001 | 1.906 | 1.078–3.371 | 0.027 | 4.625 | 2.864–7.466 | <0.001 | 1.990 | 1.076–3.683 | 0.028 |
| s | ||||||||||||
| Normal | Ref. | Ref. | Ref. | Ref. | ||||||||
| Elevated | 2.930 | 1.770–4.851 | <0.001 | 1.903 | 1.106–3.274 | 0.020 | 3.346 | 1.954–5.731 | <0.001 | 2.250 | 1.256–4.032 | 0.006 |
| Albumin | ||||||||||||
| Normal | Ref. | Ref. | ||||||||||
| Hypoalbuminaemia | 3.188 | 2.050–4.959 | <0.001 | — | 3.738 | 2.349–5.950 | <0.001 | — | ||||
| BMI | ||||||||||||
| Normal to obese | Ref. | Ref. | ||||||||||
| Underweight | 1.657 | 0.720–3.813 | 0.235 | — | 1.815 | 0.786–4.190 | 0.163 | — | ||||
| Sarcopenia | ||||||||||||
| Non‐sarcopenic | Ref. | Ref. | Ref. | Ref. | ||||||||
| Sarcopenic | 2.583 | 1.643–4.059 | <0.001 | 2.074 | 1.298–3.312 | 0.002 | 2.681 | 1.674–4.294 | <0.001 | 2.112 | 1.299–3.435 | 0.003 |
PFS, progression‐free survival; OS, overall survival; HR, hazard ratio; CI, confidence interval; ECOG PS, Eastern Cooperative Oncology Group performance status; LDH, lactate dehydrogenase; BMI, body mass index.
Prognostic nomogram for OS
A nomogram for predicting OS was constructed using the six significant prognostic factors (sarcopenia and the five components of the IPI) determined by the Cox regression analysis (Figure 3). ECOG PS was the largest contributor in the nomogram, followed by age, Ann Arbor stage, serum LDH level, sarcopenia, and extranodal involvement. The calibration plot for the probability of 3 and 5 year OS showed a good linear relationship between prediction by the nomogram and actual observations (Figure S2). The original c index of the nomogram was 0.80 (95% CI: 0.75‐0.85), and the bias‐corrected c index was 0.78. The performance of the nomogram was compared with those of other prognostic indices (Table S1). The c index of the nomogram (0.80, 95% CI: 0.75‐0.85) was higher than those of the IPI (0.77, 95% CI: 0.72–0.83, P = 0.009), the R‐IPI (0.74, 95% CI: 0.68‐0.79, P < 0.001), and the NCCN‐IPI (0.77, 95% CI: 0.72‐0.82, P = 0.062). Furthermore, the −2LL and the AIC were lower in the nomogram (599.77 and 611.77), compared with the IPI (613.41 and 615.41), R‐IPI (630.47 and 632.47), and NCCN‐IPI (614.18 and 616.18), indicating that the nomogram was the best fitting model with this cohort.
Figure 3.
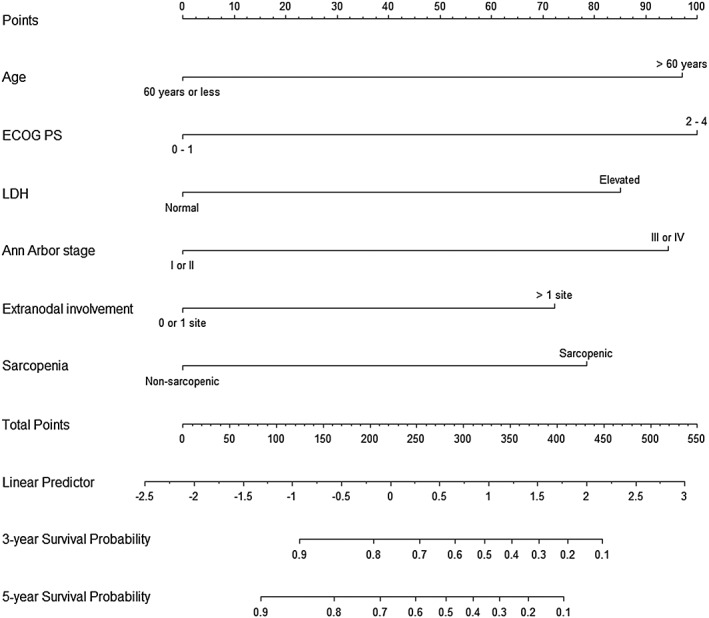
Nomogram for predicting 3 and 5 year overall survival rates.
Additionally, the cohort was grouped according to the predicted probability of 5 year OS derived from the nomogram [predicted 5 year OS rate (nomogram score): ≥90% (0–83), 89–70% (84–211), 69–40% (212–310), and <40% (>310)]. The OS curves were clearly separated according to the nomogram score (P < 0.001; Figure 4).
Figure 4.
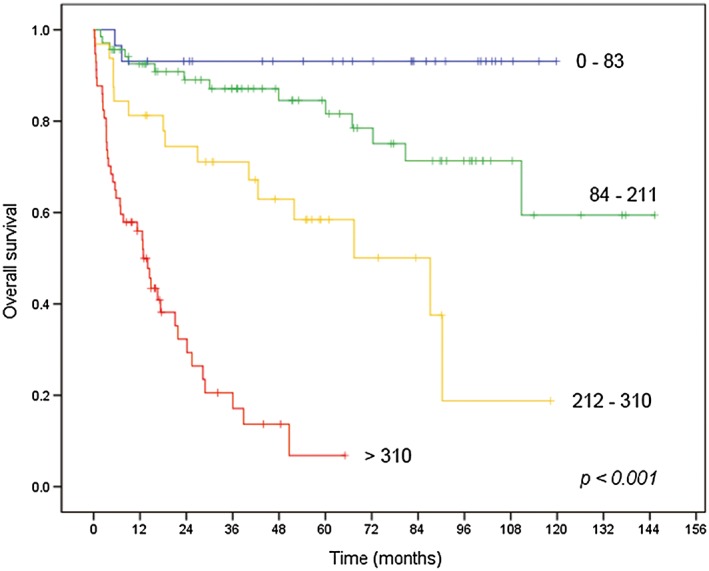
Kaplan–Meier plots for overall survival according to the nomogram score.
Discussion
First, we investigated whether sarcopenia affected the clinical outcome of patients with DLBCL treated with induction R‐CHOP immunochemotherapy. Sarcopenia was strongly and independently associated with worse PFS and OS in this cohort. The sarcopenic group had more frequent episodes of grade 3 or worse anaemia, thrombocytopenia, and febrile neutropenia than the non‐sarcopenic group. Non‐haematological toxicity of grade 4 or more was also more frequently reported in the sarcopenic group. Consequently, the incidences of TRM and early discontinuation of treatment in the sarcopenic group were much higher than those in the non‐sarcopenic group. Although the CR rate in the sarcopenic group was lower than that in the non‐sarcopenic group in the whole cohort, there was no difference in CR rate between the two groups in whom treatment was not interrupted because of causes other than disease progression. This finding means that a lower treatment response rate in the sarcopenic group resulted from suboptimal treatment because of excessive toxicity rather than tumour responsiveness to the treatment. Thus, it is suggested that the main reason why PFS and OS were worse in the sarcopenic group is intolerance to treatment, related to a lower treatment response rate and to TRM.
There have been many reports on the association between sarcopenia and increased treatment toxicity in solid tumours in the contexts of neoadjuvant chemotherapy,26 adjuvant chemotherapy,27 palliative chemotherapy,5 and treatment with targeted agents.6 The precise mechanism that explains these findings remains unknown. However, several studies suggested that patients with cancer with sarcopenia had relatively increased exposure to drug and thus experienced greater treatment toxicity. In a study of patients with breast cancer receiving adjuvant chemotherapy including epirubicin, lower lean body mass (LBM) was significantly associated with decreased clearance of epirubicin and the presence of dose‐limiting toxicity (DLT).28 Another previous study of patients with hepatocellular carcinoma reported that the sarcopenic group had a higher median area under the curve of sorafenib and experienced more DLTs than did the non‐sarcopenic group.29 A recent study of patients with non‐small cell lung cancer also demonstrated that gemcitabine and vinorelbine doses according to body surface area resulted in a substantial variation of drug dose per kilogram LBM, and higher dose per kilogram LBM was associated with more grade 3–4 haematological toxicity.30 However, increased exposure to drug may have beneficial effects in terms of the tumour response to anticancer therapy. In a study of patients with breast cancer receiving neoadjuvant chemotherapy, the pathological CR rate was higher in sarcopenic patients than in non‐sarcopenic patients among those with a normal BMI.31 The authors mentioned that the sarcopenic patients in their study were relatively healthier and were better able to tolerate chemotherapy than those with advanced cancer assessed in other studies.31 All of these previous studies support our findings that sarcopenia is strongly associated with increased treatment toxicity and early discontinuation of treatment, and poor responses to treatment observed in the sarcopenic group are derived from suboptimal treatment because of toxicity but not from tumour responsiveness itself.
Given the low CR rate and greater treatment toxicity, worse survival in the sarcopenic group was the expected result, consistent with the results of many other studies of solid tumours.8, 9, 32, 33 Nevertheless, because sarcopenia was significantly associated with old age, advanced prognostic indices, and hypoalbuminaemia in this study, whether sarcopenia is truly an independent prognostic factor needs to be clarified. When considering age and prognostic indices, the prognostic value of sarcopenia is independent of these factors, because the sarcopenic group had a worse prognosis than did the non‐sarcopenic group regardless of age and prognostic indices in subgroup analysis, and sarcopenia was one of the independent prognostic factors in a multivariate analysis adjusting for these factors. In the case of hypoalbuminaemia, there was a strong correlation between sarcopenia and hypoalbuminaemia, and OS was not significantly different between the sarcopenic and non‐sarcopenic groups in the subgroup of patients with hypoalbuminaemia. However, the number of patients with hypoalbuminaemia was rather small to confirm its significance. Furthermore, the prognostic value of sarcopenia was also independent of the presence of hypoalbuminaemia in a multivariate analysis. Lanic et al. also showed that the predictive value for PFS and OS of sarcopenia was independent of albumin status in patients with DLBCL.20 These findings demonstrate that sarcopenia can be an additive prognostic factor to the conventional prognostic system of DLBCL.
To confirm the additive prognostic value of and to expand the clinical utility of sarcopenia in DLBCL, we constructed a nomogram predicting the 3 and 5 year OS, based on the final model of the Cox regression analysis including sarcopenia and the components of the IPI. A c index of 0.80 in the nomogram indicated excellent discrimination. With the nomogram score, the cohort could be clearly separated into four groups with different prognoses. Moreover, the nomogram was more accurate and appropriate than well‐known prognostic indices, such as the IPI, R‐IPI, and NCCN‐IPI, for predicting prognosis, at least in this cohort. Because the nomogram improved conventional prognostic indices by adding the patient's ability to tolerate treatment to well‐known prognostic factors, the nomogram may help to select ‘fit’ patients for induction R‐CHOP immunochemotherapy and to stratify patients in clinical trials with intensive therapy in DLBCL.
This study had several limitations. First, it used a retrospective design with a small sample size, and thus, it is hard to generalize our findings. To overcome this, we internally validated the model with bootstrap resampling. Furthermore, the sample size of 187 in this study is larger than that of previous studies for sarcopenia in patients with malignant lymphoma.20, 21, 34 Second, this study did not include information about the immunophenotype of DLBCL, such as the germinal center B‐cell (GCB) or the activated B‐cell subtypes. Thus, the relationship between sarcopenia and tumour aggressiveness could not be examined in this study. In a previous study, there was no correlation between sarcopenia and the GCB/non‐GCB subtype in DLBCL.20 Third, compared with the lumbar L3 skeletal muscle, the pectoralis muscle (T4 SMI) used in this study has not yet been validated to define sarcopenia through prospective data. However, measuring the pectoralis muscle area has the advantage that it is easy to identify the muscle area, and it has been demonstrated that the pectoralis muscle area is associated with fat‐free mass.35 Moreover, there was a significant positive correlation between BMI and T4 SMI in this study. Given the paucity of data on these issues, further studies are needed to examine the association between sarcopenia and immunophenotype of DLBCL and to validate the role of the pectoralis muscle area as a surrogate marker for sarcopenia.
In conclusion, this study demonstrates the role of sarcopenia as a poor prognostic marker in patients with DLBCL. We suggest that dose adjustment and intensive supportive care should be considered in patients with DLBCL with sarcopenia receiving induction R‐CHOP immunochemotherapy. Further prospective studies are warranted to confirm the prognostic role of sarcopenia and to externally validate the nomogram including sarcopenia in DLBCL.
Acknowledgement
No funding was received for the present study.
All procedures performed in studies involving human participants were in accordance with the ethical standards of the institutional review board and with the 1964 Helsinki Declaration and its later amendments.
The authors certify that they comply with the ethicalguidelines for authorship and publishing of the Journal of Cachexia, Sarcopenia, and Muscle.36
This study is a retrospective analysis without any interventionand thus did not require informed consent.
Supporting information
Supporting Info Item
Supporting Info Item
Supporting Info Item
Go, S. ‐I. , Park, M. J. , Song, H. ‐N. , Kim, H. ‐G. , Kang, M. H. , Lee, H. R. , Kim, Y. , Kim, R. B. , Lee, S. I. , and Lee, G. ‐W. (2016) Prognostic impact of sarcopenia in patients with diffuse large B‐cell lymphoma treated with rituximab plus cyclophosphamide, doxorubicin, vincristine, and prednisone. Journal of Cachexia, Sarcopenia and Muscle, 7: 567–576. doi: 10.1002/jcsm.12115.
References
- 1. Morley JE, Baumgartner RN, Roubenoff R, Mayer J, Nair KS. Sarcopenia. J Lab Clin Med 2001;137:231–43. [DOI] [PubMed] [Google Scholar]
- 2. Fearon K, Strasser F, Anker SD, Bosaeus I, Bruera E, Fainsinger RL, et al. Definition and classification of cancer cachexia: an international consensus. Lancet Oncol 2011;12:489–95. [DOI] [PubMed] [Google Scholar]
- 3. Ross R. Advances in the application of imaging methods in applied and clinical physiology. Acta Diabetol 2003;40:S45–50. [DOI] [PubMed] [Google Scholar]
- 4. Baracos V, Kazemi‐Bajestani SM. Clinical outcomes related to muscle mass in humans with cancer and catabolic illnesses. Int J Biochem Cell Biol 2013;45:2302–8. [DOI] [PubMed] [Google Scholar]
- 5. Prado CM, Baracos VE, McCargar LJ, Reiman T, Mourtzakis M, Tonkin K, et al. Sarcopenia as a determinant of chemotherapy toxicity and time to tumor progression in metastatic breast cancer patients receiving capecitabine treatment. Clin Cancer Res 2009;15:2920–6. [DOI] [PubMed] [Google Scholar]
- 6. Antoun S, Baracos VE, Birdsell L, Escudier B, Sawyer MB. Low body mass index and sarcopenia associated with dose‐limiting toxicity of sorafenib in patients with renal cell carcinoma. Ann Oncol 2010;21:1594–8. [DOI] [PubMed] [Google Scholar]
- 7. Prado CM, Lieffers JR, McCargar LJ, Reiman T, Sawyer MB, Martin L, et al. Prevalence and clinical implications of sarcopenic obesity in patients with solid tumours of the respiratory and gastrointestinal tracts: a population‐based study. Lancet Oncol 2008;9:629–35. [DOI] [PubMed] [Google Scholar]
- 8. Tan BH, Birdsell LA, Martin L, Baracos VE, Fearon KC. Sarcopenia in an overweight or obese patient is an adverse prognostic factor in pancreatic cancer. Clin Cancer Res 2009;15:6973–9. [DOI] [PubMed] [Google Scholar]
- 9. Martin L, Birdsell L, Macdonald N, Reiman T, Clandinin MT, McCargar LJ, et al. Cancer cachexia in the age of obesity: skeletal muscle depletion is a powerful prognostic factor, independent of body mass index. J Clin Oncol 2013;31:1539–47. [DOI] [PubMed] [Google Scholar]
- 10. Miller BS, Ignatoski KM, Daignault S, Lindland C, Doherty M, Gauger PG, et al. Worsening central sarcopenia and increasing intra‐abdominal fat correlate with decreased survival in patients with adrenocortical carcinoma. World J Surg 2012;36:1509–16. [DOI] [PubMed] [Google Scholar]
- 11. Armitage JO, Chan WC, Gascoyne R, Connors J, Close P, Jacobs P, et al. A clinical evaluation of the International Lymphoma Study Group classification of non‐Hodgkin's lymphoma. The Non‐Hodgkin's Lymphoma Classification Project Blood 1997;89:3909–18. [PubMed] [Google Scholar]
- 12. Jung KW, Won YJ, Kong HJ, Oh CM, Cho H, Lee DH, et al. Cancer statistics in Korea: incidence, mortality, survival, and prevalence in 2012. Cancer Res Treat 2015;47:127–41. [DOI] [PMC free article] [PubMed] [Google Scholar]
- 13. Shipp MA, Harrington DP, Anderson JR, Armitage JO, Bonadonna G, Brittinger G, et al. A predictive model for aggressive non‐Hodgkin's lymphoma. The International Non‐Hodgkin's Lymphoma Prognostic Factors Project. N Engl J Med 1993;329:987–94. [DOI] [PubMed] [Google Scholar]
- 14. Coiffier B, Lepage E, Briere J, Herbrecht R, Tilly H, Bouabdallah R, et al. CHOP chemotherapy plus rituximab compared with CHOP alone in elderly patients with diffuse large‐B‐cell lymphoma. N Engl J Med 2002;346:235–42. [DOI] [PubMed] [Google Scholar]
- 15. Habermann TM, Weller EA, Morrison VA, Gascoyne RD, Cassileth PA, Cohn JB, et al. Rituximab‐CHOP versus CHOP alone or with maintenance rituximab in older patients with diffuse large B‐cell lymphoma. J Clin Oncol 2006;24:3121–7. [DOI] [PubMed] [Google Scholar]
- 16. Pfreundschuh M, Trumper L, Osterborg A, Pettengell R, Trneny M, Imrie K, et al. CHOP‐like chemotherapy plus rituximab versus CHOP‐like chemotherapy alone in young patients with good‐prognosis diffuse large‐B‐cell lymphoma: a randomised controlled trial by the MabThera International Trial (MInT) Group. Lancet Oncol 2006;7:379–91. [DOI] [PubMed] [Google Scholar]
- 17. Pfreundschuh M, Kuhnt E, Trumper L, Osterborg A, Trneny M, Shepherd L, et al. CHOP‐like chemotherapy with or without rituximab in young patients with good‐prognosis diffuse large‐B‐cell lymphoma: 6‐year results of an open‐label randomised study of the MabThera International Trial (MInT) Group. Lancet Oncol 2011;12:1013–22. [DOI] [PubMed] [Google Scholar]
- 18. Sehn LH, Berry B, Chhanabhai M, Fitzgerald C, Gill K, Hoskins P, et al. The revised International Prognostic Index (R‐IPI) is a better predictor of outcome than the standard IPI for patients with diffuse large B‐cell lymphoma treated with R‐CHOP. Blood 2007;109:1857–61. [DOI] [PubMed] [Google Scholar]
- 19. Zhou Z, Sehn LH, Rademaker AW, Gordon LI, Lacasce AS, Crosby‐Thompson A, et al. An enhanced International Prognostic Index (NCCN‐IPI) for patients with diffuse large B‐cell lymphoma treated in the rituximab era. Blood 2014;123:837–42. [DOI] [PMC free article] [PubMed] [Google Scholar]
- 20. Lanic H, Kraut‐Tauzia J, Modzelewski R, Clatot F, Mareschal S, Picquenot JM, et al. Sarcopenia is an independent prognostic factor in elderly patients with diffuse large B‐cell lymphoma treated with immunochemotherapy. Leuk Lymphoma 2014;55:817–23. [DOI] [PubMed] [Google Scholar]
- 21. Camus V, Lanic H, Kraut J, Modzelewski R, Clatot F, Picquenot JM, et al. Prognostic impact of fat tissue loss and cachexia assessed by computed tomography scan in elderly patients with diffuse large B‐cell lymphoma treated with immunochemotherapy. Eur J Haematol 2014;93:9–18. [DOI] [PubMed] [Google Scholar]
- 22. Cheson BD, Pfistner B, Juweid ME, Gascoyne RD, Specht L, Horning SJ, et al. Revised response criteria for malignant lymphoma. J Clin Oncol 2007;25:579–86. [DOI] [PubMed] [Google Scholar]
- 23. Consultation WHOE. Appropriate body‐mass index for Asian populations and its implications for policy and intervention strategies. Lancet 2004;363:157–63. [DOI] [PubMed] [Google Scholar]
- 24. Harrell FE Jr, Lee KL, Mark DB. Multivariable prognostic models: issues in developing models, evaluating assumptions and adequacy, and measuring and reducing errors. Stat Med 1996;15:361–87. [DOI] [PubMed] [Google Scholar]
- 25. Iasonos A, Schrag D, Raj GV, Panageas KS. How to build and interpret a nomogram for cancer prognosis. J Clin Oncol 2008;26:1364–70. [DOI] [PubMed] [Google Scholar]
- 26. Tan BH, Brammer K, Randhawa N, Welch NT, Parsons SL, James EJ, et al. Sarcopenia is associated with toxicity in patients undergoing neo‐adjuvant chemotherapy for oesophago‐gastric cancer. Eur J Surg Oncol 2015;41:333–8. [DOI] [PubMed] [Google Scholar]
- 27. Jung HW, Kim JW, Kim JY, Kim SW, Yang HK, Lee JW, et al. Effect of muscle mass on toxicity and survival in patients with colon cancer undergoing adjuvant chemotherapy. Support Care Cancer 2015;23:687–94. [DOI] [PubMed] [Google Scholar]
- 28. Prado CM, Lima IS, Baracos VE, Bies RR, McCargar LJ, Reiman T, et al. An exploratory study of body composition as a determinant of epirubicin pharmacokinetics and toxicity. Cancer Chemother Pharmacol 2011;67:93–101. [DOI] [PubMed] [Google Scholar]
- 29. Mir O, Coriat R, Blanchet B, Durand JP, Boudou‐Rouquette P, Michels J, et al. Sarcopenia predicts early dose‐limiting toxicities and pharmacokinetics of sorafenib in patients with hepatocellular carcinoma. PLoS One 2012;7:e37563. [DOI] [PMC free article] [PubMed] [Google Scholar]
- 30. Sjoblom B, Gronberg BH, Benth JS, Baracos VE, Flotten O, Hjermstad MJ, et al. Low muscle mass is associated with chemotherapy‐induced haematological toxicity in advanced non‐small cell lung cancer. Lung Cancer 2015;90:85–91. [DOI] [PubMed] [Google Scholar]
- 31. Del Fabbro E, Parsons H, Warneke CL, Pulivarthi K, Litton JK, Dev R, et al. The relationship between body composition and response to neoadjuvant chemotherapy in women with operable breast cancer. Oncologist 2012;17:1240–5. [DOI] [PMC free article] [PubMed] [Google Scholar]
- 32. Miyamoto Y, Baba Y, Sakamoto Y, Ohuchi M, Tokunaga R, Kurashige J, et al. Sarcopenia is a negative prognostic factor after curative resection of colorectal cancer. Ann Surg Oncol 2015;22:2663–8. [DOI] [PubMed] [Google Scholar]
- 33. Psutka SP, Carrasco A, Schmit GD, Moynagh MR, Boorjian SA, Frank I, et al. Sarcopenia in patients with bladder cancer undergoing radical cystectomy: impact on cancer‐specific and all‐cause mortality. Cancer 2014;120:2910–8. [DOI] [PubMed] [Google Scholar]
- 34. Caram MV, Bellile EL, Englesbe MJ, Terjimanian M, Wang SC, Griggs JJ, et al. Sarcopenia is associated with autologous transplant‐related outcomes in patients with lymphoma. Leuk Lymphoma 2015;1–8. [DOI] [PubMed] [Google Scholar]
- 35. McDonald ML, Diaz AA, Ross JC, San Jose Estepar R, Zhou L, Regan EA, et al. Quantitative computed tomography measures of pectoralis muscle area and disease severity in chronic obstructive pulmonary disease. A cross‐sectional study. Ann Am Thorac Soc 2014;11:326–34. [DOI] [PMC free article] [PubMed] [Google Scholar]
- 36. von Haehling S, Morley JE, Coats AJS, Anker SD. Ethical guidelines for publishing in the Journal of Cachexia, Sarcopenia and Muscle: update 2015. J Cachexia Sarcopenia Muscle 2015;6: 315–316. [DOI] [PMC free article] [PubMed] [Google Scholar]
Associated Data
This section collects any data citations, data availability statements, or supplementary materials included in this article.
Supplementary Materials
Supporting Info Item
Supporting Info Item
Supporting Info Item