

Abstract
Scale-up of viral load (VL) monitoring for HIV-infected patients on antiretroviral therapy (ART) is a priority in many resource-limited settings, and ART providers are critical to effective program implementation. We explored provider-perceived barriers and facilitators of VL monitoring. We interviewed all providers (n=17) engaged in a public health evaluation of dried blood spots for VL monitoring at five ART clinics in Malawi. All ART clinics were housed within district hospitals. We grouped themes at patient, provider, facility, system, and policy levels. Providers emphasized their desire for improved ART monitoring strategies, and frustration in response to restrictive policies for determining which patients were eligible to receive VL monitoring. Although many providers pled for expansion of monitoring to include all persons on ART, regardless of time on ART, the most salient provider-perceived barrier to VL monitoring implementation was the pressure of work associated with monitoring activities. The work burden was exacerbated by inefficient data management systems, highlighting a critical interaction between provider-, facility-, and system-level factors. Lack of integration between laboratory and clinical systems complicated the process for alerting providers when results were available, and these communication gaps were intensified by poor facility connectivity. Centralized second-line ART distribution was also noted as a barrier: providers reported that the time and expenses required for patients to collect second-line ART frequently obstructed referral. However, provider empowerment emerged as an unexpected facilitator of VL monitoring. For many providers, this was the first time they used an objective marker of ART response to guide clinical management. Providers’ knowledge of a patient's virological status increased confidence in adherence counseling and clinical decision making. Results from our study provide unique insight into provider perceptions of VL monitoring and indicate the importance of policies responsive to individual and environmental challenges of VL monitoring program implementation. Findings may inform scale-up by helping policymakers identify strategies to improve feasibility and sustainability of VL monitoring.
Keywords: HIV, viral load monitoring, provider perceptions, resource-limited settings
Introduction
Viral load (VL) testing is recommended by the World Health Organization (WHO) as the preferred method for monitoring response to antiretroviral therapy (ART) and identifying treatment failure(WHO, 2013). Alternative methods for identifying treatment failure in resource-limited settings, such as immunological (CD4 cell counts) and clinical staging, are considerably less sensitive and specific than VL monitoring (Chaiwarith et al., 2007; Mee, Fielding, Charalambous, Churchyard, & Grant, 2008; Moore et al., 2008; Rawizza et al., 2011; Rewari et al., 2010; Reynolds, Nakigozi, et al., 2009; Sigaloff et al., 2011; van Oosterhout et al., 2009). By identifying failure earlier, VL monitoring reduces morbidity and mortality, improves second-line ART outcomes by avoiding accumulation of ART resistance mutations, and guides providers as they counsel patients and reinforce adherence behavior (Anderson & Bartlett, 2006; Calmy et al., 2007; Gsponer et al., 2012; Hosseinipour et al., 2009; Keiser et al., 2010; Kumarasamy et al., 2009; Marconi et al., 2008; Pujades-Rodriguez, O'Brien, Humblet, & Calmy, 2008; Reynolds, Kityo, et al., 2009). Despite these benefits, VL monitoring is rarely available in, resource-limited settings with the highest HIV burden, including sub-Saharan Africa. Traditional VL tests require expensive laboratory equipment, complex specimen collection procedures, and highly-trained personnel (Calmy, et al., 2007; Roberts, Bygrave, Fajardo, & Ford, 2012; UNAIDS, 2013). Dried blood spots (DBS) have emerged as an alternative to plasma-based VL testing for resource-limited settings by simplifying specimen collection and storage; centralizing laboratory testing; and reducing the need for extensive clinic-level laboratory infrastructure. DBS collection by ART providers at outlying clinics and a centralized laboratory for specimen testing may increase access to VL monitoring in remote clinics (Johannessen, 2010; Johannessen, Troseid, & Calmy, 2009; Rutstein et al., 2015). The WHO and national ART management guidelines in many resource-limited settings advocate use of DBS as the preferred monitoring model when traditional VL testing is not feasible (“Clinical Management of HIV In Children and Adults,” 2014; WHO, 2013, 2014).
ART providers are critical to the WHO phased approach to VL scale-up preparations (Figure 1) (WHO, 2014) and, ultimately, to achieve potential individual and public health benefits of VL monitoring. Currently, providers are responsible for clinical staging, adherence counseling, and drug distribution. VL monitoring may task providers with additional responsibilities, including VL specimen collection and providing focused adherence counseling and more frequent second-line ART referral. Appropriate counseling and referral for second-line ART requires provider commitment and cooperation, as well as adequate comprehension of how to deliver guideline-concordant care using VL monitoring results(Madec, Leroy, Rey-Cuille, Huber, & Calmy, 2013).
Figure 1. WHO VL Monitoring Scale-up(WHO, 2014).

Phased implementation of viral load monitoring as described in the World Health Organization's Technical and Operational Considerations for Implementing HIV Viral Load Testing identifies human resources, including training ART providers, in Phase II of the scale-up activities.
Recognizing that successfully implementing and sustaining a VL monitoring program requires ART providers’ support, we interviewed providers to explore their perceived barriers to, and facilitators of, incorporating VL monitoring into daily clinical practice. These interviews were conducted in the context of a parent study in which we evaluated the feasibility and effectiveness of DBS for VL monitoring in ART clinics in central and southern Malawi (Rutstein, et al., 2015). Less than 1% of Malawian ART patients are on second-line regimens, likely a reflection of providers’ reliance on clinical staging to identify first-line treatment failure (“Integrated HIV Program Report July - September 2013,” 2013). Responding to WHO policies and the likely under-diagnosis of virological failure, Malawi is one of many countries attempting to incorporate VL monitoring from DBS into its care package for the 450,000+ persons on ART, phasing out the still limited CD4-cell count based monitoring approach (“Clinical Management of HIV In Children and Adults,” 2014). Findings may help inform VL monitoring scale-up strategies, focusing on the contributions, challenges, and opportunities for DBS for VL monitoring as perceived by the frontline healthcare workers.
Methods
Parent study
The parent study was a public health evaluation of DBS for VL monitoring at five ART clinics located in district hospitals in central and southern Malawi (Rutstein, et al., 2015). None of the enrolling clinics had access to VL monitoring outside of enrollment in the DBS study; all clinics relied on clinical staging for ART monitoring as CD4-based criteria was not recommended per Malawi guidelines in place during the period of data collection (2013-2014) (“Clinical Management of HIV In Children and Adults,” 2014). (S. Rutstein, D. Kamwendo, et al., 2014; S. E. Rutstein et al., 2014)Target study enrollment ranged from 250-450 ART patients, depending on clinic size and pace of enrollment (Table I). Clinics were staffed by a combination of nurses, clinical officers, and other ART support staff, although daily staff frequently rotated. All providers received a two-day training on study protocols (Figure 2). VL results were returned to the clinic using a combination of e-mail, short message service (SMS), mobile phone, and hand-delivered hardcopy results. To retain confidentiality, SMS and email messages identified patients using only unique patient identifiers.
Table I.
Clinic characteristics
| Central region sites | Southern region sites | ||||
|---|---|---|---|---|---|
| 1 | 2 | 3 | 4 | 5 | |
| Clinic specific characteristics | |||||
| Patient census (alive on ART)1 | 4102 | 1024 | 1348 | 3632 | 5800 |
| Core ART clinic staff2 | 3 | 2 | 3 | 3 | 4 |
| Distance to central second-line distribution (km by road vehicle)3 | 240 | 56 | 90 | 60 | 65 |
| Study specific characteristics | |||||
| Total patients enrolled in study | 249 | 241 | 251 | 300 | 457 |
| Period of enrollment (months) | 8 | 6 | 2 | 6 | 4 |
| Number of interviews (clinic coordinator/nurse/other) | 3 (0/2/1) | 3 (1/1/1) | 3 (1/1/1) | 4 (0/2/2) | 4 (1/2/1) |
Numbers based on total ART patients alive and on ART at site as of the first quarter of 2013.
Core staff include only ART nurses and clinic coordinators (clinical officers or nurses). Most clinic staff rotated throughout district posts. Additional staff members indirectly involved in study activities include support staff (including ART clerks), and persons involved in specimen collection (laboratory technicians, HIV testers and counselors, and health surveillance assistants).
At time of study initiation, second-line therapy was not available at any enrolling clinic. Clinics 1 and 3 were periodically stocked with second-line ART towards the end of the study period, although stockouts were not uncommon. Distances represent the distance to the second-line collection point up until the point that second-line ART was made available at the enrolling clinic.
ART, antiretroviral therapy; km, kilometers;
Figure 2. Dried blood spot (DBS) study flow.

ART patients receiving care at enrolling clinics were briefed as to study purpose and eligibility during the morning education section. After identifying eligible patients, providers completed informed consent forms and study-specific case report forms for patient demographics, clinical history, and adherence. DBS specimens were collected and, after appropriate drying time, transported to the central laboratory in Lilongwe where specimens were tested. Results were returned to clinics using email, SMS and/or in-person hard-copy printouts. Patients were supposed to receive the results at their next visit. Each site was encouraged to designate tasks and responsibilities to clinic personnel in a manner that suited existing clinic flow, patient volume, and staffing constraints. The provider interviews, the topic of this paper, occurred once the study procedures had begun at a given clinic.
Study Population and Activities
Between July 2013 and January 2014, we conducted in-person interviews with all providers involved in the parent study clinical activities at enrolling clinics. Providers’ VL monitoring responsibilities included retrieving patient records, collecting specimens, arranging transport of specimens to the central laboratory, communicating with the study team regarding supply shortages, patient adherence counseling after receiving VL results, and second-line ART referral. We identified providers via onsite point-persons–frequently a nurse who assumed additional study-related duties(Marshall, 1996). All providers agreed to participate and gave written informed consent. The National Health Sciences Research Committee of Malawi, the Centers for Disease Control and Prevention Ethics Review, and the Biomedical Institutional Review Board at University of North Carolina, Chapel Hill approved this study.
Interview guide
We developed the interview guide to explore providers’ perceptions of the barriers and facilitators to implementing VL monitoring. We used probing questions to explore emerging themes. All interviews were conducted in English by two study coordinators who had no affiliations within enrolling clinics. Interviewers were trained in qualitative methods and contributed to development of the interview guides. Interviews were audio-recorded and transcribed (Corbin & Strauss, 2008; Marshall, 1996).
Analysis
All transcripts were coded by the primary researcher (SER) using ATLAS.ti (version 7.0, ATLAS.ti Scientific Software Development GmbH, Berlin, Germany) (Friese, 2014). A second coder (SH), independently coded 30% of transcripts. The two coders reviewed double-coded transcripts; differences in code application were resolved through discussion and negotiated consensus (Corbin & Strauss, 2008; Yin, 2011).
We based initial structural codes upon interview topics (e.g., specimen handling, returning VL results to clinic). Thematic content analysis of transcripts guided identification, analysis, and reporting of themes (Braun & Clark, 2006). We reviewed transcripts for broad concepts and used early memos to generate an initial codebook (Saldana, 2013). As we identified interpretive codes, we coded in more depth, revising and accumulating codes (Boeije, 2002). We added new themes to the codebook and reviewed previously-coded transcripts to ensure coding logic completeness and consistency. The codebook was therefore a living document–adapting to the themes and concepts as they surfaced during analysis. When we completed the coding, we conducted a line-by-line analysis to ensure that all coded transcripts reflected the final codebook.(Saldana, 2013)
Results
Participant characteristics
We interviewed 17 ART providers: 3 ART coordinators, 8 non-coordinator nurses, and 6 other clinic personnel. ART coordinators were either nurses or clinical officers (non-physician clinical provider). Other providers included a hospital attendant, laboratory technicians (n=2), HIV testing counselors (n=2), and an ART clerk. Providers had been in their posts a median of 7 years (range 1-30).
Overview of provider-reported barriers and facilitators
We identified 12 themes at five levels: patient-level (demand for VL monitoring, financial barriers to VL monitoring uptake, comprehension of VL), provider-level (benefits of VL monitoring, workload), facility-level (specimen handling, communication, staffing and task distribution), system-level (delayed result return, second-line ART distribution), and policy-level (eligibility restrictions, continuation of VL monitoring post-study completion) (Figure 3). We present results at each level, examining the interplay between levels and themes in the discussion.
Figure 3. Multilevel framework.
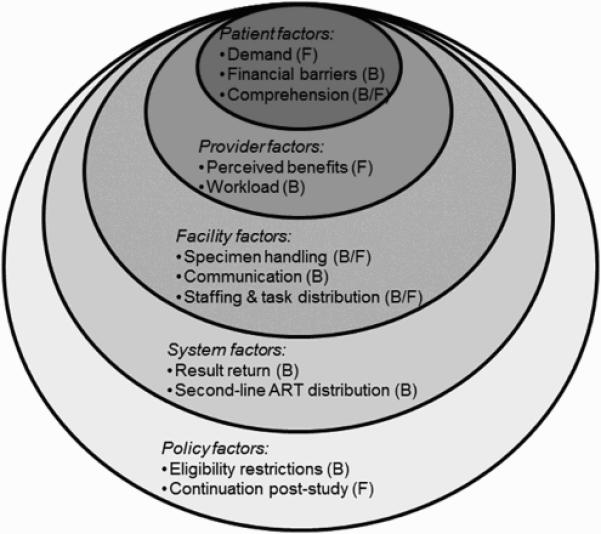
This figure outlines the multilevel factors that relate to provider acceptability, perceived barriers and facilitators of viral load (VL) monitoring using DBS. The framework identified patient, provider, facility, system and policy factors that are examined in our assessment of barriers to and facilitators of incorporating VL monitoring into clinical practice. ART, antiretroviral therapy; B, barrier; DBS, dried blood spot; F, facilitator
Patient-level factors: ‘in my body’
Providers characterized an eager patient population that craved information about their body's response to ART. This eagerness was countered both patients’ and providers’ frustration with the Ministry of Health's (MOH) eligibility criteria for receiving VL testing (Table 2, Patient [1]).
Table 2.
Participant quotes
|
Patient level
| |
| [1] | ‘We need VL! We need VL! We need VL!’ so, we hope. You know these people are very interested to know what is going on in the body. – Female nurse |
| [2] | Of course [we encounter] some [pushback from clients], because some are coming from far...But still, this doesn't mean that they will not come. They will still come... – Female nurse |
| [3] | But again...to some people it was like a confusion a little bit because undetectable to them it was like maybe the virus[es] are dead so they can stop taking ARVs...– Female nurse |
|
Provider level | |
| [1] | I say to them: “before we started treatment, we said the function of how ARVs work...they block the lifecycle of the HIV...And this is what we have been expecting since you started ART. [N]ow that we have tested your blood, it...shows that the HIV is not replicating, but this does not make you HIV free.” So, if they understand, they appreciate. – Male ART coordinator |
| [2] | The good things we have seen with this study is that it has given us a clear mind, [not] waiting for them to get sick and present [with] treatment failure.– Female nurse |
| [3] | It has also helped us to know what is going on with the drugs they are taking. Because we didn't know. Like in the past they would ask us ‘I want to know! I want to know how the drugs are going on in my body!’ but we were not able to answer them...– Female nurse |
| [4] | You are [learning] how to do counseling, how to do adherence, how to monitor them, and you know, suppose somebody has this high VL, what about the next step, you know? So we are learning. I am one of those people! – Male ART coordinator |
| [5] | It has been a headache because it was like an added job for what we have been doing. Like we have always been in the ART clinic, we are always busy. So, when it comes [time] for this VL study, yea it was like, we've added another job. We are even not going for lunch, working very late just to help the clients...Of course it has helped us and the client. But according to the workload, it was too much. –Female nurse |
|
Facility level | |
| [1] | ...it was cold, so you need two pricks to have enough blood. But now, because of the weather, it has changed. Now it's hot. We are no longer experiencing such kind of things...People here, they work in the field each and every time, so their fingers become hard. So you need to prick deeply. – Male laboratory technician |
| [2] | The reasons might be due to lack of transport to send samples to the testing site in good time (e.g. we still have samples collected earlier last week and no sign of transport to date). So issues of transport may have contributed to the delay of testing and then later to result delivery. – Female nurse |
| [3] | No, there is no consistent email. The internet was connected [and] the hospital was paying, but due to funding constraints...they disconnected. – Male ART coordinator |
| [4] | I'm just alone here, so I'm doing each and every patient...Because we have just this ART room, only this one. – Female nurse |
| [5] | We usually have nurses who are rotating...So sometimes it may happen that with the workload...somebody can easily miss somebody. – Female nurse |
| [6] | We work as a team and so far I haven't see any kind of resistance from our friends. We have been doing well. – Male Laboratory technician |
|
System level | |
| [1] | I think the real turnaround time was like 28 days. But as of...today...the clients...did not get their results because the results were not with us at our site. – Male ART coordinator |
| [2] | I think [SMS printers] would be better...we may not have experienced the hiccups already shared on result delays encountered here. – Female nurse |
| [3] | We don't have second-line, so we are supposed to refer to Lilongwe...you know...some villagers, they can't afford to travel... It's a challenge. – Female nurse |
| [4] | Just to tell [the patients] that they have to go there, it was easy. But for them it was difficult...they were always complaining about the transport monies. ...For second-line drugs...it's very difficult...When they go there also, they are just given one bottle. So for them to go back again next month, it becomes a problem. – Female nurse |
|
Policy level | |
| [1] | So for those who have taken ARVs for so long, was it not possible at least to check everybody? ...Because some people again, they ... will not meet the eligibility if the government starts today, they will...they will miss it. And it will be painful. – Female nurse |
| [2] | I would say, because it's a study, I would wish that you would roll this out country-wide. It should be routine to each and every client, maybe, [every] client who is HIV-positive and he is on ART. – Male laboratory technician |
Despite eagerness for VL monitoring, providers identified common patient-reported including challenges with attending follow-up visits to both receive results and be referred for second-line therapy. To facilitate faster transition to appropriate regimens for failing patients, the study protocol dictated patients return after one month to receive VL results – an extra trip between the normal quarterly clinic visits. Some providers claimed that patients were willing to follow-up, while others emphasized patient reluctance to return between their regularly scheduled visits. On rare occasions, providers reported that eligible patients declined monitoring because of financial barriers associated with acquiring transportation for the extra visit back to the clinic to receive results (Table 2, Patient [2]).
Providers described a spectrum of patients’ comprehension of VL. The overwhelming majority of providers reported that patients understood the concept of VL. However, other providers reported patients confusing VL with CD4 cell counts or described dangerous misunderstandings regarding interpretation of an “undetectable” VL (Table 2, Patient [3]).
Providers frequently used patient misconceptions as an opportunity to counsel on the importance of ART adherence.
Provider-level factors: ‘pressure of work’
All providers identified benefits for both patients and providers of incorporating VL into clinical practice. Patient education, including reinforcing adherence behavior, was frequently identified as a benefit of delivering the VL result (Table 2, Provider [1]).
Another reported benefit of VL monitoring was helping providers identify treatment failure. Clinical symptoms poorly predict virological failure (Chaiwarith, et al., 2007; Lynen, Van Griensven, & Elliott, 2010; Mee, et al., 2008; Moore, et al., 2008; Rawizza, et al., 2011; Reynolds, Nakigozi, et al., 2009; van Oosterhout, et al., 2009). However, in the absence of VL monitoring, providers relied on the less sensitive and less specific clinical staging to identify ART failure. Providers were surprised at how infrequently the patients with high VLs showed symptoms of failure, expressing concern that they may have missed persons who were failing treatment (Table 2, Provider [2]).
Provider empowerment emerged as an unexpected reported benefit of VL monitoring. Most providers had not used VL to guide ART management previously. Although familiar with ART's mechanism of action, this was the first time many providers directly appreciated ART suppressing viral replication. The evidence of ART efficacy increased provider's confidence in ART adherence counseling and contributed to their overall clinical confidence. Providers frequently expressed excitement with their new insight into patient well-being (Table 2, Provider [3,4]).
Despite the acknowledged benefits of VL monitoring, providers emphasized that the associated duties overwhelmed already-limited personnel. Every provider involved in patient management described the additional burden associated with VL monitoring, such as the time required to complete adherence assessment forms. It was unclear whether the added work burden was specific to study activities (e.g., obtaining patient consent) or extended to tasks that would be expected of providers if VL monitoring was integrated into their everyday clinical practice (Table 2, Provider [5]).
Facility-level factors: ‘disconnected’
Providers were generally pleased with sample collection and storage of DBS cards(Johannessen, 2010; Johannessen, et al., 2009). Among providers who described specimen collection as part of their study duties, most acknowledged the simple and rapid (~3-5 minutes) fingerstick specimen collection procedures. However, when challenges with specimen collection were noted, they were frequently due to cool weather or thickened skin (Table 2, Facility [1]).
Inconsistent specimen transport mechanisms hindered DBS specimen movement between outlying clinics and the central laboratory. The parent study relied largely on hospital vehicles for specimen transportation. Site personnel were instructed to work with the hospital administrators and other departments to arrange for DBS cards to go with any vehicle going from the hospital to the capital, located approximately 3-6 hours from enrolling clinics. Although generally described as successful, providers noted inconsistent availability of vehicles to facilitate specimen transfer (Table 2, Facility [2]). The hospital that used an established district-wide motorcycle specimen transport system was more satisfied with their specimen transfer arrangements.
Absent/intermittent internet connectivity interrupted communication between the central lab and clinics. Communication about results, need for additional supplies, or other VL monitoring-related issues frequently relied on personal mobile phones. This barrier was generally identified by the clinic “point person” who had been tasked with oversight of supplies and recording VL results (Table 2, Facility [3]).
Perhaps the greatest facility-specific barrier to VL monitoring was the shortage of staff, an issue frequently identified as an impediment to completing VL monitoring activities (Table 2, Facility [4]). Rotating staff further obstructed VL enrollment and follow-up activities. Providers described inconsistent staffing alongside reluctance of rotating staff to participate in VL monitoring activities as contributors to failing to return VL results to patients during scheduled clinic visits (Table 2, Facility [5]).
Some sites were able to accommodate the extra responsibilities better than others, largely due to more equitable distribution of tasks. Interestingly, providers who identified teamwork as key to their success were exclusively at higher volume sites – none of the low-volume site providers discussed teamwork during interviews (Table 2, Facility [6]).
Task-shifting to lower-cadre providers, such as health surveillance assistants (HSAs), occurred at most sites. Task-shifting helped distribute the burden of VL monitoring activities, particularly specimen collection, (Callaghan, Ford, & Schneider, 2010; Chan et al., 2014; Pannus et al., 2014) and facilitated access to VL monitoring in more remote clinics and health centers where nurses and clinicians may not rotate regularly.
System-level factors: ‘at first, it was difficult’
Delayed return of VL results to patients and centralized second-line ART distribution inhibited patient flow and referral efficiency. A month-long machine outage at the central lab created a backlog in completing assays and required rescheduling numerous patient follow-up visits. Unfortunately, without an established notification system, patients still came to the clinic despite unavailable results. Also, as neither electronic nor paper-based data management systems could alert providers when a result was sent by the laboratory, providers frequently missed opportunities to deliver results even when they were available. Providers at all clinics highlighted laboratory-driven delays, citing discrepancies between result turnaround times the lab projected versus provided (Table 2, System [1]). When probed further on reasons that results had not been delivered months after a patient was enrolled, a few providers focused on patients, suggesting that patients should remind providers when they were expecting a result.
Most providers endorsed the idea of using of an SMS printer to facilitate more rapid result reporting. SMS printers are distinct from the mobile-phone based SMS method used in this study. SMS printers could receive data directly from the central laboratory, generating a receipt-like output containing patient ID and VL results (Table 2, System [2]).
Providers reported that the time and expenses required for patients to collect second-line ART frequently obstructed referral. Second-line ART distribution is tightly controlled in Malawi and frequently only available at larger district or central hospitals. Half of the patients who were eligible for second-line ART were switched the same day they received their confirmatory VL result. However, providers described tremendous challenges linking the remaining patients to second-line therapy. For some patients, it took over a year before they started on second-line ART (Table 2, System [3,4]).
Policy-level factors: ‘why not us?’
Reported policy factors highlight the challenges of practising in extremely resource-constrained settings where care rationing confronted the desire to provide comprehensive services to patients. For example, Malawi policy dictates that persons are eligible for VL monitoring after 6- and 24-months of ART exposure, and every 24-months thereafter, or if they are showing clinical signs of treatment failure (“Clinical Management of HIV In Children and Adults,” 2014). Providers were frustrated with criteria that required them to turn away many willing patients who had been on ART for years but were not presenting at an eligible time point. They were forced to ration a service that they felt was tremendously useful for guiding clinical practice and counseling patients. Perceived rationing of this ART management tool challenged providers’ newfound empowerment. Relaying the response of patients who failed to meet eligibility criteria, providers almost universally described a patient sentiment of ‘why not us?’ (Table 2, Policy [1]).
At the end of each interview, providers were given the opportunity to ask any questions and provide feedback regarding study procedures (i.e., what worked? What could be improved?). Providers frequently queried about plans for continuing VL monitoring activities after meeting study enrollment targets (Table 2, Policy [2]).
Discussion
Successful implementation of VL monitoring in resource-limited settings requires coordination of, and buy-in from, numerous stakeholders, especially ART providers. We interviewed all providers engaged in a public health evaluation of DBS for VL monitoring in Malawi. We identified a complex set of interconnected provider-identified barriers and facilitators to VL monitoring that occurred at multiple levels.
Patients’ demand for VL testing reinforced the provider-perceived benefits of monitoring. Provider empowerment emerged as an unexpected facilitator. For many providers, the DBS study was the first time they used an objective marker of ART response to guide clinical management. Providers’ knowledge of a patient's virological status increased confidence in adherence counseling and clinical decision making. Emphasizing provider empowerment during VL scale-up activities may increase providers’ willingness to adopt additional responsibilities. Our results suggest that VL monitoring can modify provider behavior and should be presented as a tool to help providers improve the quality of HIV care they deliver to patients.
Despite reported benefits of VL monitoring, new clinician responsibilities are often met with uncertainty or resistance (Arnold et al., 2012; Krakower, Ware, Mitty, Maloney, & Mayer, 2014; Lester et al., 2010), particularly in inadequately staffed clinics. Human resource capacity among clinical health care workers is a key consideration in VL monitoring implementation in resource-limited settings(WHO, 2014). Task-shifting to lower-cadre health workers could redistribute current responsibilities, especially with non-phlebotomy-based specimen collection (i.e., fingerstick DBS cards) (Callaghan, et al., 2010; Pannus, et al., 2014; S. E. Rutstein, et al., 2014). Our results suggest task-shifting only for specimen collection will be insufficient as providers’ frustration with workload frequently focused on data management, patient counseling, and patient referral. Given the time constraints reported by providers, expanding provider-to-patient ratios at ART clinics, broadening the scope of practice, and training lower-cadre health workers may facilitate program sustainability.
To harmonize facility-, system-, and policy-level interactions (Figure 1, Figure 3) (WHO, 2014), shortcomings in data management systems need to be overcome. Lack of integration with centralized laboratory systems complicated the process for alerting providers when results were available; these communication gaps were exacerbated by poor internet connectivity. The delays in result availability frustrated providers and patients. These obstacles could be addressed by point-of-care VL technologies, but such devices are still years from meeting standards for widespread use (“Point-of-Care Implementation Guidelines: Directing Scale-up of Point-of-Care Testing for HIV-related Diagnostics in Malawi,” 2012; Reid, Fidler, & Cooke, 2013; Usdin, Guillerm, & Calmy, 2010; WHO). Improving coverage of mobile networks and increasing internet connectivity to outlying clinics will be critical to maintain reliable clinic-laboratory communication, and crucial for the success of the centralized VL monitoring model.
In contrast to centralized laboratories, decentralized drug distribution will be imperative for effective patient referral and initiation of second-line ART. For many patients, the cost and inconvenience of travelling to a central distribution point considerably delayed initiation of second-line therapy, especially because initiation on second-line drugs requires monthly clinic visits for at least six months(“Clinical Management of HIV In Children and Adults,” 2014). VL monitoring will likely increase the proportion of patients initiating second-line therapy(S. Rutstein, M. C. Hosseinipour, et al., 2014). Decentralized second-line ART distribution should be considered with any scale-up of VL monitoring, along with supply chain procedures to minimize stock-outs.
Another system-wide policy that discouraged patients and providers was the MOH's strict monitoring eligibility criteria (“Clinical Management of HIV In Children and Adults,” 2014). Patients craved information regarding their VL, and providers were frustrated as they were forced to ration testing based on restrictive policies. Many providers pleaded for expanded VL monitoring eligibility. Anticipating these frustrations, policymakers should design provider trainings and patient education materials explaining that the criteria were designed to optimize access to extremely limited VL monitoring opportunities for patients at highest risk of ART failure(“Clinical Management of HIV In Children and Adults,” 2014; WHO, 2013). Another option is “catch up” testing, where every patient on ART for greater than two years receives a single test, and then returns to the biannual eligibility. Extended unmonitored exposure to ART is associated with increased risk of virological failure, even in the absence of clinical symptoms (S. Rutstein, M. C. Hosseinipour, et al., 2014). A “catch up” approach might satisfy providers and patients and improve detection of virological failure.
Generalizability of the provider experience must be evaluated against the backdrop of the parent study. Perceptions of activities for a study may differ from standard clinical procedures, particularly regarding provider-perceived work burden. Although we restricted data collection responsibilities to mimic real-world implementation, completing study forms and procedures may have contributed to frustrations with workload. Furthermore, all study sites were ART clinics associated with district hospitals: providers staffing more remote health centers may encounter a different set of barriers to VL monitoring. ART patients at more isolated ART clinics may need to travel further to receive care, emphasizing the importance of decentralized distribution of second-line drugs.
We believe ours is the first study to investigate provider perceptions of implementing VL monitoring in resource-limited settings. We offer insights into the multi-level barriers to, and facilitators of, VL monitoring from providers who serve on the frontline of ART management. We observed demand from both patients and providers for more widespread and inclusive VL testing. The most salient provider-reported barrier to VL monitoring implementation was the workload associated with monitoring activities, taxing an overextended provider workforce. Provider empowerment from using laboratory results to focus adherence counseling and guide clinical management was a striking facilitator of VL monitoring. Our results are exploratory, but may help decision-makers design programs that anticipate provider-reported barriers and facilitators, helping to anticipate obstacles and take advantage of identified opportunities to improve feasibility and sustainability of VL scale-up.
Acknowledgements
We would like to thank the numerous ART patients and providers who made this research possible. In addition, we would like to thank Sayaka Hino (SH) for her contributions to transcript analysis, and Vivian Go for her thoughtful feedback on manuscript drafts.
Funding:
This work was funded by Centers for Disease Control and Prevention Public Health Evaluation under grant MW.10.1433; the UNC Center for AIDS Research (P30 AI50410); and SER was funded by F30 MH098731-01 and T32 GM008719.
References
- Anderson AM, Bartlett JA. Changing antiretroviral therapy in the setting of virologic relapse: review of the current literature. Curr HIV/AIDS Rep. 2006;3(2):79–85. doi: 10.1007/s11904-006-0022-1. [DOI] [PubMed] [Google Scholar]
- Arnold EA, Hazelton P, Lane T, Christopoulos KA, Galindo GR, Steward WT, Morin SF. A qualitative study of provider thoughts on implementing pre-exposure prophylaxis (PrEP) in clinical settings to prevent HIV infection. PLoS One. 2012;7(7):e40603. doi: 10.1371/journal.pone.0040603. [DOI] [PMC free article] [PubMed] [Google Scholar]
- Boeije H. A purposeful approach to the constant comparative method in the analysis of qualitative interviews. Quality & Quantity. 2002;36:391–409. [Google Scholar]
- Braun V, Clark V. Using thematic analysis in psychology. Qualitative Research in Psychology. 2006;3(2):77–101. [Google Scholar]
- Callaghan M, Ford N, Schneider H. A systematic review of task- shifting for HIV treatment and care in Africa. Hum Resour Health. 2010;8:8. doi: 10.1186/1478-4491-8-8. [DOI] [PMC free article] [PubMed] [Google Scholar]
- Calmy A, Ford N, Hirschel B, Reynolds SJ, Lynen L, Goemaere E, Rodriguez W. HIV viral load monitoring in resource-limited regions: optional or necessary? Clin Infect Dis. 2007;44(1):128–134. doi: 10.1086/510073. [DOI] [PubMed] [Google Scholar]
- Chaiwarith R, Wachirakaphan C, Kotarathititum W, Praparatanaphan J, Sirisanthana T, Supparatpinyo K. Sensitivity and specificity of using CD4+ measurement and clinical evaluation to determine antiretroviral treatment failure in Thailand. Int J Infect Dis. 2007;11(5):413–416. doi: 10.1016/j.ijid.2006.11.003. [DOI] [PubMed] [Google Scholar]
- Chan AK, Ford D, Namata H, Muzambi M, Nkhata MJ, Abongomera G, Gibb DM. The Lablite project: A cross-sectional mapping survey of decentralized HIV service provision in Malawi, Uganda and Zimbabwe. BMC Health Serv Res. 2014;14:352. doi: 10.1186/1472-6963-14-352. [DOI] [PMC free article] [PubMed] [Google Scholar]
- Clinical Management of HIV In Children and Adults . In: M. Ministry of Health, editor. Ministry of Health, Malawi; Lilongwe: 2014. [Google Scholar]
- Corbin J, Strauss A. Basics of Qualitative Research. 3rd ed. Sage Publications; Thousand Oaks: 2008. [Google Scholar]
- Friese S. Qualitative Data Analysis with ATLAS.ti. 2nd ed. SAGE Publications; Thousand Oaks, CA: 2014. [Google Scholar]
- Gsponer T, Petersen M, Egger M, Phiri S, Maathuis MH, Boulle A, Keiser O. The causal effect of switching to second-line ART in programmes without access to routine viral load monitoring. AIDS. 2012;26(1):57–65. doi: 10.1097/QAD.0b013e32834e1b5f. [DOI] [PMC free article] [PubMed] [Google Scholar]
- Hosseinipour MC, van Oosterhout JJ, Weigel R, Phiri S, Kamwendo D, Parkin N, Kumwenda J. The public health approach to identify antiretroviral therapy failure: high-level nucleoside reverse transcriptase inhibitor resistance among Malawians failing first-line antiretroviral therapy. AIDS. 2009;23(9):1127–1134. doi: 10.1097/QAD.0b013e32832ac34e. [DOI] [PMC free article] [PubMed] [Google Scholar]
- Integrated HIV Program Report July - September 2013. Government of Malawi Minsitry of Health; Lilongwe: 2013. [Google Scholar]
- Johannessen A. Dried blood spots in HIV monitoring: applications in resource-limited settings. Bioanalysis. 2010;2(11):1893–1908. doi: 10.4155/bio.10.120. [DOI] [PubMed] [Google Scholar]
- Johannessen A, Troseid M, Calmy A. Dried blood spots can expand access to virological monitoring of HIV treatment in resource-limited settings. J Antimicrob Chemother. 2009;64(6):1126–1129. doi: 10.1093/jac/dkp353. [DOI] [PubMed] [Google Scholar]
- Keiser O, Tweya H, Braitstein P, Dabis F, MacPhail P, Boulle A, Egger M. Mortality after failure of antiretroviral therapy in sub-Saharan Africa. Trop Med Int Health. 2010;15(2):251–258. doi: 10.1111/j.1365-3156.2009.02445.x. [DOI] [PMC free article] [PubMed] [Google Scholar]
- Krakower D, Ware N, Mitty JA, Maloney K, Mayer KH. HIV providers' perceived barriers and facilitators to implementing pre-exposure prophylaxis in care settings: a qualitative study. AIDS Behav. 2014;18(9):1712–1721. doi: 10.1007/s10461-014-0839-3. [DOI] [PMC free article] [PubMed] [Google Scholar]
- Kumarasamy N, Madhavan V, Venkatesh KK, Saravanan S, Kantor R, Balakrishnan P, Schooley R. High frequency of clinically significant mutations after first-line generic highly active antiretroviral therapy failure: implications for second-line options in resource-limited settings. Clin Infect Dis. 2009;49(2):306–309. doi: 10.1086/600044. [DOI] [PMC free article] [PubMed] [Google Scholar]
- Lester R, Hamilton R, Charalambous S, Dwadwa T, Chandler C, Churchyard GJ, Grant AD. Barriers to implementation of isoniazid preventive therapy in HIV clinics: a qualitative study. AIDS. 2010;24(Suppl 5):S45–48. doi: 10.1097/01.aids.0000391021.18284.12. [DOI] [PubMed] [Google Scholar]
- Lynen L, Van Griensven J, Elliott J. Monitoring for treatment failure in patients on first-line antiretroviral treatment in resource-constrained settings. Curr Opin HIV AIDS. 2010;5(1):1–5. doi: 10.1097/COH.0b013e3283333762. [DOI] [PubMed] [Google Scholar]
- Madec Y, Leroy S, Rey-Cuille MA, Huber F, Calmy A. Persistent difficulties in switching to second-line ART in sub-saharan Africa--a systematic review and meta- analysis. PLoS One. 2013;8(12):e82724. doi: 10.1371/journal.pone.0082724. [DOI] [PMC free article] [PubMed] [Google Scholar]
- Marconi VC, Sunpath H, Lu Z, Gordon M, Koranteng-Apeagyei K, Hampton J, Kuritzkes DR. Prevalence of HIV-1 drug resistance after failure of a first highly active antiretroviral therapy regimen in KwaZulu Natal, South Africa. Clin Infect Dis. 2008;46(10):1589–1597. doi: 10.1086/587109. [DOI] [PMC free article] [PubMed] [Google Scholar]
- Marshall MN. Sampling for qualitative research. Fam Pract. 1996;13(6):522–525. doi: 10.1093/fampra/13.6.522. [DOI] [PubMed] [Google Scholar]
- Mee P, Fielding KL, Charalambous S, Churchyard GJ, Grant AD. Evaluation of the WHO criteria for antiretroviral treatment failure among adults in South Africa. AIDS (London, England) 2008;22(15):1971–1977. doi: 10.1097/QAD.0b013e32830e4cd8. [DOI] [PubMed] [Google Scholar]
- Moore DM, Awor A, Downing R, Kaplan J, Montaner JS, Hancock J, Mermin J. CD4+ T-cell count monitoring does not accurately identify HIV-infected adults with virologic failure receiving antiretroviral therapy. J Acquir Immune Defic Syndr. 2008;49(5):477–484. doi: 10.1097/QAI.0b013e318186eb18. [DOI] [PubMed] [Google Scholar]
- Pannus P, Fajardo E, Metcalf C, Garone D, Jalon O, Nundwe S, Mwenda R. Task-shifting of dried blood spot (DBS) sample collection for viral load testing in Thyolo, Malawi: The role of Health Surveillance Assistants; Paper presented at the International AIDS Conference; Melbourne, Australia. 2014. [Google Scholar]
- Point-of-Care Implementation Guidelines: Directing Scale-up of Point-of-Care Testing for HIV- related Diagnostics in Malawi. Ministry of Health; Malawi: 2012. [Google Scholar]
- Pujades-Rodriguez M, O'Brien D, Humblet P, Calmy A. Second-line antiretroviral therapy in resource-limited settings: the experience of Medecins Sans Frontieres. AIDS. 2008;22(11):1305–1312. doi: 10.1097/QAD.0b013e3282fa75b9. [DOI] [PubMed] [Google Scholar]
- Rawizza HE, Chaplin B, Meloni ST, Eisen G, Rao T, Sankale JL, Kanki PJ. Immunologic criteria are poor predictors of virologic outcome: implications for HIV treatment monitoring in resource-limited settings. Clin Infect Dis. 2011;53(12):1283–1290. doi: 10.1093/cid/cir729. [DOI] [PMC free article] [PubMed] [Google Scholar]
- Reid SD, Fidler SJ, Cooke GS. Tracking the progress of HIV: the impact of point-of-care tests on antiretroviral therapy. Clin Epidemiol. 2013;5:387–396. doi: 10.2147/CLEP.S37069. [DOI] [PMC free article] [PubMed] [Google Scholar]
- Rewari BB, Bachani D, Rajasekaran S, Deshpande A, Chan PL, Srikantiah P. Evaluating patients for second-line antiretroviral therapy in India: the role of targeted viral load testing. J Acquir Immune Defic Syndr. 2010;55(5):610–614. doi: 10.1097/QAI.0b013e3181f43a31. [DOI] [PubMed] [Google Scholar]
- Reynolds SJ, Kityo C, Mbamanya F, Dewar R, Ssali F, Quinn TC, Dybul M. Evolution of drug resistance after virological failure of a first-line highly active antiretroviral therapy regimen in Uganda. Antivir Ther. 2009;14(2):293–297. doi: 10.1177/135965350901400211. [DOI] [PMC free article] [PubMed] [Google Scholar]
- Reynolds SJ, Nakigozi G, Newell K, Ndyanabo A, Galiwongo R, Boaz I, Serwadda D. Failure of immunologic criteria to appropriately identify antiretroviral treatment failure in Uganda. AIDS (London, England) 2009;23(6):697–700. doi: 10.1097/QAD.0b013e3283262a78. [DOI] [PMC free article] [PubMed] [Google Scholar]
- Roberts T, Bygrave H, Fajardo E, Ford N. Challenges and opportunities for the implementation of virological testing in resource-limited settings. J Int AIDS Soc. 2012;15(2):17324. doi: 10.7448/IAS.15.2.17324. [DOI] [PMC free article] [PubMed] [Google Scholar]
- Rutstein S, Hosseinipour MC, Soko A, Mkandawire M, Stein E, Mclendon C, Mataya R. Oct 8-12). Low rates of virologic failure among previously unmonitored patients in Malawi.. Paper presented at the IDWeek; Philadelphia, PA.. 2014. [Google Scholar]
- Rutstein S, Kamwendo D, Hosseinipour MC, Soko A, Sarr A, Gupta S, Mataya R. Implementing virologic monitoring using dried bloods spots at district hospitals in Malawi: challenges and opportunities.. Paper presented at the AIDS 2014; Melbourne, Australia. Jul 20-25, 2014. [Google Scholar]
- Rutstein SE, Hosseinipour MC, Kamwendo D, Soko A, Mkandawire M, Biddle AK, Mataya R. Dried blood spots for viral load monitoring in Malawi: feasible and effective. PLoS One. 2015;10(4):e0124748. doi: 10.1371/journal.pone.0124748. [DOI] [PMC free article] [PubMed] [Google Scholar]
- Rutstein SE, Kamwendo D, Lugali L, Thengolose I, Tegha G, Fiscus SA, Mataya R. Measures of viral load using Abbott RealTime HIV-1 Assay on venous and fingerstick dried blood spots from provider-collected specimens in Malawian District Hospitals. J Clin Virol. 2014 doi: 10.1016/j.jcv.2014.05.005. [DOI] [PMC free article] [PubMed] [Google Scholar]
- Saldana J. The Coding Manual for Qualitative Researchers. 3rd ed. Sage Publishing; Thousand Oaks: 2013. [Google Scholar]
- Sigaloff KC, Hamers RL, Wallis CL, Kityo C, Siwale M, Ive P, de Wit TF. Unnecessary antiretroviral treatment switches and accumulation of HIV resistance mutations; two arguments for viral load monitoring in Africa. J Acquir Immune Defic Syndr. 2011;58(1):23–31. doi: 10.1097/QAI.0b013e318227fc34. [DOI] [PubMed] [Google Scholar]
- UNAIDS. Access to Antireretroviral Therapy in Africa: Status report on progress towards the 2015 targets. UNAIDS; Geneva, Switzerland: 2013. [Google Scholar]
- Usdin M, Guillerm M, Calmy A. Patient needs and point-of-care requirements for HIV load testing in resource-limited settings. J Infect Dis. 2010;201(Suppl 1):S73–77. doi: 10.1086/650384. [DOI] [PubMed] [Google Scholar]
- van Oosterhout JJ, Brown L, Weigel R, Kumwenda JJ, Mzinganjira D, Saukila N, Hosseinipour MC. Diagnosis of antiretroviral therapy failure in Malawi: poor performance of clinical and immunological WHO criteria. Tropical medicine & international health : TM & IH. 2009;14(8):856–861. doi: 10.1111/j.1365-3156.2009.02309.x. [DOI] [PubMed] [Google Scholar]
- WHO Sexually Transmitted Diseases Diagnostics Initiative WHO Special Program for Research and Training in Tropical Diseases [Google Scholar]
- WHO. Consolidated guidelines on the use of antiretroviral drugs for treating and preventing HIV infection. WHO; Geneva, Switzerland: 2013. [PubMed] [Google Scholar]
- WHO . Technical and Operational Considerations for Implementing HIV Viral Load Testing. WHO; Geneva: 2014. [Google Scholar]
- Yin RK. Qualitative Research from Start to Finish. The Guilford Press; New York: 2011. [Google Scholar]