Abstract
This paper provides a report on the state-of-the-art in the prediction of intra-molecular residue-residue contacts in proteins based on the assessment of the predictions submitted to the CASP11 experiment. The assessment emphasis is placed on the accuracy in predicting long-range contacts.
Twenty-nine groups participated in contact prediction in CASP11. At least eight of them used the recently developed evolutionary coupling techniques, with the top group (CONSIP2) reaching precision of 27% on target proteins that could not be modeled by homology. This result indicates a breakthrough in the development of methods based on the correlated mutation approach. Successful prediction of contacts was shown to be practically helpful in modeling three-dimensional structures; in particular target T0806 was modeled exceedingly well with accuracy not yet seen for ab initio targets of this size (>250 residues).
Keywords: CASP, contact prediction, correlated mutations, co-variation, evolutionary coupling
INTRODUCTION
Contact prediction has been a focus area in CASP since 19961–9. Much of the research in this area originates from the co-evolution hypothesis suggesting that pairs of residues mutating in a coordinated manner are likely to be in contact. Already in 1994, about the time CASP started, the first papers exploring the possibility of predicting contacts from evolutionary information were published10,11, but for almost two decades the results were rather disappointing, typically with over 80% false positives9. A revival of interest in contact prediction came with a realization that earlier methods were methodologically flawed by not distinguishing direct sequence covariance signals from indirect effects12. Once this shortcoming was recognized, a number of groups developed improved approaches12–28.
Unfortunately, none of the new evolutionary coupling approaches made a mark in the previous round of CASP held in 2012. In 2014, though, the situation changed and some new co-variation techniques achieved quite spectacular results. This came as a surprise to many, as in CASP11, similarly to CASP10, no targets with particularly deep sequence alignments were available.
Here we analyze the results obtained by all contact predictors participating in CASP11, and quantify progress in the area by comparing the results with those obtained in the most recent CASP experiments.
MATERIALS AND METHODS
The definitions, formats and procedures in CASP11 did not change significantly since the previous experiment and therefore we provide here only the basic information, encouraging readers to refer to our CASP10 assessment paper9 for more detailed explanations.
Participants were requested to predict contacts in target proteins and assign to each contact a probability score p [0;1] reflecting confidence of the assignment. A pair of residues is defined to be in contact when the distance between their Cβ atoms (Cα in case of glycine) is smaller than 8.0 Å.
The main evaluation was carried out on the free modeling (FM) target domains, for which structural templates could not be identified even by a-posteriori structure similarity search. Some of the analyses were also performed on the extended (FM+TBM_hard) target set, which additionally included the TBM_hard domains, for which templates did exist but were relatively difficult to identify29. In CASP11, the FM set included 45 domains, and the extended FM+TBM_hard set additionally included 10 domains (see the CASP11 domain definition paper in this issue30). The complete list of CASP11 domains with their classifications is available at http:/predictioncenter.org/casp11/domains_summary.cgi.
We concentrated our assessment on the long-range contacts (separation of the interacting residues of at least 24 positions along the sequence) as these are the most valuable for structure prediction. Five CASP11 FM domains – T0775-D1, T0775-D3, T0775-D6, T0799-D2 and T0804-D1 (all parts of non-globular bacteriophage proteins) – had no long-range contacts and were therefore excluded from the analysis, leaving 40 domains for the assessment. Some statistics on CASP11 FM targets, including their length, number of long-range contacts and difficulty for contact prediction are provided in Figure S1 of Supplementary Material.
To ensure fairness of the comparison, all participating groups should be evaluated on the same number of contacts. To achieve this, we employed two different approaches. In the first approach, the lists of predicted contacts were truncated to the same number of contacts (e.g. to L/5 contacts per target, where L is the length of the domain); in the second, these lists were “padded” with zero-probabilities for pairs of residues that were not predicted as being in contact. We call the datasets used in the first approach “reduced lists” (RL), and those in the second - “full lists” (FL).
As far as the RL evaluation is concerned, this paper mainly discusses the results on the L/5 long-range contact lists. The results for the two shorter lists (L/10 and Top5), as well as for other contact ranges (e.g., medium range contacts or long+medium range contacts) are available on the web31 (http:/predictioncenter.org/casp11/rr_results.cgi).
The CASP11 assessment addresses the following questions: (1) how good are methods in identifying the most reliable predicted contacts (using the RL analysis), (2) how accurate are the methods in predicting contacts with the highest reliability (RL), and (3) how accurate are all submitted contact predictions, including those predicted with lower reliability (FL).
In the RL analysis, the two main evaluation measures are9
For the calculation of precision, the true positives (TP) and false positives (FP) values are the numbers of correctly and incorrectly predicted contacts regardless of the associated probabilities. To calculate the Xd score, we first filter all residue pairs in the target and in the prediction according to the sequence separation threshold for the analyzed type of contact (e.g., for the long-range contact analysis, we discard all pairs with the separation along the sequence shorter than 24 residues). We then compartmentalize all the qualified residue pairs in the target and, separately, all qualified contacts in the prediction into 15 bins based on the inter-residue spatial distance. The bins are numbered from 1 to 15 and include ranges of distances incremented by 4 Å, i.e. bin No. 1 contains pairs of residues separated by 0–4 Å in space, bin No. 2 – 4–8Å, …, bin No. 15 – 56–60Å. The upper limit of 60Å allows to accommodate the vast majority of distances in monomeric PDB proteins32*. Pai and Ppi are the percentages of pairs included in the ith bin for the whole target and predicted contacts, respectively. The Xd measure quantifies how different the distributions of inter-residue distances are in the target structure and the predicted contacts, with values greater than zero indicating a higher proportion of shorter distances among the predicted contacts, as it is naturally expected from an effective method.
In the FL analysis, the main estimators of binary classifiers are the Matthews correlation coefficient
and the area under the precision-recall curve (AUC_PR). The threshold for separating contacts from non-contacts is selected at the p=0.5 level, thus a contact was considered as correctly predicted (TP) if it was included in the prediction with a probability of 0.5 or higher.
The precision, Xd and MCC scores for each group were calculated on a per-target basis and subsequently averaged. The AUC_PR score was calculated on the dataset containing contacts from all targets pulled together. The groups were ranked according to the cumulative z-scores from these four evaluation measures. For each measure, the z-scores were calculated in accordance with the procedure for calculating the corresponding raw scores, i.e. on the per-target basis for the precision, Xd and MCC, and on all targets together for the AUC_PR. After the initial computation, the z-scores were recalculated on the outlier-free datasets, with outliers defined as those with a score lower than the mean minus two standard deviations. For the per-target measures, these adjusted z-scores were averaged over all domains predicted by the group. Finally, before adding the z-scores from different measures, all negative z-scores were set to zero in order not to penalize too severely groups underperforming with respect to some of the scores†.
To establish the significance of the differences between the scores for best groups, we performed t-tests and “head-to-head” comparisons9 on the per-target measures (i.e., precision, Xd and MCC) and bootstrapping tests on all measures33. For the bootstrapping, we randomly sampled (with replacement) the list of targets predicted by each group, and re-calculated the evaluation scores on the resampled target sets. The 95% confidence intervals were established using the two-tailed bootstrap percentile method34 on 1000 resampling trials. The statistical significance of the differences in group performance was inferred based on the comparison of the corresponding confidence intervals35.
RESULTS
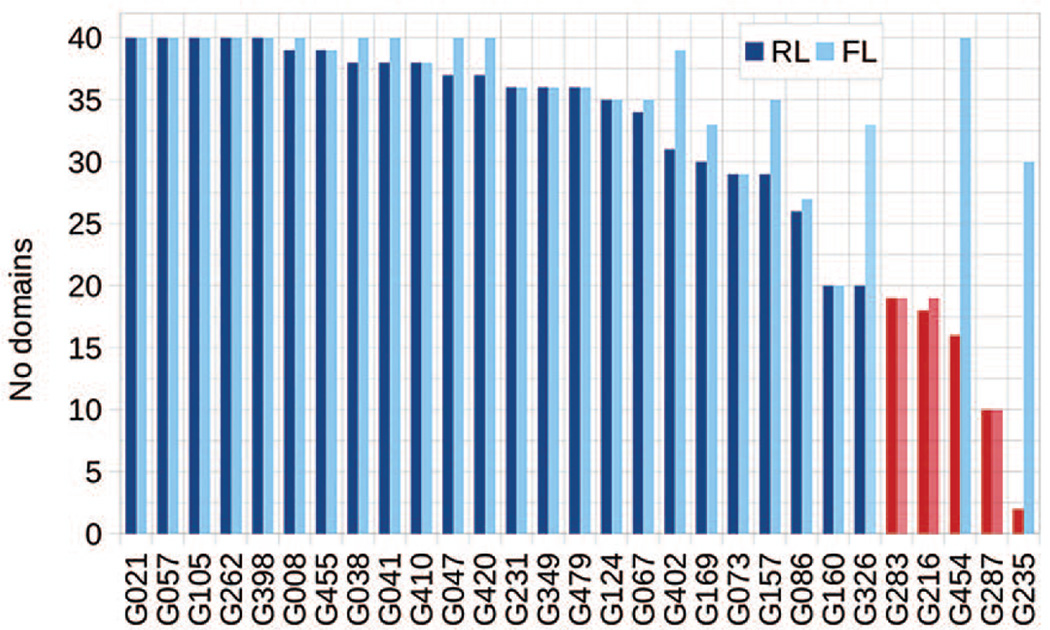
Twenty-nine groups participated in the prediction of intra-molecular contacts in CASP11. Figure 1 shows the numbers of evaluated domains for each participating group. Only groups that submitted qualified predictions for at least half of the 40 evaluated domains were included in the analysis. Thus, we evaluated 26 groups in the FL mode and 24 groups in the RL mode. The list of the evaluated groups in the RL mode is shorter because two groups failed to submit at least L/5 long-range contacts on at least 20 FM domains. Groups not evaluated are marked in red in the figure.
Figure 1.
The number of FM domains per group for which the L/5 lists (darker color) and full lists (lighter color) of long-range contacts were evaluated. Several groups (G235, G287, G454, G216 and G283 in the RL mode; G287, G216 and G283 in the FL mode – marked red) submitted too few qualified predictions and were not included in the subsequent analyses. The correspondence between groups’ CASP IDs (Gxxx in the graph’s x-axis) and their names can be obtained from http://predictioncenter.org/casp11/docs.cgi?view=groupsbyname.
According to method descriptions in the CASP11 Abstract book (http://predictioncenter.org/casp11/doc/CASP11_Abstracts.pdf) at least eight groups - CONSIP2 (MetaPSICOV method20), Shen-group, RaptorX-contact, ICOS, CNIO, Pcons-net, myprotein-me and IASL-COPE - used recently developed coevolution-based methods in their approaches, while others tested sophisticated machine learning-based techniques. Table I presents a brief overview of the contact prediction methods participating in CASP11.
Table I.
Brief description of the methods participating in CASP11.
| CNIO* | G067 | Combination of five co-evolution-based methods, including PSICOV18, plmDCA22, PconsC24 and two in-house developed methods. |
| CONSIP2* (MetaPSICOV34) | G021 | A neural network method incorporating models of three predictors inferring co-evolution signal from MSA (PSICOV18, GREMLIN20 and DCA/FreeContact27). |
| Distill | G349 | 2D-Recursive Neural Networks for predicting contact maps. |
| FLOUDAS_A1, _A2, _A3 | G157, G326, G235 | A family of methods based on the consensus of contacts in templates. Particular • • • • • • • • • • • • • • • • • • • •-sheet topology. |
| FoDTcm | G283 | A method combining decision tree classifiers. The feature vector includes local and global context information. |
| IASL-COPE* | G402 | A co-evolution-based method built on a Random Forests machine-learning technique for partial MSA. |
| ICOS* | G455 | A machine-learning method using local information from sequences around specific residues, segments connecting the residues, and correlated mutations. |
| MLiD | G105 | Deep Networks trained with dropout technique. For every residue pair the information is extracted from two 15-residue windows. |
| MULTICOM-cluster (DNcon35) | G420 | A deep networks method empowered by GPUs and CUDA parallel computing. Uses pair-wise potentials, local sequence features and information from segments connecting the contacting residues |
| MULTICOM-construct (SVMcon) | G008 | An SVM method incorporating 5 categories of features: local window, pairwise information, residue type, central segment window, and protein information. |
| MULTICOM-novel (NNcon36) | G041 | A 2D-Recursive Neural Network method for general contact prediction and prediction of inter-strand contacts in beta sheets. |
| myprotein-me* (gplmDCA26) | G216 | A gap-enhanced pseudo maximum-likelihood direct contact analysis method using jackHMMer38 MSAs. |
| Pcons-net* (PconsC225) | G410 | A deep learning approach combining PSICOV18 and plmDCA22 predictions built on 8 different HHblits37 and jackHMMer38 alignments. |
| raghavagps-paaint | G047 | Extracts residue-residue contacts from in-house 3D protein structure prediction. The TS method is based on the prediction of dihedral angles. |
| RaptorX-Contact* (PhyCMAP39) | G057 | An approach integrating evolutionary and physical constraints using machine learning (Random Forests) and integer linear programming. |
| RBO_Aleph40, RBO-Human | G479, G287 | A machine learning method that uses graph-based features of contact physicochemical environment (without the need for deep sequence alignments). |
| SAM-T08-server, SAM-T06-server | G073, G086 | Neural networks and information about correlated mutations in the MSAs, and distance constraints extracted from best alignments. |
| Shen-Group* | G124 | Combination of a co-evolution approach (inversion of the sample covariance matrix) with learning-based approaches (five SVM classifiers). |
New methods that use correlated mutations approaches
Similarity of the predicted contact sets
Methods that rely on similar mathematical approaches and protein features may predict similar sets of contacts and, subsequently, obtain similar evaluation scores. It may also happen that similar evaluation scores are assigned to conceptually different methods that predict different sets of contacts. To differentiate between these two scenarios and help identify methods providing potentially complementary information we performed the analysis described below.
To check how often different CASP11 methods predict the same top contacts, we calculated the pair-wise Jaccard distance (J-score42) for each pair of methods. The J-score ranges from 0 if a pair of methods generates identical contacts to 1 if methods produce non-overlapping sets of contacts.
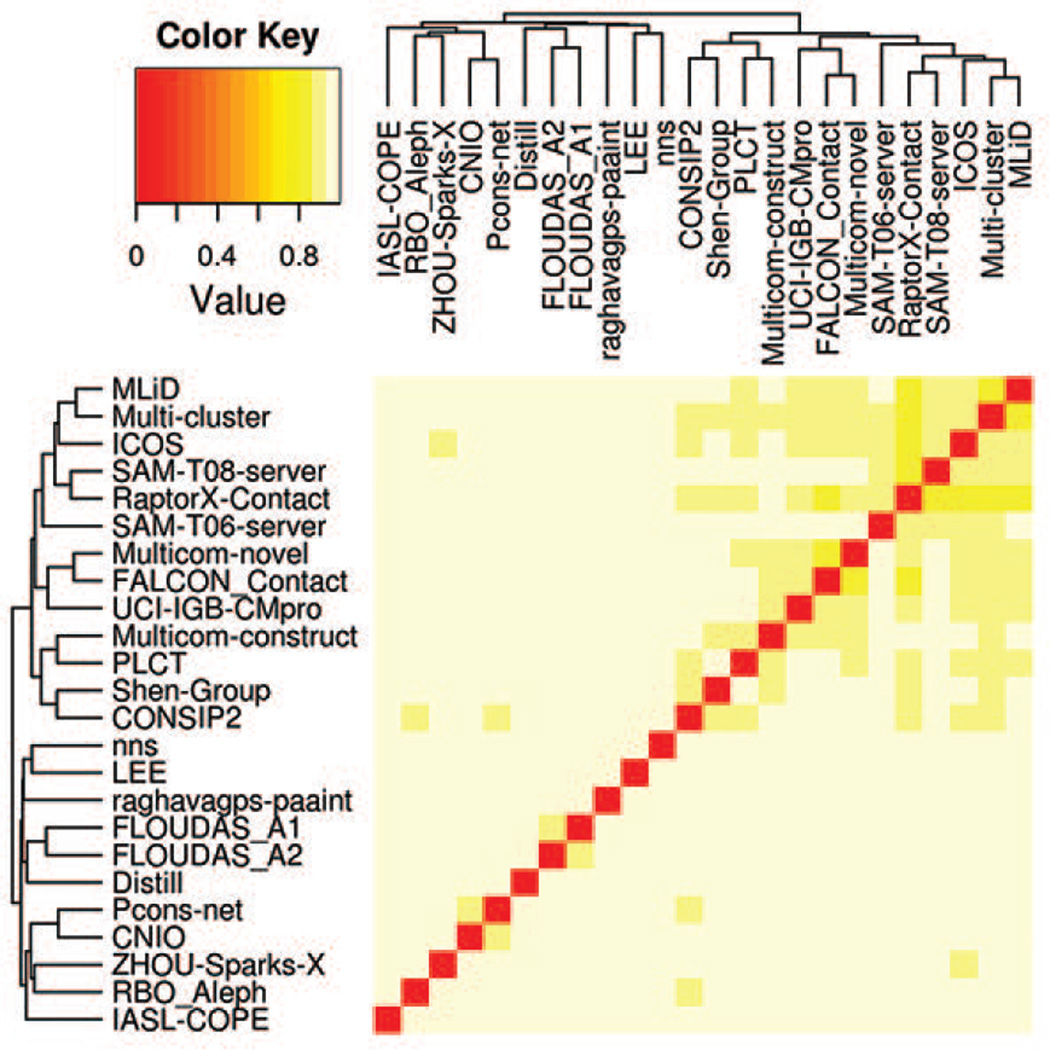
Figure 2 shows a color-coded matrix of J-scores calculated on the union of the predicted top L/5 long-range contacts for each pair of groups. It can be seen that all scores in the matrix are above 0.8 thus indicating that there were no overwhelmingly similar methods in CASP11. The high level of dissimilarity between different groups follows from the fact that almost 3/4 of the top predicted contact pairs are predicted by a single group. Nevertheless, the dendrogram associated with the J-score matrix shows the existence of at least one cluster of 13 methods (MLiD down to CONSIP2) where methods demonstrate a higher level of similarity between themselves than to other techniques. This cluster encompasses four of the eight evolutionary coupling methods (CONSIP2, Shen-group, RaptorX-contact and ICOS). Figure S2 in Supplementary Material shows similar data calculated on predicted true contacts only, and identifies an additional smaller cluster of somewhat similar groups (CNIO, Pcons-net, and so forth). This cluster is not present in the main Figure 2 as only less than 10% of predictions used for the generation of this figure are true contacts; the similarity that is apparent in Figure S2 could be revealed only by looking deeper into the lists of predicted contacts.
Figure 2.
A color-coded dissimilarity matrix and a dendrogram illustrating the similarity among different methods as judged by the number of common predicted contacts for all targets. The J-scores used in the matrix are calculated on the union of the predicted top L/5 long-range contacts for each pair of groups.
RL assessment
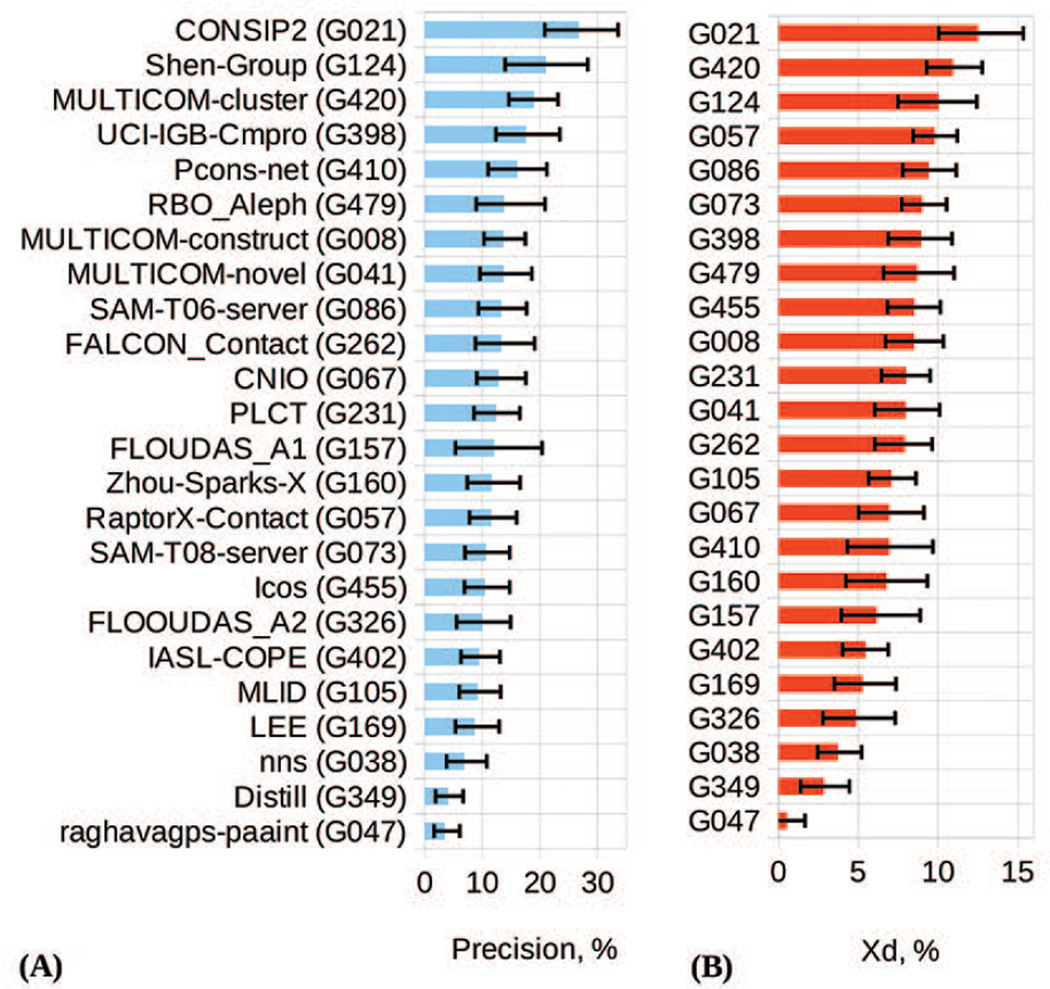
Results of the assessment on the reduced lists (L/5 top long-range contacts) are presented in Figure 3. The graphs show that the CONSIP2 group (G021) outscores all the other groups according to both the precision (panel A) and Xd (panel B) measures. On the FM domains, CONSIP2 reaches an average precision of 27% and Xd of 12.5, while the runners-up only reach a level of 21% and 10.9, respectively. In 14 out of 40 cases, the CONSIP2’s precision exceeded 30%, and in 11 cases - 40%. On the other hand, even for this best group, the contact prediction is not very satisfactory (precision below 20%) on half of the targets, indicating that much more work is required to improve the consistency and accuracy of contact prediction in general. On the FM+TBM_hard domains, the CONSIP2 reaches an average precision of 31% (Figure S3, Supplementary Material), while the next group attains only 24%. It is worth mentioning that the group that follows CONSIP2 in the RL rankings, the Shen-group (G124), also used evolutionary coupling information. Error bars in Figure 3 illustrate the 95% confidence intervals obtained from the bootstrapping tests (see Materials). Their comparison shows that, for example, the precision-based confidence interval for CONSIP2 significantly overlaps with that of only one group – the Shen-group – and only slightly overlaps with those of other groups, thus confirming the better performance of the CONSIP2 group.
Figure 3.
Precision (panel A) and Xd score (panel B) for the participating groups on the FM domains. The data are shown for the top L/5 long-range contacts (a.k.a. reduced lists). Groups in both panels are ordered according to the decreasing score. The error bars indicate the boundaries of the 95% confidence intervals for each measure.
To estimate the statistical significance of the differences in the performance of the best CASP11 methods in more detail, we applied the t-tests and head-to-head tests for the top 12 groups. Tables II and III show the results of the comparisons according to the precision score, whereas Tables S1 and S2 (Supplementary material) - according to the Xd score. The t-tests suggest that the top-ranked group G021 performs significantly better than all other groups but G124 (on both precision and Xd) and G420 (on Xd). The head-to-head comparisons highlight the CONSIP2’s superiority over all groups (more than 50% wins) according to both evaluation measures.
Table II.
Results of the paired two-tailed Student's tests for top 12 CASP11 contact predictors according to the precision score on the FM set.
| G021 | G124 | G420 | G398 | G410 | G479 | G008 | G041 | G086 | G262 | G067 | G231 | |
|---|---|---|---|---|---|---|---|---|---|---|---|---|
| G021 | - | 35 | 37 | 40 | 38 | 36 | 39 | 38 | 26 | 40 | 34 | 36 |
| G124 | 0.143 | - | 32 | 35 | 33 | 33 | 34 | 33 | 22 | 35 | 34 | 33 |
| G420 | 0.010 | 0.133 | - | 37 | 36 | 33 | 36 | 35 | 26 | 37 | 31 | 35 |
| G398 | 0.002 | 0.274 | 0.720 | - | 38 | 36 | 39 | 38 | 26 | 40 | 34 | 36 |
| G410 | <0.001 | 0.015 | 0.323 | 0.482 | - | 34 | 37 | 36 | 25 | 38 | 32 | 35 |
| G479 | 0.003 | 0.022 | 0.332 | 0.306 | 0.848 | - | 35 | 34 | 22 | 36 | 32 | 32 |
| G008 | <0.001 | 0.012 | 0.011 | 0.113 | 0.316 | 0.721 | - | 37 | 26 | 39 | 33 | 35 |
| G041 | <0.001 | 0.001 | 0.010 | 0.119 | 0.416 | 0.797 | 0.918 | - | 25 | 38 | 32 | 34 |
| G086 | <0.001 | 0.004 | 0.004 | 0.198 | 0.449 | 0.850 | 0.490 | 0.949 | - | 26 | 22 | 24 |
| G262 | <0.001 | 0.010 | 0.056 | 0.138 | 0.439 | 0.873 | 0.985 | 0.461 | 0.408 | - | 34 | 36 |
| G067 | <0.001 | 0.016 | 0.264 | 0.272 | 0.759 | 0.507 | 0.738 | 0.284 | 0.553 | 0.841 | - | 32 |
| G231 | <0.001 | 0.009 | 0.014 | 0.029 | 0.234 | 0.672 | 0.515 | 0.682 | 0.911 | 0.533 | 0.641 | - |
The below the diagonal part of the table displays the t-test probability p that the observed differences in the results are due to chance. The above the diagonal part of the table shows the numbers of common domains (out of 40 max in the RL analysis). Cells corresponding to the statistically similar pairs of groups at the confidence level of 95% (p>0.05) are shaded grey.
Table III.
Head-to-head comparisons of the top 12 groups according to the precision score on the FM domain set.
| G021 | G124 | G420 | G398 | G410 | G479 | G008 | G041 | G086 | G262 | G067 | G231 | |
|---|---|---|---|---|---|---|---|---|---|---|---|---|
| G021 | - | 54.29% | 54.05% | 60.00% | 81.58% | 69.44% | 79.49% | 73.68% | 73.08% | 75.00% | 67.65% | 77.78% |
| G124 | 25.71% | - | 46.88% | 51.43% | 63.64% | 57.58% | 55.88% | 63.64% | 68.18% | 60.00% | 58.82% | 63.64% |
| G420 | 35.14% | 40.63% | - | 51.35% | 55.56% | 54.55% | 63.89% | 60.00% | 65.38% | 62.16% | 61.29% | 68.57% |
| G398 | 20.00% | 31.43% | 37.84% | - | 42.11% | 55.56% | 48.72% | 50.00% | 53.85% | 55.00% | 50.00% | 55.56% |
| G410 | 15.79% | 21.21% | 33.33% | 39.47% | - | 41.18% | 54.05% | 41.67% | 36.00% | 47.37% | 34.38% | 48.57% |
| G479 | 16.67% | 39.39% | 27.27% | 33.33% | 41.18% | - | 54.29% | 47.06% | 31.82% | 47.22% | 34.38% | 56.25% |
| G008 | 12.82% | 29.41% | 22.22% | 38.46% | 35.14% | 37.14% | - | 43.24% | 42.31% | 41.03% | 42.42% | 45.71% |
| G041 | 10.53% | 15.15% | 25.71% | 23.68% | 41.67% | 32.35% | 43.24% | - | 40.00% | 42.11% | 31.25% | 38.24% |
| G086 | 11.54% | 22.73% | 30.77% | 38.46% | 48.00% | 40.91% | 50.00% | 48.00% | - | 50.00% | 45.45% | 54.17% |
| G262 | 20.00% | 20.00% | 24.32% | 25.00% | 31.58% | 36.11% | 35.90% | 28.95% | 42.31% | - | 26.47% | 47.22% |
| G067 | 11.76% | 29.41% | 29.03% | 35.29% | 34.38% | 46.88% | 48.48% | 43.75% | 40.91% | 52.94% | - | 56.25% |
| G231 | 11.11% | 30.30% | 20.00% | 30.56% | 34.29% | 31.25% | 31.43% | 38.24% | 37.50% | 33.33% | 34.38% | - |
Each cell displays the percentage of common domains for which a group in the row has a higher score than the group in the column. Numbers for the same pair of groups on both sides of the diagonal may not add to 100% as ties are not counted.
FL assessment
Figures 4 and 5 provide a different perspective on methods’ performance based on the analysis of the full, non-truncated lists of submitted contacts.
Figure 4.
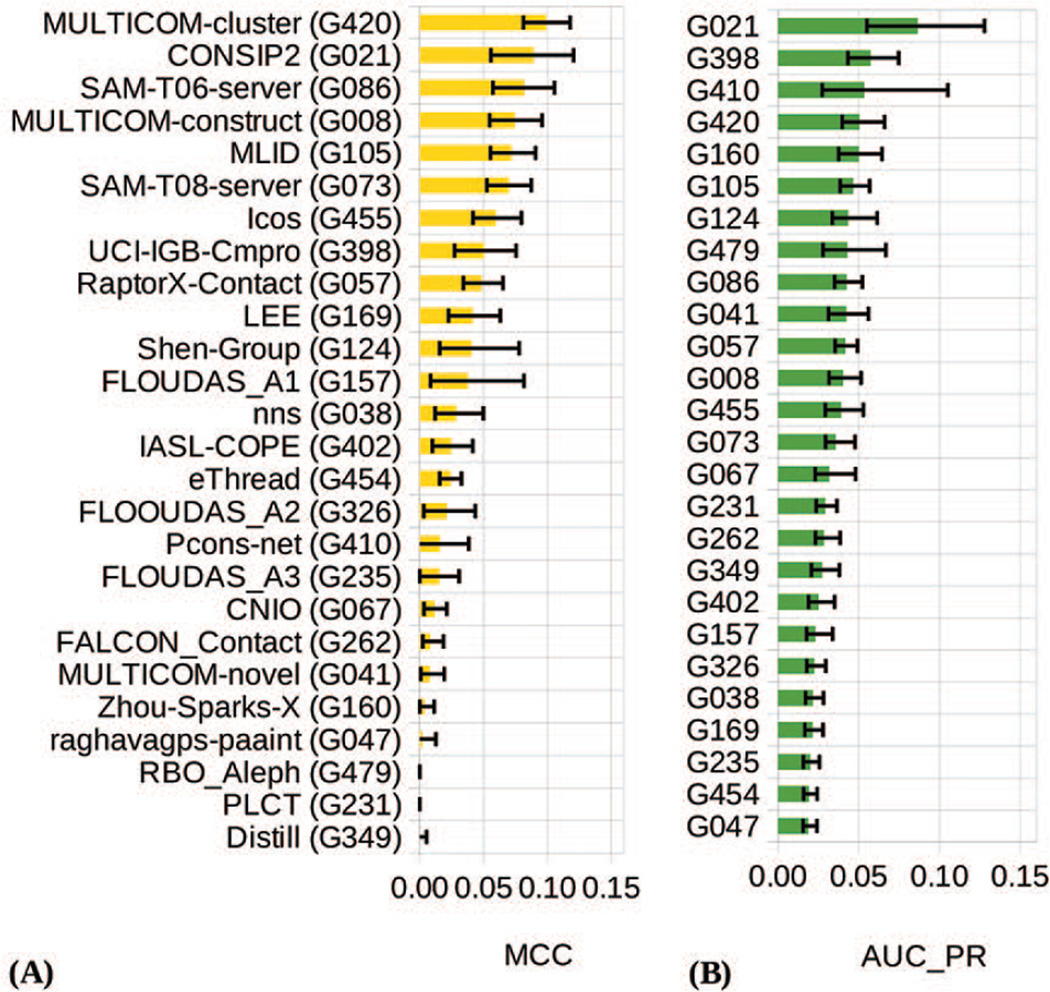
Matthews’ correlation coefficient (panel A) and area under the precision-recall curve (panel B) for the participating groups on the FM domains. The data are shown for all predicted long-range contacts (a.k.a. full lists). Groups in both panels are ordered according to the decreasing score. The error bars indicate boundaries of the 95% confidence intervals for each measure.
Figure 5.
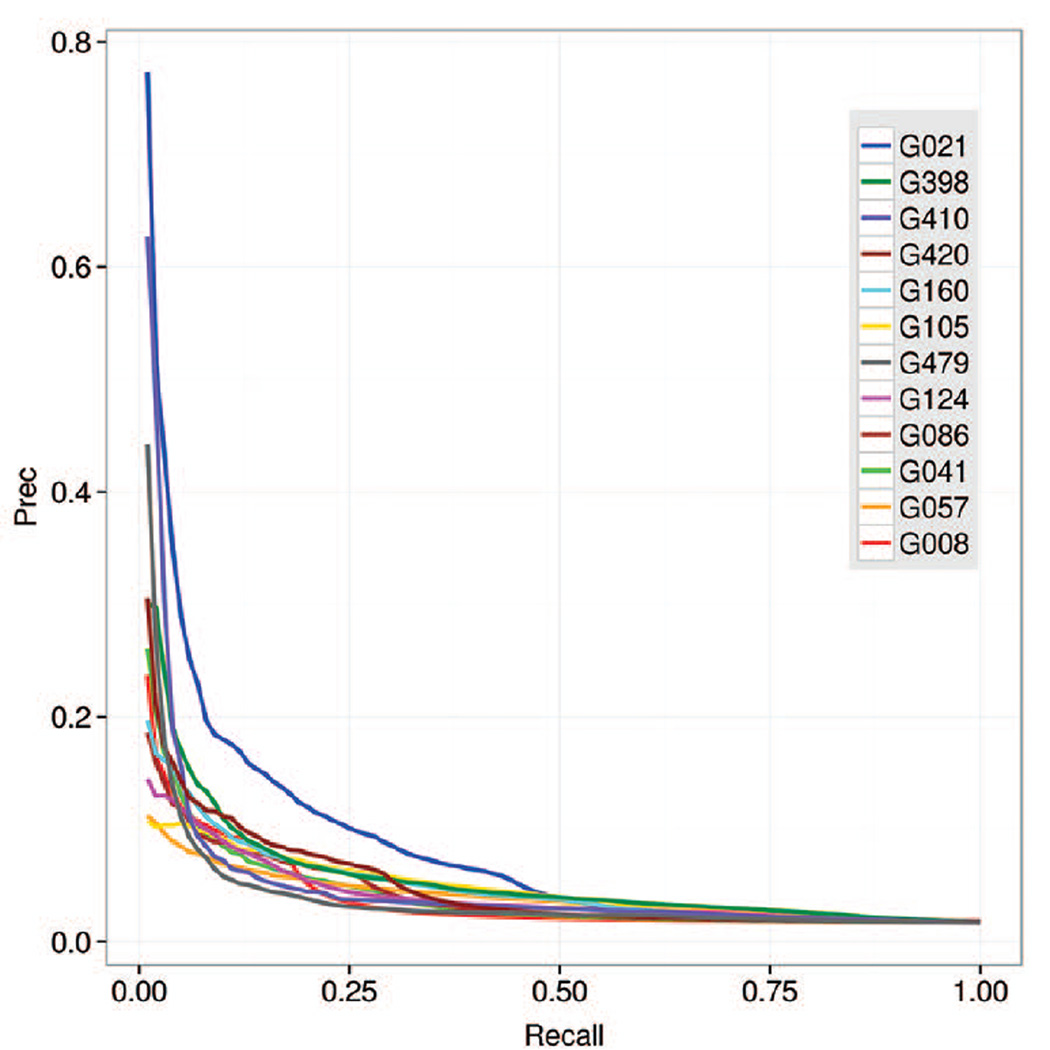
Precision-recall curves for all predicted long-range contacts on FM domains.
The MCC analysis shows the efficiency of methods in assigning probabilities above 0.5 to the correctly predicted contacts. In this analysis, the leading role is played by the Multicom-cluster group, followed by the CONSIP2 group (Figure 4A). It should be mentioned that absolute MCC values for all groups are quite low mainly due to the imbalanced nature of the dataset containing just a small fraction of contacts among all possible pairs of residues and a low ratio of true positives (correctly predicted contacts) to false negatives (non-predicted contacts). Specifics of the prediction (and evaluation) procedures apparently contribute to this result as contact prediction methods in CASP are not expected to identify all contacts in the proteins, but rather to identify those pairs of residues that are believed to be in contact with high probability.
The PR-curve analysis tests the ability of predictors to correctly rank the predicted contacts, and clearly identifies CONSIP2 (G021) as the top performing group with an AUC_PR score of 0.086 (Fig 4B). The next three groups in the ranking show considerably lower AUC scores (in the 0.050–0.057 range). The shape of the PR curve for CONSIP2 (Figure 5) indicates that this group is particularly successful in assigning high confidence scores to the correct contacts (i.e., it has a higher fraction of correct contacts among those predicted with high confidence). For all groups, the high percentage of wrongly predicted contacts among those predicted with high probability causes sharp drop of the curves in the recall-precision coordinates and, subsequently, low values of the area under the curve.
Statistical significance of the differences in performance of the best groups in the FL analyses is estimated by comparing their 95% confidence intervals (shown as error bars in Figure 4, both for the MCC and AUC_PR), and additionally verified with t-tests and head-to-head comparisons on the MCC- based results. As the confidence intervals overlap for a considerable number of participants (including the top performing groups), their comparison does not allow reliable conclusions to be derived at the selected level of statistical significance. The results of the t-tests on the MCC scores are clearer and suggest that the Multicom-cluster group is indistinguishable from CONSIP2 (G021) and SAM-T06-server (G086), and significantly better than all the others (Table S3 in Supplementary Material). The leading group also won the majority of per-target head-to-head MCC comparisons with other groups (see Table S4 in Supplementary Material).
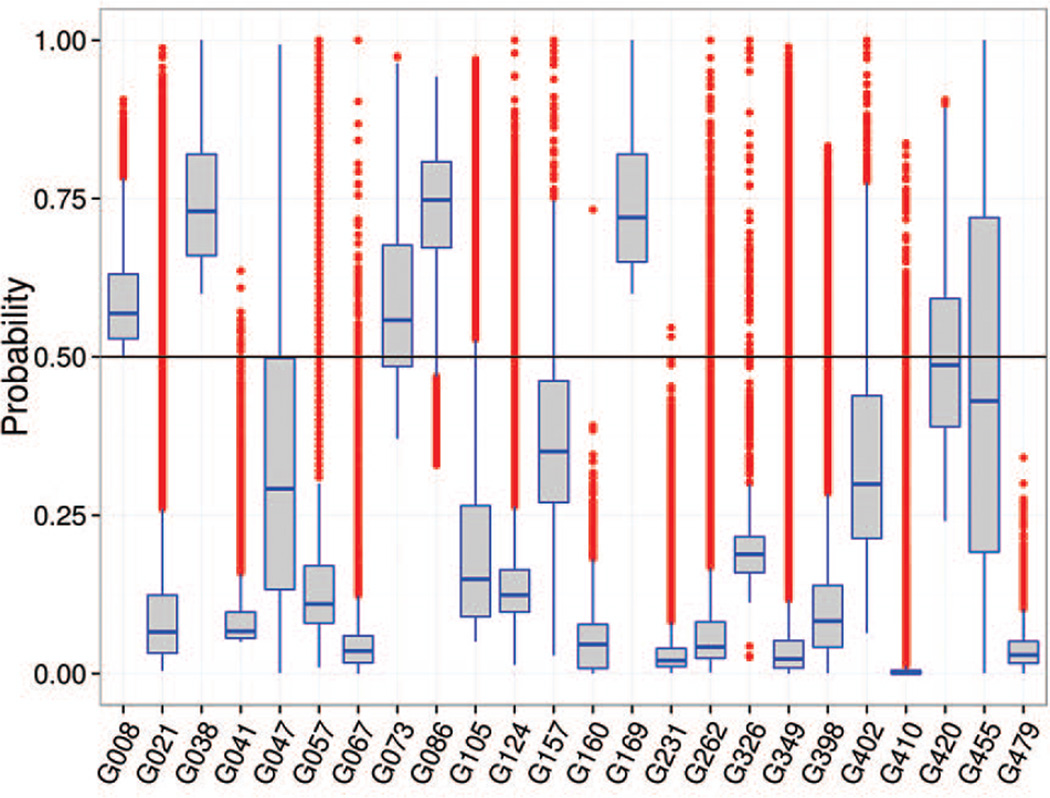
Since both MCC and PR analyses account for the accuracy of predictors as two-class classifiers, their results are expected to be similar. The comparison of the data in the two panels of Figure 4 tells that some groups do show comparable results according to both measures (e.g., G021, G420), while others demonstrate striking differences. In particular, group G479, is in the 8th place according to the AUC_PR and at the very bottom according to the MCC. The explanation of this discordance rests on the fact that not all predictors calibrated their methods to use the 0.5 probability cutoff for separating contacts from non-contacts. Figure 6 shows that some CASP11 groups (including G479, G231 and G160) assigned probabilities below 0.5 to almost all predicted contacts, thus causing the number of positively predicted contacts (both true and false) to be very close to 0, and subsequently driving the MCC scores towards 0 (see the MCC formula in the Materials).
Figure 6.
A boxplot showing statistics on the submitted probabilities for pairs of residues in contact. Box boundaries correspond to the Q1=25th (bottom) and Q3=75th (top) percentiles in the data; the horizontal line inside the box corresponds to the median (Q2). The height of the box defines the interquartile range (IQR = Q3 − Q1). The height of the whiskers shows the range of the values outside the interquartile range, but within 1.5*IQR. The red dots correspond to outliers, i.e. values outside the 1.5*IQR range. The black horizontal line across the plot shows the cutoff (0.5) separating confidently predicted contacts from the others. It can be seen that some groups submitted only confident contacts (p>0.5), while others likely misinterpreted the format submitting almost all of the contacts with probabilities below 0.5.
Overall group rankings according to the RL + FL analyses
The relative performance of the CASP11 groups in each of the four analyses (described above) was expressed in terms of z-scores.
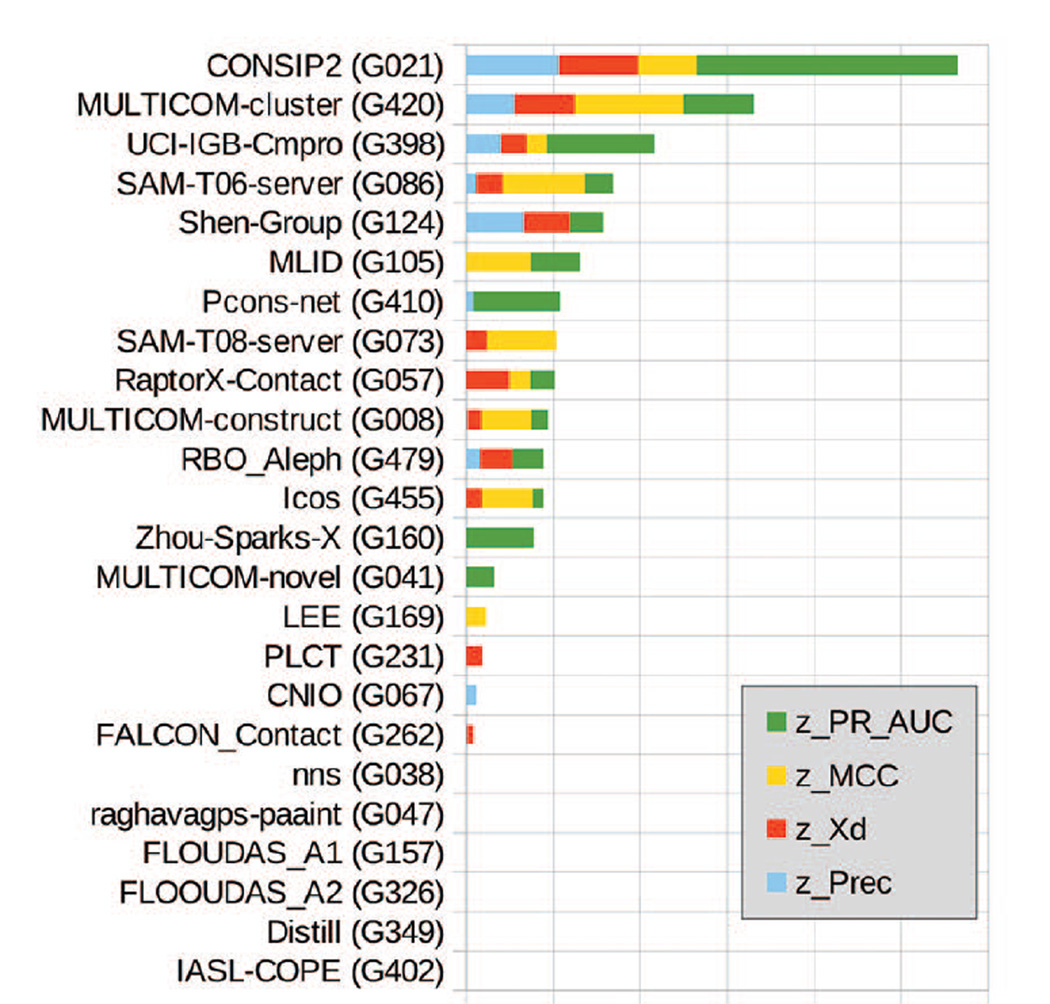
Figure 7 shows the rank of the groups assessed in both RL and FL modes according to the sum of their z-scores computed for all the evaluation measures. The CONSIP2 group is a clear leader being in the top position in three out of the four analyses of our assessment. The ability to correctly rank the predicted contacts (green bar) and the superior performance for targets with deeper alignments contribute considerably to the overall success of this group. The Multicom-cluster and UCI-IGB-Cmpro groups showed relatively good performance in both the RL-based and the FL-based analyses, and are clearly in the second and third places in the overall ranking. The Shen-group, a reasonable performer in the RL analyses (2nd on precision and 3rd on Xd), showed only average results in the FL-based analyses (11th on the MCC and 7th on the AUC) and therefore fell to the 5th place in the cumulative ranking.
Figure 7.
Cumulative ranking of CASP11 contact prediction groups according to the sum of z-scores calculated from the distributions of precision, Xd, MCC and AUC_PR scores (see Materials).
Position of the first correct and incorrect contact
The analysis of the position of the first correct and incorrect contacts in the predicted contact lists was first performed in CASP10. In CASP11 we repeated this analysis for the long-range contacts in the FM targets.
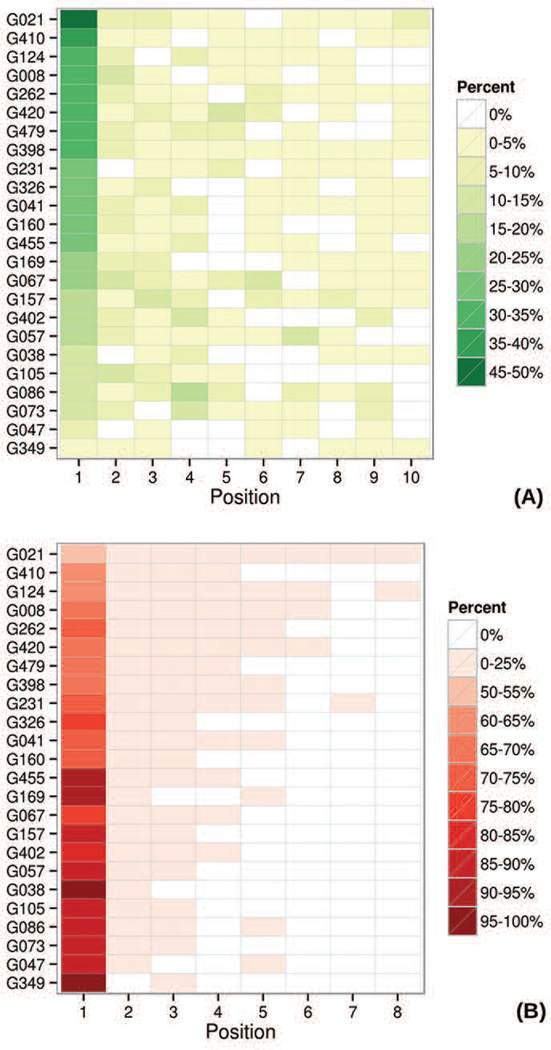
Figure 8 shows, for each group, the percentage of times where the first correctly predicted contact (panel A) and the first incorrectly predicted contact (panel B) are found in a given position. Group CONSIP2 (G021) is again on the top of the ranked result tables. It has the highest percentage of cases where a correct prediction is in the first position (49%), and also the lowest percentage of cases where an incorrect prediction is on top (51%). Disappointedly, the numbers show that the most confidently predicted contact has approximately the same chance of being correct as incorrect even in the predictions of the best group.
Figure 8.
Percentage of cases where the first correct (panel A) and first incorrect (panel B) prediction is in the reported position for each group. Rows are ordered according to the percentage in the first column of panel A. The data are shown for the top L/5 long-range contacts in FM domains.
As groups in Figure 8 are sorted according to the decreasing percentage of correct predictions in the first position, one can notice that the data in both panels are inversely coordinated. This indicates that groups with the higher percentage of correct predictions in the first position have a lower percentage of wrong predictions in the same position. Even though such a behavior is naturally expected (and therefore may not be recognized as a positive feature of the methods), we want to mention that it cannot be taken for granted. For example, in CASP10 there were several cases where the same group demonstrated high percentages for both correct and incorrect predictions due to its assigning of the same probability to a set of contacts, some correct and some incorrect. The fact that this is not the case in CASP11 is certainly a positive development.
Dependence of group performance on the depth of alignment
Our analysis in the previous sections has shown that the best results in CASP11 were obtained by a method using a new co-variation technique. As these methods are known to be demanding on the number and diversity of homologous sequences, we analyzed the dependency of the methods’ performance on the number of diverse sequences for the CASP11 RR targets.
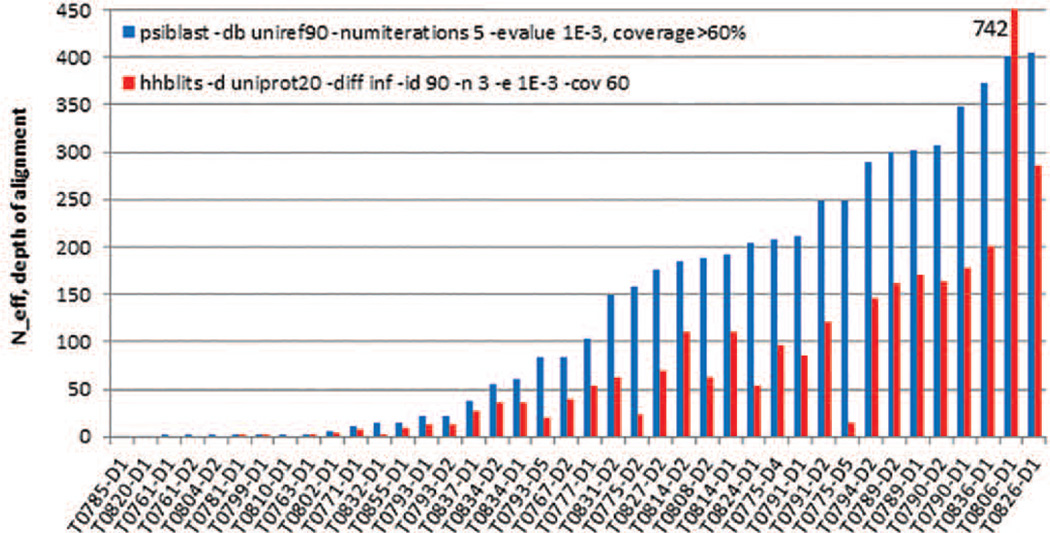
As there is no agreed upon approach for calculating the effective number of diverse homologous sequences N_eff, and different researchers use different alignment methods and different definitions of the diversity of the aligned sequences, we estimated the number of not-too-redundant sequences that were available for each target using PSI-BLAST43 and HHblits39 searches (Figure 9). In CASP11 there were no targets having more than 500 PSIBLAST hits, and only one target (T0806-D1) that had more than 500 HHblits hits. At the same time, eight targets had both more than 250 PSIBLAST hits and more than 140 HHblits hits. As numbers of hits from the PSIBLAST runs were better spread in terms of similarity than those from the HHblits runs, we defined the depth of alignment N_eff as the number of hits retrieved in the PSIBLAST runs.
Figure 9.
Number of diverse homologous sequences (depth of alignment) for the CASP11 FM targets. The effective number of sequences was calculated with the PSIBlast and HHblits programs on similar databases with similar parameters (provided in the panel).
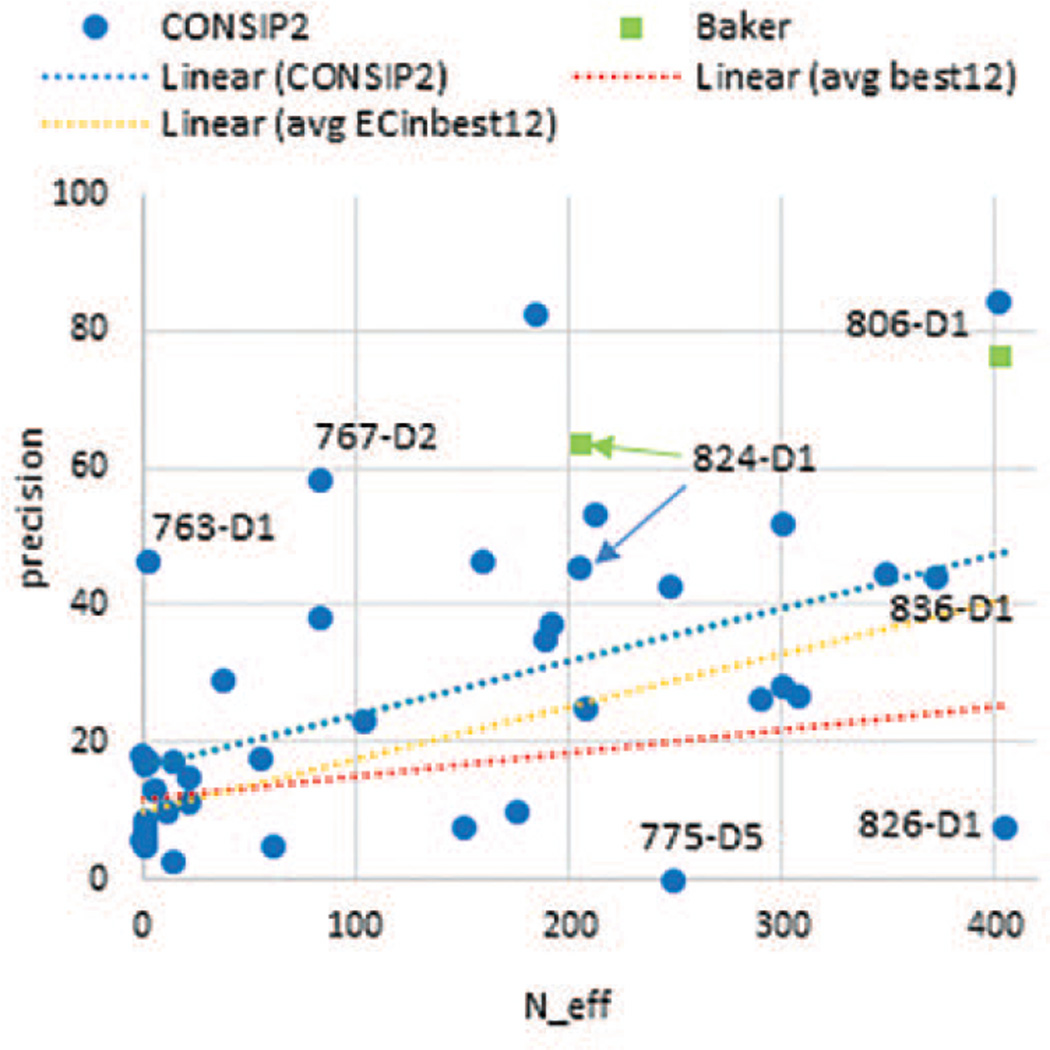
Figure 10 shows that CASP11 methods, overall, demonstrated better performance on targets with deeper alignments as the regression line for the average precision of the top 12 methods goes up from 10% at the lower end of the alignment depth to 25% at the upper end. If we concentrate our attention on the four methods (in the top 12) that used the new co-variation approach, we find that the dependency of the precision on the alignment depth becomes twice as large with the regression line rising by 30% - from 10% to 40%. The fit line for the leading group (CONSIP2) is the highest one, rising with approximately the same slope as that of the four EC methods, but reaching higher absolute values, going up from ~17% to ~47%. Even though it is generally true that the more sequences are available, the better the performance of the EC methods, the CASP11 data suggest that it is sometimes possible to obtain quite successful contact predictions (precision exceeding 40%) even when fewer than 200 N_eff sequences are available (4 cases from CONSIP2 in CASP11). It should be mentioned, though, that such data must be interpreted with caution, as it is not guaranteed that all predictions from the new co-variation methods were generated using ab initio approaches exclusively. Indeed, two of the four targets with high precision and low N_eff (763-D1 and 767-D2) were predicted by the CONSIP2 group with the help of template-based approaches (private communication). Out of the 13 domains with N_eff>200, only two (T0826-D1 and T0775-D5) were predicted by CONSIP2 with low precision (due to domain splitting error), while seven were predicted with quite high precision (over 40%). In general, out of the 16 CASP11 domains predicted by the CONSIP2 group using a purely co-variation based de novo approach44, half were predicted with a precision above 30%. This is an interesting observation, as it has been believed that the EC methods need at least 500 sequences, as a rule, to perform well45, whereas there were no targets in CASP11 with more than 500 N_eff sequences.‡ It should be mentioned, though, that exceptions to the rule are known14, and in this paper we concentrate on assessing the accuracy of the submitted top-ranked contacts and do not take into account the question, key in the field, of whether a sufficient number of correct pairs to assist protein folding in silico are predicted.
Figure 10.
Precision of the top L/5 long-range contacts as a function of the depth of alignment (# of PSIBLAST hits versus the UNIREF90 database). Each point corresponds to one domain. Data points are shown for the CONSIP2 group and also for two contact predictions from the Baker structure prediction group on targets T0806-D1 and T0824-D1 (not part of the CASP11 contact prediction experiment). Linear trend lines are fitted through the data points for the CONSIP2 group (blue), for the average of the top 12 groups (red, individual values not shown) and for the average of the four evolutionary coupling groups in the top 12 (CONSIP2, Shen-group, Pcons-net and CNIO – orange, individual values not shown).
Another interesting observation is that the Jones-UCL tertiary structure prediction group (which used contact predictions from the CONSIP2 group) was at least second best on all human/server domains, where alignment was relatively deep (>200 N_eff sequences) and where their own contact predictions were of good quality (>40%). This suggests that applying contact prediction to 3D modeling of FM targets is worthwhile. This is also confirmed by the exceptionally good models [Ref: FM assessment paper by Kinch/Grishin et al, THIS ISSUE] obtained by another structure predictor, the Baker group, on two FM targets with deep alignments - T0806 and T0824. Even though this group did not participate in the CASP11 RR category, they did generate distance restraints for their structure modeling using the GREMLIN21 method (private communication). We asked the Baker group to share their contact predictions with us, and it appeared that the contacts on these two targets were indeed predicted with a very high precision (64% on T0824-D1 and 77% on T0806-D1, similar to the high values obtained by the CONSIP2 group - see Figure 10) thus definitely making an impact on the quality of their structure prediction.
Inter-domain contact predictions
Assessing inter-domain contact predictions provides an estimate of the ability of predictors to recognize proper packing of the constituent domains in multi-domain proteins. We tested the precision with which groups predicted contacts between residues belonging to different domains. The results for the inter-domain long-range contacts from L/5 lists on the CASP11 FM targets are summarized in Table S5.
It can be seen that the accuracy of predicting inter-domain contacts is much lower than that for intra-domain contacts. The highest precision achieved by a CASP11 group is below 6%, which is likely insufficient for the relevant practical application of using the contacts to help predicting relative orientation of the domains. This is somewhat disappointing and shows essentially no improvement over the previous CASP results. It could be speculated that predictors do not use the alignment of the separate domains and this might impact the quality of results. And, surely, inter-domain contacts are likely to be more distant along the sequence and therefore more difficult to predict. The relevance of predicting the inter-domain contacts might be worth of special emphasis in the next experiment.
Progress in CASP contact prediction
Measuring progress in contact prediction is more complex than a simple comparison of the best scores in different rounds of CASP. Targets and databases change in time, and background effects from these changes blend with the effects of real improvements in the methods. Separating methodological and non-methodological improvements is not trivial, but here we take a step in this direction by relating the results of the methods that are apparently under development to the results of a method that did not change in time. Such a comparison in different rounds of CASP can provide an estimate of progress, if any, independent of other non-method related factors. A good candidate for the reference method is the SAM-T08-server46, which has been participating in CASP since CASP8 (2008), and whose methodology did not change since.
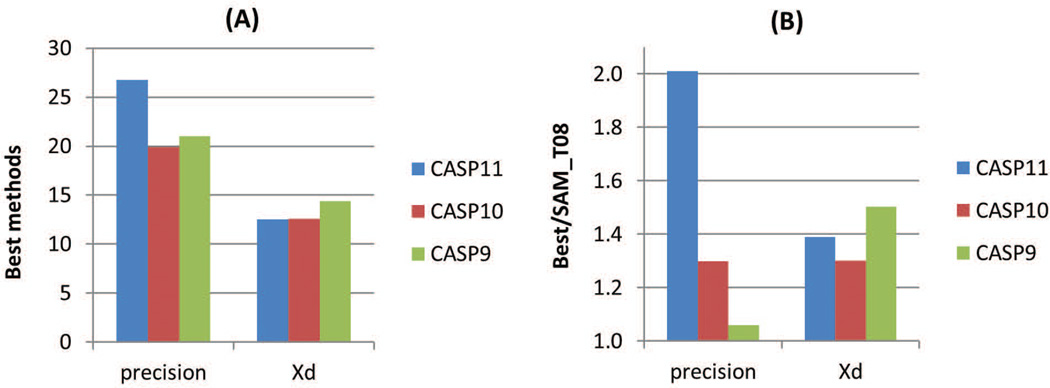
Figure 11 shows the results of the very best methods in the latest 3 CASPs according to the precision and Xd scores, and compares these results with the scores of the reference method in the corresponding CASPs. While the Xd–based results remained largely unchanged, the precision-based results turned favorably in CASP11. The best CASP11 method outscored the best CASP10 and CASP9 methods in the precision-based analysis both in absolute terms (CASP11 precision=27% vs 20% in CASP10, and 21% in CASP9), and with respect to the reference method (CASP11 Best-to-Reference precision ratio of 2.01 vs 1.30 in CASP10 and 1.06 in CASP9), indicating a methodological progress.
Figure 11.
Comparison of highest precision and Xd scores in CASP9, 10 and 11 (panel A: absolute values; panel B: relative to the reference SAM-T08 method).
CONCLUSIONS
CASP11 was a success story for the CONSIP2 group (leader – David Jones, UCL) and the evolutionary coupling methods in general. Much attention and credit were given to this type of methods in the past five years, and they finally came out of shade, showing the first practical signs of their applicability to a range of targets. The precision achieved by the leading CASP11 group on the set of the most difficult prediction targets (27%) significantly exceeded that of the second best group and those seen in recent CASPs. Successful prediction of contacts was shown to be practically helpful in structure modeling, and for one target in particular (T0806) it resulted in template free-modeling success well beyond what has been seen in previous CASPs. The new methods are still limited in their application, because of a need for deep and robust sequence alignments, but as witnessed in CASP11, the recent theoretical improvements are extending their range of application. CASP will continue to focus on the developments in this area, expecting further progress in the immediate future.
Supplementary Material
Acknowledgments
This work was partially supported by the US National Institute of General Medical Sciences (NIGMS/NIH) – grant R01GM100482 to KF, by KAUST Award KUK-I1-012-43 to AT.
Abbreviations
- FM
free modeling
- TBM
template-based modeling
- RR
residue-residue (contacts)
- MCC
the Matthews correlation coefficient
- RL/FL
reduced/full list
- MSA
multiple sequence alignment
Footnotes
In a typical PDB protein, the gyration radius of 30Å corresponds to a protein of around 1000 residues, according to the R=2.77L0.34 formula provided in the cited reference31.
Please note the two differences in this evaluation procedure from that used in our assessment presented at the CASP11 meeting. First, here we perform the MCC analysis on the per-target basis to provide a perspective different from that of the PR-analysis. Second, in the RL analysis, we set the negative z-scores to 0 only after the averaging, so as not to under-penalize the individual badly predicted targets.
Note that different procedures for calculating the number of effective sequences in the alignment may give somewhat different results (as, for example, shown in Figure 9).
LITERATURE
- 1.Lesk AM. CASP2: report on ab initio predictions. Proteins. 1997;(Suppl 1):151–166. doi: 10.1002/(sici)1097-0134(1997)1+<151::aid-prot20>3.3.co;2-j. [DOI] [PubMed] [Google Scholar]
- 2.Orengo CA, Bray JE, Hubbard T, LoConte L, Sillitoe I. Analysis and assessment of ab initio three-dimensional prediction, secondary structure, and contacts prediction. Proteins. 1999;(Suppl 3):149–170. doi: 10.1002/(sici)1097-0134(1999)37:3+<149::aid-prot20>3.3.co;2-8. [DOI] [PubMed] [Google Scholar]
- 3.Lesk AM, Lo Conte L, Hubbard TJ. Assessment of novel fold targets in CASP4: predictions of three-dimensional structures, secondary structures, and interresidue contacts. Proteins. 2001;(Suppl 5):98–118. doi: 10.1002/prot.10056. [DOI] [PubMed] [Google Scholar]
- 4.Aloy P, Stark A, Hadley C, Russell RB. Predictions without templates: new folds, secondary structure, and contacts in CASP5. Proteins. 2003;53(Suppl 6):436–456. doi: 10.1002/prot.10546. [DOI] [PubMed] [Google Scholar]
- 5.Grana O, Baker D, MacCallum RM, Meiler J, Punta M, Rost B, Tress ML, Valencia A. CASP6 assessment of contact prediction. Proteins. 2005;61(Suppl 7):214–224. doi: 10.1002/prot.20739. [DOI] [PubMed] [Google Scholar]
- 6.Izarzugaza JM, Grana O, Tress ML, Valencia A, Clarke ND. Assessment of intramolecular contact predictions for CASP7. Proteins. 2007;69(Suppl 8):152–158. doi: 10.1002/prot.21637. [DOI] [PubMed] [Google Scholar]
- 7.Ezkurdia I, Grana O, Izarzugaza JM, Tress ML. Assessment of domain boundary predictions and the prediction of intramolecular contacts in CASP8. Proteins. 2009;77(Suppl 9):196–209. doi: 10.1002/prot.22554. [DOI] [PubMed] [Google Scholar]
- 8.Monastyrskyy B, Fidelis K, Tramontano A, Kryshtafovych A. Evaluation of residue-residue contact predictions in CASP9. Proteins. 2011;79(Suppl 10):119–125. doi: 10.1002/prot.23160. [DOI] [PMC free article] [PubMed] [Google Scholar]
- 9.Monastyrskyy B, D’Andrea D, Fidelis K, Tramontano A, Kryshtafovych A. Evaluation of residue-residue contact prediction in CASP10. Proteins. 2014;82(Suppl 2):138–153. doi: 10.1002/prot.24340. [DOI] [PMC free article] [PubMed] [Google Scholar]
- 10.Shindyalov IN, Kolchanov NA, Sander C. Can three-dimensional contacts in protein structures be predicted by analysis of correlated mutations? Protein Eng. 1994;7(3):349–358. doi: 10.1093/protein/7.3.349. [DOI] [PubMed] [Google Scholar]
- 11.Gobel U, Sander C, Schneider R, Valencia A. Correlated mutations and residue contacts in proteins. Proteins. 1994;18(4):309–317. doi: 10.1002/prot.340180402. [DOI] [PubMed] [Google Scholar]
- 12.Burger L, van Nimwegen E. Disentangling direct from indirect co-evolution of residues in protein alignments. PLoS Comput Biol. 2010;6(1):e1000633. doi: 10.1371/journal.pcbi.1000633. [DOI] [PMC free article] [PubMed] [Google Scholar]
- 13.Weigt M, White RA, Szurmant H, Hoch JA, Hwa T. Identification of direct residue contacts in protein-protein interaction by message passing. Proc Natl Acad Sci U S A. 2009;106(1):67–72. doi: 10.1073/pnas.0805923106. [DOI] [PMC free article] [PubMed] [Google Scholar]
- 14.Marks DS, Colwell LJ, Sheridan R, Hopf TA, Pagnani A, Zecchina R, Sander C. Protein 3D structure computed from evolutionary sequence variation. PLoS One. 2011;6(12):e28766. doi: 10.1371/journal.pone.0028766. [DOI] [PMC free article] [PubMed] [Google Scholar]
- 15.Marks DS, Hopf TA, Sander C. Protein structure prediction from sequence variation. Nat Biotechnol. 2012;30(11):1072–1080. doi: 10.1038/nbt.2419. [DOI] [PMC free article] [PubMed] [Google Scholar]
- 16.Hopf TA, Scharfe CP, Rodrigues JP, Green AG, Kohlbacher O, Sander C, Bonvin AM, Marks DS. Sequence co-evolution gives 3D contacts and structures of protein complexes. eLife. 2014;3 doi: 10.7554/eLife.03430. [DOI] [PMC free article] [PubMed] [Google Scholar]
- 17.Morcos F, Pagnani A, Lunt B, Bertolino A, Marks DS, Sander C, Zecchina R, Onuchic JN, Hwa T, Weigt M. Direct-coupling analysis of residue coevolution captures native contacts across many protein families. Proc Natl Acad Sci U S A. 2011;108(49):E1293–E1301. doi: 10.1073/pnas.1111471108. [DOI] [PMC free article] [PubMed] [Google Scholar]
- 18.Sulkowska JI, Morcos F, Weigt M, Hwa T, Onuchic JN. Genomics-aided structure prediction. Proc Natl Acad Sci U S A. 2012;109(26):10340–10345. doi: 10.1073/pnas.1207864109. [DOI] [PMC free article] [PubMed] [Google Scholar]
- 19.Jones DT, Buchan DW, Cozzetto D, Pontil M. PSICOV: precise structural contact prediction using sparse inverse covariance estimation on large multiple sequence alignments. Bioinformatics. 2012;28(2):184–190. doi: 10.1093/bioinformatics/btr638. [DOI] [PubMed] [Google Scholar]
- 20.Jones DT, Singh T, Kosciolek T, Tetchner S. MetaPSICOV: combining coevolution methods for accurate prediction of contacts and long range hydrogen bonding in proteins. Bioinformatics. 2015;31(7):999–1006. doi: 10.1093/bioinformatics/btu791. [DOI] [PMC free article] [PubMed] [Google Scholar]
- 21.Kamisetty H, Ovchinnikov S, Baker D. Assessing the utility of coevolution-based residue-residue contact predictions in a sequence- and structure-rich era. Proc Natl Acad Sci U S A. 2013;110(39):15674–15679. doi: 10.1073/pnas.1314045110. [DOI] [PMC free article] [PubMed] [Google Scholar]
- 22.Ovchinnikov S, Kamisetty H, Baker D. Robust and accurate prediction of residue-residue interactions across protein interfaces using evolutionary information. eLife. 2014;3:e02030. doi: 10.7554/eLife.02030. [DOI] [PMC free article] [PubMed] [Google Scholar]
- 23.Ekeberg M, Hartonen T, Aurell E. Fast pseudolikelihood maximization for direct-coupling analysis of protein structure from many homologous amino-acid sequences. J Comput Phys. 2014;276:341–356. [Google Scholar]
- 24.Michel M, Hayat S, Skwark MJ, Sander C, Marks DS, Elofsson A. PconsFold: improved contact predictions improve protein models. Bioinformatics. 2014;30(17):i482–i488. doi: 10.1093/bioinformatics/btu458. [DOI] [PMC free article] [PubMed] [Google Scholar]
- 25.Skwark MJ, Abdel-Rehim A, Elofsson A. PconsC: combination of direct information methods and alignments improves contact prediction. Bioinformatics. 2013;29(14):1815–1816. doi: 10.1093/bioinformatics/btt259. [DOI] [PubMed] [Google Scholar]
- 26.Skwark MJ, Raimondi D, Michel M, Elofsson A. Improved contact predictions using the recognition of protein like contact patterns. PLoS Comput Biol. 2014;10(11):e1003889. doi: 10.1371/journal.pcbi.1003889. [DOI] [PMC free article] [PubMed] [Google Scholar]
- 27.Feinauer C, Skwark MJ, Pagnani A, Aurell E. Improving contact prediction along three dimensions. PLoS Comput Biol. 2014;10(10):e1003847. doi: 10.1371/journal.pcbi.1003847. [DOI] [PMC free article] [PubMed] [Google Scholar]
- 28.Kajan L, Hopf TA, Kalas M, Marks DS, Rost B. FreeContact: fast and free software for protein contact prediction from residue co-evolution. BMC Bioinformatics. 2014;15:85. doi: 10.1186/1471-2105-15-85. [DOI] [PMC free article] [PubMed] [Google Scholar]
- 29.Taylor TJ, Tai CH, Huang YJ, Block J, Bai H, Kryshtafovych A, Montelione GT, Lee B. Definition and classification of evaluation units for CASP10. Proteins. 2014;82(Suppl 2):14–25. doi: 10.1002/prot.24434. [DOI] [PMC free article] [PubMed] [Google Scholar]
- 30.Kinch L, et al. CASP11 target classification. Proteins. 2015 (Current issue). [Google Scholar]
- 31.Kryshtafovych A, Monastyrskyy B, Fidelis K. CASP prediction center infrastructure and evaluation measures in CASP10 and CASP ROLL. Proteins. 2014;82(Suppl 2):7–13. doi: 10.1002/prot.24399. [DOI] [PMC free article] [PubMed] [Google Scholar]
- 32.Kryshtafovych A, Fidelis K, Moult J. CASP10 results compared to those of previous CASP experiments. Proteins. 2014;82(Suppl 2):164–174. doi: 10.1002/prot.24448. [DOI] [PMC free article] [PubMed] [Google Scholar]
- 33.Monastyrskyy B, Fidelis K, Moult J, Tramontano A, Kryshtafovych A. Evaluation of disorder predictions in CASP9. Proteins. 2011;79(Suppl 10):107–118. doi: 10.1002/prot.23161. [DOI] [PMC free article] [PubMed] [Google Scholar]
- 34.Carpenter J, Bithell J. Bootstrap confidence intervals: when, which, what? A practical guide for medical statisticians. Stat Med. 2000;19(9):1141–1164. doi: 10.1002/(sici)1097-0258(20000515)19:9<1141::aid-sim479>3.0.co;2-f. [DOI] [PubMed] [Google Scholar]
- 35.Payton ME, Greenstone MH, Schenker N. Overlapping confidence intervals or standard error intervals: what do they mean in terms of statistical significance? J Insect Sci. 2003;3:34. doi: 10.1093/jis/3.1.34. [DOI] [PMC free article] [PubMed] [Google Scholar]
- 36.Eickholt J, Cheng J. Predicting protein residue-residue contacts using deep networks and boosting. Bioinformatics. 2012;28(23):3066–3072. doi: 10.1093/bioinformatics/bts598. [DOI] [PMC free article] [PubMed] [Google Scholar]
- 37.Tegge AN, Wang Z, Eickholt J, Cheng J. NNcon: improved protein contact map prediction using 2D-recursive neural networks. Nucleic Acids Res. 2009;37:W515–W518. doi: 10.1093/nar/gkp305. (Web Server issue) [DOI] [PMC free article] [PubMed] [Google Scholar]
- 38.Johnson LS, Eddy SR, Portugaly E. Hidden Markov model speed heuristic and iterative HMM search procedure. BMC Bioinformatics. 2010;11:431. doi: 10.1186/1471-2105-11-431. [DOI] [PMC free article] [PubMed] [Google Scholar]
- 39.Remmert M, Biegert A, Hauser A, Soding J. HHblits: lightning-fast iterative protein sequence searching by HMM-HMM alignment. Nat Methods. 2012;9(2):173–175. doi: 10.1038/nmeth.1818. [DOI] [PubMed] [Google Scholar]
- 40.Wang Z, Xu J. Predicting protein contact map using evolutionary and physical constraints by integer programming. Bioinformatics. 2013;29(13):i266–i273. doi: 10.1093/bioinformatics/btt211. [DOI] [PMC free article] [PubMed] [Google Scholar]
- 41.Schneider M, Brock O. Combining physicochemical and evolutionary information for protein contact prediction. PLoS ONE. 2014;9(10):e108438. doi: 10.1371/journal.pone.0108438. [DOI] [PMC free article] [PubMed] [Google Scholar]
- 42.Levandowsky M, Winter D. Distance between Sets. Nature. 1971;234(5323) 34-&. [Google Scholar]
- 43.Altschul SF, Madden TL, Schaffer AA, Zhang J, Zhang Z, Miller W, Lipman DJ. Gapped BLAST and PSI-BLAST: a new generation of protein database search programs. Nucleic Acids Res. 1997;25(17):3389–3402. doi: 10.1093/nar/25.17.3389. [DOI] [PMC free article] [PubMed] [Google Scholar]
- 44.Kosciolek T, Jones DT. Accurate contact predictions using covariation techniques and machine learning. Proteins. 2015 doi: 10.1002/prot.24863. [DOI] [PMC free article] [PubMed] [Google Scholar]
- 45.Kosciolek T, Jones DT. De novo structure prediction of globular proteins aided by sequence variation-derived contacts. PLoS ONE. 2014;9(3):e92197. doi: 10.1371/journal.pone.0092197. [DOI] [PMC free article] [PubMed] [Google Scholar]
- 46.Karplus K. SAM-T08, HMM-based protein structure prediction. Nucleic Acids Res. 2009;37:W492–W497. doi: 10.1093/nar/gkp403. (Web Server issue) [DOI] [PMC free article] [PubMed] [Google Scholar]
Associated Data
This section collects any data citations, data availability statements, or supplementary materials included in this article.


