

Abstract
Objectives
Delaying nephrectomy <3 months does not adversely affect treatment outcome of renal tumors. Whether surgical waiting time (SWT; time from diagnosis to surgery) >3 months affects treatment outcome for large renal masses has not been well studied. We aimed to evaluate if SWT is associated with treatment outcome of renal masses >4cm, and identify patients more likely to experience prolonged SWT.
Materials and Methods
Data from 1,484 patients undergoing radical or partial nephrectomy at a single institution for a non-metastatic renal mass >4cm between 1995–2013 were reviewed. Patients with benign tumors and incomplete preoperative data were excluded. The association between SWT and disease upstaging at the time of surgery and recurrence at 2 and 5 years was assessed using logistic regression. Cancer-specific survival (CSS) and overall survival (OS) were assessed with landmark survival analyses and multivariable Cox proportional hazards models. All analyses were adjusted for patient and tumor characteristics.
Results
Of the final cohort of 1,278 patients, 267 (21%) had SWT >3 months. Patients with larger, symptomatic tumors had shorter SWT. Median follow-up for survivors was 3.8 years (IQR 1.5–7.4). On multivariable analysis, SWT was not associated with disease upstaging, recurrence or CSS. Longer SWT was associated with decreased OS (HR=1.17, 95% CI, 1.08–1.27, p=0.0002). Gender and tumor size, histology, and presentation were associated with disease upstaging, recurrence and CSS. The most common cause for surgical delay >3 months was evaluation and treatment of comorbidities.
Conclusion
Patient and tumor characteristics, rather than SWT, were associated with disease upstaging, recurrence and CSS, and should guide the decision to delay surgery when treating non-metastatic renal tumors >4cm.
Keywords: Nephrectomy, outcome prediction, renal cell carcinoma, surgical treatment delay
1. Introduction
Surgical resection by either partial nephrectomy (PN) or radical nephrectomy (RN) is the standard treatment for renal cell carcinoma (RCC) tumors >4 cm.[1, 2] Postponing surgery may be required for various medical or logistical reasons including evaluation and treatment of significant comorbidities or concurrent cancers, patient or physician preferences, and insurance issues. Moreover, waiting times for cancer treatments have increased over the last decade with the increase in case load at many centers, contributing to the potential for treatment delay.[3] Delaying definitive surgical resection might have a deleterious effect on treatment outcome, as is the case in muscle-invasive bladder cancer, where an increased risk of disease-specific and all-cause mortality was observed when radical cystectomy was delayed >12 weeks.[4–6]
Only a few previous reports have questioned the effect of prolonged surgical waiting time (SWT) on oncologic outcomes following surgical resection of renal tumors >4 cm.[7–9] These reports did not find a significant difference in the oncologic outcomes; however, small renal masses which may have been suitable for active surveillance, were included in two studies,[7, 8] while the third reported SWT <3 months from diagnosis.[9] Furthermore, the statistical methods used in these reports did not account for the time-dependent nature of SWT.
We aimed to assess whether SWT until PN or RN is associated with increased likelihood of disease recurrence, kidney cancer specific survival (CSS), and overall survival (OS) for renal tumors >4 cm.
2. Materials and Methods
After obtaining Institutional Review Board approval, we used our institutional database to review medical records of 1,484 adult patients with non-metastatic renal tumor >4 cm, who had a documented axial imaging from the time of diagnosis, and were treated with PN or RN at our center between 1995 and 2013. Patients were excluded if lacking complete preoperative data (n=71), or if found to have a benign kidney tumor (n=135), leaving 1,278 patients in our cohort.
Preoperative patient characteristics included in the analysis were age at surgery, gender, race (white or non-white), American Society of Anesthesiologists (ASA) score, Charlson comorbidity index (CCI), body mass index (BMI), and presentation status (incidental, local or systemic symptoms). CCI was calculated as previously described, excluding the diagnosis of RCC.[10] Tumor size at diagnosis and clinical stage were defined according to the tumor’s largest diameter on axial imaging.
SWT was calculated from the date of tumor identification on imaging to the date of nephrectomy. The cut-point of 3 months for SWT was chosen because prior surgical delay research has studied patients with SWT ≤3 months.[7–9] Later cut-points were not evaluated due to a limited number of patients with longer SWT. Restricted cubic splines with knots at the tertiles were used to test for non-linearity in SWT.
Following nephrectomy, surgical specimens were reviewed by genitourinary pathologists. Tumor histology was defined according to the 2004 World Health Organization classification.[11] Tumors were staged according to the 2010 American Joint Committee on Cancer (AJCC) staging system.[12] Tumor growth was the change in tumor size from diagnostic imaging to pathology report. Tumor growth rate was tumor growth divided by SWT. Patients were followed semiannually with physical examination, blood chemistry, and abdominal and chest imaging for the first 2 years, and annually thereafter.
The cause for treatment delay in patients with SWT >3 months was evaluated by reviewing patients’ medical records. A referral delay was defined when time between diagnosis and urologic consultation at our institution exceeded 45 days. Similarly, treatment delay was defined when time between urologic consultation and nephrectomy exceeded 45 days.
Study endpoints included disease progression at the time of surgery, 2-year and 5-year disease recurrence, CSS and OS. Disease progression was assessed with the endpoints tumor growth, any upstaging and upstaging to pT3a or higher disease. Patient and tumor characteristics were compared between patients with SWT ≤3 months and >3 months using rank-sum and chi-squared tests, and with SWT as a continuous variable using univariate linear regression analyses. A logistic regression analysis was used for upstaging and recurrence within 2 and 5 years after surgery, adjusting for gender, race, age at surgery, CCI (0 or ≥1), BMI, symptoms at presentation, tumor size at imaging, and tumor histology (clear cell or non-clear cell). SWT is inherently associated with time-to-event, giving an advantage to a short SWT simply as an artifact of the statistical method, and complicating its use as a predictor of outcome. In order to avoid these biases, landmark survival analyses were performed for the outcomes of CSS and OS. A fixed time after diagnosis was selected as a landmark for the analysis of survival by SWT: only patients who received nephrectomy and were alive at the landmark time were included in this analysis.[13] Landmarks of 6, 9 and 12 months were considered, and results proved consistent between all three. A landmark of 9 months after diagnosis was chosen to exclude the fewest patients from the sample. A multivariable Cox proportional hazards model, adjusted for the same patient and tumor characteristics, was used to assess survival from 9 months after diagnosis.
Sensitivity analyses for recurrence and survival were performed using patients with AJCC stage III/IV tumors only to determine if SWT significantly affected outcome only for patients with aggressive disease. Kaplan Meier estimates for CSS and OS for patients with SWT ≤3 months and SWT >3 months were presented. All statistical analyses were two-sided, and significance was defined as p<0.05. All analyses were conducted using Stata 12.0 (College Station, TX, USA).
3. Results
The study cohort included 1,278 patients, 267 of whom (21%) had SWT >3 months. Patient and tumor characteristics stratified by SWT ≤3 months or >3 months are summarized in Table 1. Median SWT was 52 days (IQR 33–84). Six percent of patients had SWT >6 months (n=82). No evidence of non-linearity in SWT was found. Median follow-up after nephrectomy was 3.8 years for survivors (IQR 1.5–7.4); 522 patients (41%) were followed for more than 5 years. Disease recurrence rates at 2 and 5 years after surgery were 15% and 27%, respectively. Estimated 5-year CSS and OS for all patients were 89% (CI 87%–91%), and 83% (CI 80%–86%), respectively. Kaplan-Meier estimates of CSS and OS from 9 months after diagnosis stratified by SWT are shown in figures 1 and 2, respectively.
Table 1.
Patient and tumor characteristics of the study cohort stratified by SWT above and below 3 months
| All Patients (N = 1278) | SWT ≤ 3 Months (N = 1011) | SWT > 3 Months (N = 267) | p-value | |
|---|---|---|---|---|
| SWT, days, median (IQR) | 52 (33, 84) | 44 (29, 62) | 135 (106, 197) | <0.0001 |
| Male Gender, N (%) | 863 (68) | 678 (67) | 185 (69) | 0.5 |
| Age at Surgery, yr, median (IQR) | 61 (52, 69) | 60 (52, 69) | 63 (54, 72) | 0.001 |
| Race, n (%) | ||||
| White | 1149 (90) | 930 (92) | 219 (82) | <0.0001 |
| Non-white | 129 (10) | 81 (8.0) | 48 (18) | |
| BMI, median (IQR) | 29.0 (25.6, 32.9) | 28.7 (25.4, 32.6) | 29.4 (26.2, 34.1) | 0.008 |
| ASA Score, n (%) | ||||
| I/II | 703 (55) | 610 (60) | 93 (35) | <0.0001 |
| III/IV | 575 (45) | 401 (40) | 174 (65) | |
| CCI, n (%) | ||||
| 0 | 1050 (82) | 850 (84) | 200 (75) | 0.001 |
| ≥1 | 228 (18) | 161 (16) | 67 (25) | |
| Presentation, n (%) | ||||
| Incidental | 835 (65) | 627 (62) | 208 (78) | <0.0001 |
| Local | 384 (30) | 332 (33) | 52 (19) | |
| Systemic | 59 (5) | 52 (5.1) | 7 (2.6) | |
| AJCC Stage (N=1276), n (%) | ||||
| 1 | 559 (44) | 425 (42) | 134 (50) | 0.015 |
| 2 | 184 (14) | 140 (14) | 44 (17) | |
| 3 | 520 (41) | 434 (43) | 86 (32) | |
| 4 | 13 (1.0) | 11 (1.1) | 2 (0.8) | |
| Tumor Size, cm, median (IQR) | 6.2 (5.0, 8.8) | 6.5 (5.0, 9.0) | 5.7 (4.7, 7.1) | <0.0001 |
| Absolute Tumor Growth, cm, median (IQR) (N=482) | 0.8 (0.4, 1.5) | 0.8 (0.4, 1.5) | 1.0 (0.5, 1.7) | 0.05 |
| Tumor Growth, cm per month, median (IQR) (N=482) | 0.43 (0.18, 1.01) | 0.56 (0.25, 1.27) | 0.19 (0.08, 0.31) | <0.0001 |
| Type of Surgery, n (%) | ||||
| Partial Nephrectomy | 464 (36) | 330 (33) | 134 (50) | <0.0001 |
| Radical Nephrectomy | 814 (64) | 681 (67) | 133 (50) | |
| Tumor Histology, n (%) | ||||
| Clear Cell | 907 (71) | 743 (73) | 164 (61) | 0.0001 |
| Non-Clear Cell | 371 (29) | 268 (27) | 103 (39) | |
| Margin Status (N=1274), n (%) | ||||
| No | 1209 (95) | 957 (95) | 252 (94) | 0.7 |
| Yes | 65 (5.1) | 50 (5.0) | 15 (5.6) |
SWT = surgical waiting time; IQR = interquartile range; BMI = body mass index; ASA = American Society of Anesthesiologists; CCI = Charlson Comorbidity Index; AJCC = American Joint Committee on Cancer.
Figure 1.
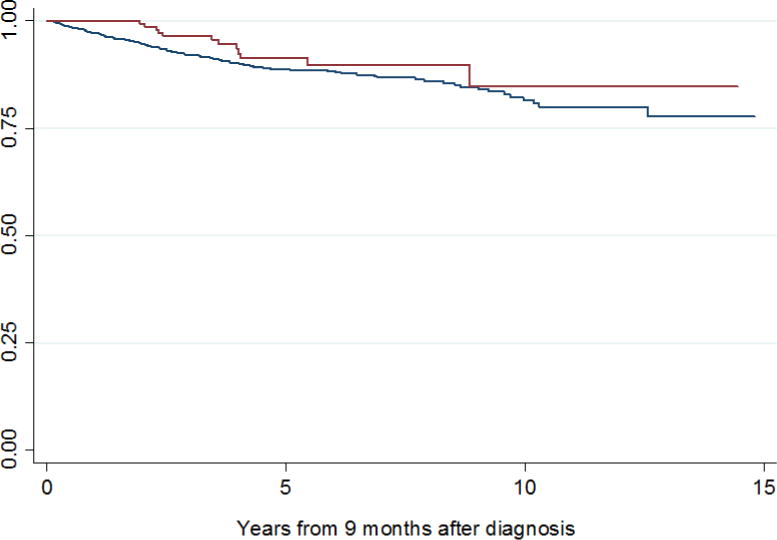
Kaplan-Meier estimates of cancer-specific survival from 9 months after diagnosis for patients with SWT ≤ 3 months (blue line) and SWT > 3 months (red line).
Figure 2.
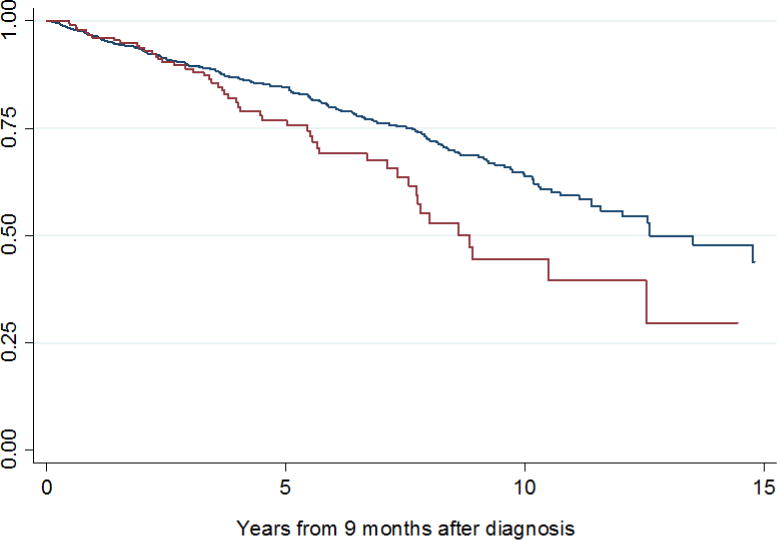
Kaplan Meier estimates of overall survival from 9 months after diagnosis for patients with SWT ≤ 3 months (blue line) and SWT > 3 months (red line).
Older age, non-white race, higher BMI, higher ASA and CCI scores, incidental presentation, smaller tumor size, non-clear cell histology and treatment with PN were significantly associated with SWT >3 months on univariate analysis (p<0.01 for all, Table 1). Similar associations were found when SWT was analyzed as a continuous variable.
Overall, 482/1,278 patients (38%) experienced tumor growth between imaging and nephrectomy (36% of patients with SWT≤3 months vs. 43% of patients with SWT>3 months, p=0.059). There was a small but clinically insignificant difference in actual tumor growth between the two groups (0.8cm for SWT≤3 months vs. 1.0cm for SWT>3 months, p=0.05). Tumor growth rates were significantly higher among patients with SWT≤3 months (0.56 cm/month) compared to patients with SWT>3 months (0.19 cm/month, p<0.0001). No significant associations were found between tumor growth and growth rate and recurrence at 2 or 5 years, OS or CSS on univariate analysis.
We found no evidence that a longer SWT was associated with a higher risk of any upstaging or of upstaging to pT3a or higher when adjusting for patient and tumor characteristics (p=0.4 and p=0.2, respectively). Male gender, older age, higher CCI scores, local or systemic presentation, larger tumor size and clear cell histology were associated with higher odds of upstaging (Table 2). A subset analysis by SWT was conducted which found an increased risk of upstaging associated with increasing tumor size in patients with SWT≤3 (OR 1.22 per 1cm increase in tumor size, 95% CI 1.16, 1.28, p<0.0001) but not in patients with SWT>3 (OR 1.07, 95% CI 0.96, 1.19, p=0.2).
Table 2.
Multivariable logistic regression model for any upstaging and for upstaging to pT3a or higher at nephrectomy
| Any Upstaging | Upstaging to pT3a+ | |||||
|---|---|---|---|---|---|---|
| OR | 95% CI | p value | OR | 95% CI | p value | |
| SWT (per mo) | 0.97 | 0.90, 1.04 | 0.4 | 0.95 | 0.88, 1.03 | 0.2 |
| Gender | ||||||
| Female | Ref. | – | 0.005 | Ref. | – | 0.014 |
| Male | 1.45 | 1.12, 1.88 | 1.40 | 1.07, 1.83 | ||
| Race | ||||||
| White | Ref. | – | 0.3 | Ref. | – | 0.4 |
| Non-white | 1.24 | 0.82, 1.88 | 1.18 | 0.77, 1.81 | ||
| Age (per 5 yr) | 1.14 | 1.08, 1.20 | <0.0001 | 1.12 | 1.06, 1.18 | <0.0001 |
| CCI | ||||||
| 0 | Ref. | – | 0.007 | Ref. | – | 0.054 |
| ≥ 1 | 1.56 | 1.13, 2.15 | 1.38 | 0.99, 1.90 | ||
| BMI | 0.99 | 0.97, 1.01 | 0.3 | 1.00 | 0.98, 1.02 | >0.9 |
| Presentation | ||||||
| Incidental | Ref. | – | <0.0001 | Ref. | – | <0.0001 |
| Local | 1.69 | 1.30, 2.20 | 1.72 | 1.31, 2.25 | ||
| Systemic | 2.69 | 1.42, 5.10 | 2.92 | 1.56, 5.45 | ||
| Tumor Size (per cm) | 1.18 | 1.13, 1.23 | <0.0001 | 1.19 | 1.14, 1.25 | <0.0001 |
| Histology | ||||||
| Non-clear cell | Ref. | – | <0.0001 | Ref. | – | <0.0001 |
| Clear cell | 2.03 | 1.53, 2.68 | 2.24 | 1.67, 3.00 | ||
OR = odds ratio; CI = confidence interval; SWT = surgical waiting time; Ref = reference value; CCI = Charlson Comorbidity Index; BMI = body mass index;
We found no evidence of an association between SWT and recurrence within 2 and 5 years of surgery when adjusting for preoperative characteristics and histology (p=0.8 and p>0.9, respectively, Table 3a). Forty-five patients with SWT >9 months and 11 patients who died of any cause within 9 months after diagnosis were excluded from the analyses for CSS and OS. We found no evidence that SWT was associated with CSS after adjusting for preoperative characteristics and histology (p=0.5, Table 4a). Despite adjusting for patient and tumor characteristics, increasing SWT was still significantly associated with poorer OS (p=0.0002, Table 4a). Similar associations between SWT and recurrence, CSS and OS were evident among 533 patients with AJCC stage III or IV disease (Tables 3b and 4b). Older age, larger tumor size, and clear cell histology were consistently associated with disease recurrence, CSS, and OS on multivariate analyses.
Table 3a.
Multivariable logistic regression model for recurrence within 2 years and 5 years after surgery
| Recurrence at 2 years | Recurrence at 5 years | |||||
|---|---|---|---|---|---|---|
| OR | 95% CI | p value | OR | 95% CI | p value | |
| SWT (per mo) | 0.98 | 0.87–1.12 | 0.8 | 1.00 | 0.89–1.13 | >0.9 |
| Gender | ||||||
| Female | Ref. | – | 0.011 | Ref. | – | 0.003 |
| Male | 1.87 | 1.16–3.04 | 2.01 | 1.28–3.17 | ||
| Race | ||||||
| White | Ref. | – | 0.2 | Ref. | – | 0.034 |
| Non-white | 1.66 | 0.82–3.37 | 2.26 | 1.06–4.79 | ||
| Age (per 5 yr) | 1.12 | 1.02–1.23 | 0.02 | 1.08 | 0.99–1.18 | 0.10 |
| CCI | ||||||
| 0 | Ref. | – | 0.002 | Ref. | – | 0.006 |
| ≥ 1 | 2.17 | 1.32–3.58 | 1.98 | 1.21–3.24 | ||
| BMI | 0.99 | 0.96–1.03 | 0.8 | 1.00 | 0.97–1.03 | >0.9 |
| Presentation | ||||||
| Incidental | Ref. | – | <0.0001 | Ref. | – | 0.0002 |
| Local | 2.74 | 1.74–4.32 | 2.08 | 1.37–3.17 | ||
| Systemic | 5.06 | 2.45–10.49 | 3.27 | 1.58–6.78 | ||
| Tumor Size (per cm) | 1.22 | 1.14–1.30 | <0.0001 | 1.19 | 1.11–1.27 | <0.0001 |
| Tumor Histology | ||||||
| Non-clear cell | Ref. | – | 0.0004 | Ref. | – | <0.0001 |
| Clear cell | 2.72 | 1.56–4.74 | 2.95 | 1.75–4.99 | ||
OR = odds ratio; CI = confidence interval; SWT = surgical waiting time; Ref = reference value; CCI = Charlson Comorbidity Index; BMI = body mass index.
Table 4a.
Multivariable Cox model for cancer-specific and overall survival after 9 months after diagnosis
| Cancer-specific survival | Overall survival | |||||
|---|---|---|---|---|---|---|
| HR | 95% CI | p value | HR | 95% CI | p value | |
| SWT (per mo) | 0.94 | 0.80–1.11 | 0.5 | 1.17 | 1.08–1.27 | 0.0002 |
| Gender | ||||||
| Female | Ref. | – | 0.004 | Ref. | – | 0.2 |
| Male | 2.14 | 1.28–3.56 | 1.21 | 0.91–1.62 | ||
| Race | ||||||
| White | Ref. | – | 0.4 | Ref. | – | >0.9 |
| Non-white | 1.36 | 0.65–2.85 | 0.99 | 0.59–1.65 | ||
| Age (per 5 yr) | 1.02 | 1.00–1.04 | 0.013 | 1.05 | 1.04–1.07 | <0.0001 |
| CCI | ||||||
| 0 | Ref. | – | 0.5 | Ref. | – | 0.5 |
| ≥ 1 | 1.16 | 0.72–1.88 | 1.11 | 0.80–1.53 | ||
| BMI | 1.01 | 0.97–1.04 | 0.8 | 1.00 | 0.97–1.02 | 0.8 |
| Presentation | ||||||
| Incidental | Ref | – | <0.0001 | Ref. | – | 0.002 |
| Local | 2.17 | 1.40–3.35 | 1.21 | 0.91–1.61 | ||
| Systemic | 4.37 | 2.35–8.10 | 2.25 | 1.43–3.54 | ||
| Tumor Size (per cm) | 1.12 | 1.06–1.18 | <0.0001 | 1.10 | 1.06–1.15 | <0.0001 |
| Tumor Histology | ||||||
| Non-clear cell | Ref. | – | 0.003 | Ref. | – | 0.009 |
| Clear cell | 2.33 | 1.34–4.07 | 1.52 | 1.11–2.08 | ||
HR = hazard ratio; CI = confidence interval; SWT = surgical waiting time; Ref = reference value; CCI = Charlson Comorbidity Index; BMI = body mass index.
Table 3b.
Multivariable logistic regression model for recurrence within 2 years and 5 years after surgery, for patients with AJCC stage III and IV disease
| Recurrence at 2 years | Recurrence at 5 years | |||||
|---|---|---|---|---|---|---|
| OR | 95% CI | p value | OR | 95% CI | p value | |
| SWT (per mo) | 1.06 | 0.91–1.23 | 0.4 | 1.05 | 0.90–1.24 | 0.5 |
| Gender | ||||||
| Female | Ref. | – | 0.5 | Ref. | – | 0.5 |
| Male | 1.21 | 0.67–2.18 | 1.24 | 0.66–2.35 | ||
| Race | ||||||
| White | Ref. | – | 0.6 | Ref. | – | 0.4 |
| Non-white | 1.29 | 0.52–3.21 | 1.58 | 0.57–4.41 | ||
| Age (per 5 yr) | 1.07 | 0.95–1.21 | 0.2 | 1.02 | 0.90–1.16 | 0.7 |
| CCI | ||||||
| 0 | Ref. | – | 0.019 | Ref. | – | 0.022 |
| ≥ 1 | 2.07 | 1.12–3.82 | 2.21 | 1.12–4.34 | ||
| BMI | 1.01 | 0.96–1.05 | 0.8 | 1.01 | 0.96–1.06 | 0.8 |
| Presentation | ||||||
| Incidental | Ref. | – | <0.0001 | Ref. | – | 0.002 |
| Local | 3.11 | 1.78–5.44 | 2.42 | 1.36–4.30 | ||
| Systemic | 4.72 | 1.96–11.38 | 3.82 | 1.48–9.87 | ||
| Tumor Size (per cm) | 1.20 | 1.10–1.30 | <0.0001 | 1.14 | 1.04–1.25 | 0.003 |
| Tumor Histology | ||||||
| Non-clear cell | Ref. | – | 0.2 | Ref. | – | 0.086 |
| Clear cell | 1.63 | 0.83–3.19 | 1.85 | 0.92–3.72 | ||
OR = odds ratio; CI = confidence interval; SWT = surgical waiting time; Ref = reference value; CCI = Charlson Comorbidity Index; BMI = body mass index.
Table 4b.
Multivariable Cox model for cancer-specific and overall survival after 9 months after diagnosis for patients with AJCC stage III and IV disease
| Cancer-specific survival | Overall survival | |||||
|---|---|---|---|---|---|---|
| HR | 95% CI | p value | HR | 95% CI | p value | |
| SWT (per mo) | 1.00 | 0.82–1.21 | >0.9 | 1.15 | 1.03–1.29 | 0.015 |
| Gender | ||||||
| Female | Ref. | – | 0.14 | Ref. | – | 0.5 |
| Male | 1.61 | 0.86–3.05 | 0.88 | 0.59–1.31 | ||
| Race | ||||||
| White | Ref. | – | 0.7 | Ref. | – | 0.3 |
| Non-white | 0.84 | 0.30–2.38 | 0.66 | 0.30–1.45 | ||
| Age (per 5 yr) | 1.01 | 0.99–1.03 | 0.3 | 1.04 | 1.02–1.06 | <0.0001 |
| CCI | ||||||
| 0 | Ref. | – | 0.15 | Ref. | – | 0.14 |
| ≥ 1 | 1.48 | 0.87–2.54 | 1.35 | 0.90–2.03 | ||
| BMI | 1.00 | 0.96–1.05 | 0.8 | 0.99 | 0.96–1.03 | 0.7 |
| Presentation | ||||||
| Incidental | Ref | – | 0.001 | Ref. | – | 0.003 |
| Local | 2.40 | 1.37–4.21 | 1.36 | 0.93–2.00 | ||
| Systemic | 4.01 | 1.90–8.45 | 2.57 | 1.48–4.45 | ||
| Tumor Size (per cm) | 1.09 | 1.01–1.17 | 0.020 | 1.06 | 1.00–1.12 | 0.061 |
| Tumor Histology | ||||||
| Non-clear cell | Ref. | – | 0.6 | Ref. | – | 0.8 |
| Clear cell | 1.20 | 0.64–2.24 | 0.94 | 0.62–1.44 | ||
HR = hazard ratio; CI = confidence interval; SWT = surgical waiting time; Ref = reference value; CCI = Charlson Comorbidity Index; BMI = body mass index.
Of the 267 patients with SWT >3 mo, 59 patients (22%) had a referral delay, 120 patients (45%) had treatment delay, and 88 patients (33%) had both. Of the 208 patients with a treatment delay, 51 (25%) had multiple reasons for this delay. The most common cause for treatment delay was evaluation and treatment of comorbidities apparent in 133/208 patients (64%), including treatment of cardiovascular disease, pulmonary disease and concurrent malignancies.
4. Discussion
The current study, evaluating the effect of prolonged SWT on the outcomes of nephrectomy for renal masses >4 cm, found patients with non-favorable tumor characteristics and fewer comorbidities were operated on earlier. No association between SWT and disease upstaging, recurrence or CSS was found; however, longer SWT was associated with decreased OS.
Prolonged SWT adversely affects treatment outcome in several malignancies including muscle-invasive bladder cancer.[4–6] However, this association may be attributed to the natural history of the disease, which differs among various cancers. Small renal masses have an average growth rate of 0.28 cm/year,[14] and a relatively large proportion of these tumors are benign or indolent malignancies with limited metastatic potential[15]; thus, active surveillance, especially for elderly or comorbidly ill patients, is a reasonable alternative to surgery for these tumors.[2, 16–19] Large renal masses have been associated with a higher rate of malignant histology, higher growth rates, and increased potential for metastatic disease; therefore, most patients with renal masses >4 cm are treated surgically.[15, 20–24] However, in a recent report, localized cT1b/T2 renal masses followed for a short period of time showed a mean growth rate of 0.44 cm/year and a limited metastatic potential, suggesting an initial period of active surveillance is reasonable in patients with significant competing risks and limited life expectancy.[25]
In a study by Bilimora and colleagues based on the National Cancer Database, delay >30 days for cancer treatment was associated with older age, black race, multiple comorbidities, and lower-stage disease.[3] Among patients with RCC, shorter SWT was associated with larger tumor size, higher tumor stage and grade, and symptomatic presentation,[7–9] similar to our results. Also, we found an association between longer SWT and older age, non-white race, and higher ASA and CCI scores. These associations are consistent with the selection bias seen in this cohort, likely representing the tendency of surgeons to operate more expeditiously on patients with obvious adverse tumor characteristics.
Few reports have evaluated the effect of SWT on treatment outcomes of nephrectomy for renal tumors >4 cm. Stec et al. reported on 655 patients with mean tumor size 6.4±4.4 cm and mean SWT of 1.2 months from the initial urologic consultation. Operations were performed within 3 months in 94.3% of patients. On multivariable analysis, OS, CSS and recurrence-free survival were not affected by SWT.[7] Martinez et al. reported on 354 RCC patients with mean tumor size 5.5±3.45 cm, and mean SWT of 1.6 months from the decision for surgical treatment. The authors triaged patients based on perceived tumor risk, optimizing SWT by clinical stage. In this setting, no significant association was found between SWT and disease progression; however, shorter SWT was associated with a higher recurrence rate, reflecting the surgeon’s increased priority for more aggressive tumors.[8] Recently, Kim et al. evaluated 319 patients who underwent RN for stage II or higher RCC. Mean SWT, from initial imaging to surgical resection, was 0.86 months; 96.9% of the patients underwent surgical resection within 3 months. SWT was not associated with pathological upstaging, recurrence-free survival or CSS, even when performing subgroup analysis according to the TNM stage and the presence or absence of symptoms prior to the operation.[9] In the current study which included patients with SWT >3 months and tumors >4cm, no significant association was found between SWT and oncologic outcomes. However, consistent with previous studies, disease characteristics indicative of tumor aggressiveness, including tumor size and histology, were significantly associated with both SWT and outcome.[26] Surgeon selection bias, rather than compromised cancer control, was also the likely cause of the association between longer SWT and worse OS, as we attribute this association to poorer preoperative health which led to both a surgical delay and worse OS.
In a study of radical cystectomy for invasive bladder cancer, surgical delay >3 months was observed to be related mainly to scheduling delay (46%), with only 15% of patients delayed due to comorbidities.[4] In a study of patients with small renal masses, the most common causes for delaying treatment, observed in 55% of patients, were patient-related, including refusal to undergo surgery, seeking multiple opinions, or failure to follow up.[16] In the current study, 78% of the patients with SWT >3 months had treatment delay, most commonly due to evaluation and treatment of comorbidities.
The limitations of our study include its retrospective nature and the selection bias associated with treating patients with more aggressive tumors earlier. The findings may not be generalizable to centers with different treatment patterns resulting in shorter SWT for all patients. In addition, the study included only patients who underwent PN or RN, and did not include patients who might have progressed during treatment delay and never received surgical treatment. However, that factor is unlikely to have affected our results: in a cohort of 373 non-metastatic patients with tumors >4 cm who were followed at our institution during the same years as the study cohort and did not eventually undergo nephrectomy, only three patients (1%) developed metastatic disease2. The true delay in treatment is unknown as most tumors are discovered incidentally; however, the time of initial diagnosis is the earliest point at which a patient may have been treated, and therefore is clinically appropriate. Finally, the effect of SWT on survival is confounded by certain patient and disease characteristics, such as age, tumor size and histology, which are associated with both SWT and survival. While the current and previous studies are limited by the fact that SWT cannot be randomly assigned to patients, these findings suggest that patient and tumor characteristics influence both extent of surgical delay and treatment outcome, and may aid in deciding when to operate. However, since heterogeneity in tumor growth patterns and current incomplete knowledge of determinants of aggressiveness and metastasis limit our ability to identify which tumors are likely to progress in the short term, surgery should be delayed only in the presence of other, competing, health risks.
5. Conclusion
In current practice, at the discretion of the operating surgeon, tumors with unfavorable characteristics are operated on earlier than those with favorable characteristics. Since SWT is determined based on disease characteristics, it is difficult to assess the effect of SWT separately from the effects of these characteristics; however, in this setting, longer SWT was not associated with worse oncologic outcomes for large localized renal tumors at a median followup of 4 years. Clinicians should continue to use patient and tumor characteristics to determine the best time to perform surgery in the presence of competing health risks. Identifying additional independent and reliable markers of tumor progression may aid in the decision to delay surgery when necessary.
Highlights.
21% of patients treated for renal tumors >4 cm had a surgical delay of >3 months.
Larger, symptomatic tumors were associated with a shorter surgical delay.
SWT was not associated with disease upstaging at the time of surgery, recurrence or CSS, but was associated with OS.
Treatment of comorbidities was a common cause for surgical delay of >3 months.
Acknowledgments
Supported by the Sidney Kimmel Center for Prostate and Urologic Cancers, the Hanson Family Renal Cancer Research Fund and Cancer Center Support Grant P30 CA008748 to PI: Craig B. Thompson, MD.
Footnotes
Publisher's Disclaimer: This is a PDF file of an unedited manuscript that has been accepted for publication. As a service to our customers we are providing this early version of the manuscript. The manuscript will undergo copyediting, typesetting, and review of the resulting proof before it is published in its final citable form. Please note that during the production process errors may be discovered which could affect the content, and all legal disclaimers that apply to the journal pertain.
Unpublished data from the Memorial Sloan Kettering Cancer Center kidney cancer database.
Conflict of Interest
The authors declare that they have no conflict of interest.
References
- 1.Ljungberg B, Bensalah K, Canfield S, Dabestani S, Hofmann F, Hora M, et al. EAU guidelines on renal cell carcinoma: 2014 update. Eur Urol. 2015;67:913–24. doi: 10.1016/j.eururo.2015.01.005. [DOI] [PubMed] [Google Scholar]
- 2.Jewett MA, Mattar K, Basiuk J, Morash CG, Pautler SE, Siemens DR, et al. Active surveillance of small renal masses: progression patterns of early stage kidney cancer. Eur Urol. 2011;60:39–44. doi: 10.1016/j.eururo.2011.03.030. [DOI] [PubMed] [Google Scholar]
- 3.Bilimoria KY, Ko CY, Tomlinson JS, Stewart AK, Talamonti MS, Hynes DL, et al. Wait times for cancer surgery in the United States: trends and predictors of delays. Ann Surg. 2011;253:779–85. doi: 10.1097/SLA.0b013e318211cc0f. [DOI] [PubMed] [Google Scholar]
- 4.Lee CT, Madii R, Daignault S, Dunn RL, Zhang Y, Montie JE, et al. Cystectomy delay more than 3 months from initial bladder cancer diagnosis results in decreased disease specific and overall survival. J Urol. 2006;175:1262–7. doi: 10.1016/S0022-5347(05)00644-0. discussion 7. [DOI] [PubMed] [Google Scholar]
- 5.Gore JL, Lai J, Setodji CM, Litwin MS, Saigal CS. Mortality increases when radical cystectomy is delayed more than 12 weeks: results from a Surveillance, Epidemiology, and End Results-Medicare analysis. Cancer. 2009;115:988–96. doi: 10.1002/cncr.24052. [DOI] [PMC free article] [PubMed] [Google Scholar]
- 6.Kulkarni GS, Urbach DR, Austin PC, Fleshner NE, Laupacis A. Longer wait times increase overall mortality in patients with bladder cancer. J Urol. 2009;182:1318–24. doi: 10.1016/j.juro.2009.06.041. [DOI] [PubMed] [Google Scholar]
- 7.Stec AA, Coons BJ, Chang SS, Cookson MS, Herrell SD, Smith JA, Jr, et al. Waiting time from initial urological consultation to nephrectomy for renal cell carcinoma–does it affect survival? J Urol. 2008;179:2152–7. doi: 10.1016/j.juro.2008.01.111. [DOI] [PMC free article] [PubMed] [Google Scholar]
- 8.Martinez CH, Martin P, Chalasani V, Williams AK, Luke PP, Izawa JI, et al. How long can patients with renal cell carcinoma wait for surgery without compromising pathological outcomes? Can Urol Assoc J. 2011;5:E148–51. doi: 10.5489/cuaj.10035. [DOI] [PMC free article] [PubMed] [Google Scholar]
- 9.Kim KH, You D, Jeong IG, Song C, Hong JH, Ahn H, et al. The impact of delaying radical nephrectomy for stage II or higher renal cell carcinoma. J Cancer Res Clin Oncol. 2012;138:1561–7. doi: 10.1007/s00432-012-1230-2. [DOI] [PMC free article] [PubMed] [Google Scholar]
- 10.Charlson ME, Pompei P, Ales KL, MacKenzie CR. A new method of classifying prognostic comorbidity in longitudinal studies: development and validation. J Chronic Dis. 1987;40:373–83. doi: 10.1016/0021-9681(87)90171-8. [DOI] [PubMed] [Google Scholar]
- 11.Lopez-Beltran A, Scarpelli M, Montironi R, Kirkali Z. 2004 WHO classification of the renal tumors of the adults. Eur Urol. 2006;49:798–805. doi: 10.1016/j.eururo.2005.11.035. [DOI] [PubMed] [Google Scholar]
- 12.Edge SB, Compton CC. The American Joint Committee on Cancer: the 7th edition of the AJCC cancer staging manual and the future of TNM. Ann Surg Oncol. 2010;17:1471–4. doi: 10.1245/s10434-010-0985-4. [DOI] [PubMed] [Google Scholar]
- 13.Dafni U. Landmark analysis at the 25-year landmark point. Circ Cardiovasc Qual Outcomes. 2011;4:363–71. doi: 10.1161/CIRCOUTCOMES.110.957951. [DOI] [PubMed] [Google Scholar]
- 14.Chawla SN, Crispen PL, Hanlon AL, Greenberg RE, Chen DY, Uzzo RG. The natural history of observed enhancing renal masses: meta-analysis and review of the world literature. J Urol. 2006;175:425–31. doi: 10.1016/S0022-5347(05)00148-5. [DOI] [PubMed] [Google Scholar]
- 15.Frank I, Blute ML, Cheville JC, Lohse CM, Weaver AL, Zincke H. Solid renal tumors: an analysis of pathological features related to tumor size. J Urol. 2003;170:2217–20. doi: 10.1097/01.ju.0000095475.12515.5e. [DOI] [PubMed] [Google Scholar]
- 16.Crispen PL, Viterbo R, Fox EB, Greenberg RE, Chen DY, Uzzo RG. Delayed intervention of sporadic renal masses undergoing active surveillance. Cancer. 2008;112:1051–7. doi: 10.1002/cncr.23268. [DOI] [PubMed] [Google Scholar]
- 17.Rais-Bahrami S, Guzzo TJ, Jarrett TW, Kavoussi LR, Allaf ME. Incidentally discovered renal masses: oncological and perioperative outcomes in patients with delayed surgical intervention. BJU international. 2009;103:1355–8. doi: 10.1111/j.1464-410X.2008.08242.x. [DOI] [PubMed] [Google Scholar]
- 18.Mason RJ, Abdolell M, Trottier G, Pringle C, Lawen JG, Bell DG, et al. Growth kinetics of renal masses: analysis of a prospective cohort of patients undergoing active surveillance. Eur Urol. 2011;59:863–7. doi: 10.1016/j.eururo.2011.02.023. [DOI] [PubMed] [Google Scholar]
- 19.Jewett M, Rendon R, Dranitsaris G, Drachenberg D, Tanguay S, Donnelly B, et al. Does prolonging the time to renal cancer surgery affect long-term cancer control: a systematic review of the literature. The Canadian journal of urology. 2006;13(Suppl 3):54–61. [PubMed] [Google Scholar]
- 20.Staehler M, Haseke N, Stadler T, Zilinberg E, Nordhaus C, Nuhn P, et al. The growth rate of large renal masses opposes active surveillance. BJU international. 2010;105:928–31. doi: 10.1111/j.1464-410X.2009.08840.x. [DOI] [PubMed] [Google Scholar]
- 21.Lamb GW, Bromwich EJ, Vasey P, Aitchison M. Management of renal masses in patients medically unsuitable for nephrectomy–natural history, complications, and outcome. Urology. 2004;64:909–13. doi: 10.1016/j.urology.2004.05.039. [DOI] [PubMed] [Google Scholar]
- 22.Mues AC, Haramis G, Badani K, Gupta M, Benson MC, McKiernan JM, et al. Active surveillance for larger (cT1bN0M0 and cT2N0M0) renal cortical neoplasms. Urology. 2010;76:620–3. doi: 10.1016/j.urology.2010.04.021. [DOI] [PubMed] [Google Scholar]
- 23.Umbreit EC, Shimko MS, Childs MA, Lohse CM, Cheville JC, Leibovich BC, et al. Metastatic potential of a renal mass according to original tumour size at presentation. BJU international. 2012;109:190–4. doi: 10.1111/j.1464-410X.2011.10184.x. discussion 4. [DOI] [PubMed] [Google Scholar]
- 24.Guethmundsson E, Hellborg H, Lundstam S, Erikson S, Ljungberg B. Metastatic potential in renal cell carcinomas </=7 cm: Swedish Kidney Cancer Quality Register data. Eur Urol. 2011;60:975–82. doi: 10.1016/j.eururo.2011.06.029. [DOI] [PubMed] [Google Scholar]
- 25.Mehrazin R, Smaldone MC, Kutikov A, Li T, Tomaszewski JJ, Canter DJ, et al. Growth kinetics and short-term outcomes of cT1b and cT2 renal masses under active surveillance. J Urol. 2014;192:659–64. doi: 10.1016/j.juro.2014.03.038. [DOI] [PMC free article] [PubMed] [Google Scholar]
- 26.Keegan KA, Schupp CW, Chamie K, Hellenthal NJ, Evans CP, Koppie TM. Histopathology of surgically treated renal cell carcinoma: survival differences by subtype and stage. J Urol. 2012;188:391–7. doi: 10.1016/j.juro.2012.04.006. [DOI] [PMC free article] [PubMed] [Google Scholar]