Abstract
Background & Aims
Contribution of hepatic stellate cells (HSCs), portal fibroblasts (PFs), and mesothelial cells (MCs) to myofibroblasts is not fully understood due to insufficient availability of markers and isolation methods. The present study aimed to isolate these cells, characterize their phenotypes, and examine their contribution to myofibroblasts in liver fibrosis.
Methods
Liver fibrosis was induced in Collagen1a1-green fluorescent protein (Col1a1GFP) mice by bile duct ligation (BDL), 3,5-diethoxycarbonyl-1,4-dihydrocollidine (DDC) diet, or CCl4 injections. Combining vitamin A (VitA) lipid autofluorescence and expression of GFP and glycoprotein M6a (GPM6A), we separated HSCs, PFs, and MCs from normal and fibrotic livers by fluorescence-activated cell sorting (FACS).
Results
Normal Col1a1GFP livers broadly expressed GFP in HSCs, PFs, and MCs. Isolated VitA+ HSCs expressed reelin, whereas VitA−GFP+GPM6A− PFs expressed ectonucleoside triphosphate diphosphohydrolase-2 and elastin. VitA−GFP+GPM6A+ MCs expressed keratin 19, mesothelin, and uroplakin 1b. Transforming growth factor (TGF)-β1 treatment induced the transformation of HSCs, PFs, and MCs into myofibroblasts in culture. TGF-β1 suppressed cyclin D1 mRNA expression in PFs but not in HSCs and MCs. In biliary fibrosis, PFs adjacent to the bile duct expressed α-smooth muscle actin. FACS analysis revealed that HSCs are the major source of GFP+ myofibroblasts in the injured Col1a1GFP mice after DDC or CCl4 treatment. Although PFs partly contributed to GFP+ myofibroblasts in the BDL model, HSCs were still dominant source of myofibroblasts.
Conclusion
HSCs, PFs, and MCs have distinct phenotypes, and PFs partly contribute to myofibroblasts in the portal triad in biliary fibrosis.
Keywords: Entpd2, Fibrosis, Gpm6a, Mesothelin, myofibroblasts, Reelin, Uroplakin
Introduction
Hepatic stellate cells (HSCs) reside in the space of Disse in the liver and store vitamin A (VitA) lipids as retinyl ester [1,2]. Upon liver injury, HSCs transform into myofibroblasts that express α-smooth muscle actin (ACTA2)[1,2]. Myofibroblasts form fibrous scars, actively synthesize extracellular matrices and proinflammatory cytokines, and participate in the progression from an injured liver to fibrosis and cirrhosis. Cell lineage tracing indicated that HSCs are mesodermal in origin and are the major source of myofibroblasts[3–5]. Clinical cases and animal studies suggest that fibrosis is reversible[6–9]. During fibrosis regression, activated HSCs undergo apoptosis or revert to quiescent HSCs[6,8,9]. Thus, the suppression of HSC activation has been considered to be a therapeutic target for treating liver fibrosis.
In addition to HSCs, different types of liver mesenchymal cells also differentiate into myofibroblasts in fibrosis. Portal fibroblasts (PFs) around the bile duct in the portal tract express COL15A1, elastin (ELN), ectonucleoside triphosphate diphosphohydrolase-2 (ENTPD2/NTPDase2/CD39L1), and THY1 and do not store VitA lipids in the rat liver[10–14]. In biliary fibrosis, PFs are believed to be the source of myofibroblasts in the portal area. In addition to PFs, second-layer cells (SLCs) in the central vein and capsular fibroblasts (CFs) beneath the mesothelium were characterized based on their morphology and location in the liver[15]. However, little is known about how these cells contribute to fibrosis because the availability of markers and isolation methods for each cell type is limited.
Mesothelial cells (MCs) form a single epithelial cell sheet and cover the liver surface[16]. MCs express glycoprotein M6A (GPM6A), mesothelin (MSLN), and podoplanin (PDPN)[16–18]. During liver development, mesodermal MCs migrate inward from the liver surface and give rise to both HSCs and PFs[19]. Upon liver injury, MCs give rise to HSCs or myofibroblasts near the liver surface, depending on the etiology[16,18]. Similar to HSC activation, MCs change their phenotype to myofibroblasts in response to transforming growth factor-β (TGF-β)[16].
In the present study, we separated HSCs, PFs, and MCs by fluorescence-activated cell sorting (FACS) from collagen1a1 promoter-green fluorescent protein (Col1a1GFP) transgenic mouse livers and quantified contribution of these cells to myofibroblasts in liver fibrosis.
Materials and Methods
Mouse models
Col1a1GFP mice were obtained from Dr. David Brenner[20]. Uroplakin 1b-red fluorescent protein (Upk1bRFP) knock-in mice were purchased from the Jackson Laboratory (Bar Harbor, ME). Fibrosis was induced by bile duct ligation (BDL) for 3 weeks, 0.1% 3,5-diethoxycarbonyl-1,4-dihydrocollidine (DDC) diet for 1 month, or CCl4 injection 12 times as previously described[4,16]. All animal experiments were performed in accordance with the NIH guidelines under the protocol approved by the IACUC at the University of Southern California.
Immunohistochemistry
Mouse liver tissues were embedded in freezing medium without fixation or after fixation with 4% paraformaldehyde. Cryosections (7 µm) were used for immunohistochemistry. After blocking, the sections were incubated with primary antibodies for 1 hour. The primary antibodies and additional treatment are listed in Supplementary Table 1. The primary antibodies were detected with secondary antibodies conjugated with AlexaFluor dyes. Nuclei were counterstained with DAPI. Signals were captured with 90i microscope (Nikon, Melville, NY).
The paraffin-embedded specimens for normal human livers (n=2) and alcohol-induced fibrosis (n=2) at the Harbor-UCLA Medical Center or biliary atresia (n=3) at Children’s Hospital Los Angeles were used for immunohistochemistry under study protocols approved by the institutional review boards (HS-11-00476, CCI-10-00148). The primary antibodies were detected with SuperPicure HRP Polymer (Life Technologies, Grand Island, NY).
Cell isolation
Nonparenchymal cells (NPCs) were isolated by the NPC core supported by NIAAA grant (R24AA012885)[16]. Mouse livers were perfused through the superior vena cava by 0.5% pronase (Roche, Indianapolis, IN) and 0.044% collagenase (Sigma, St. Louis, MO). After agitation of the digested tissue with 10 µg/ml DNase, the cells were placed on the top of four OptiPrep gradients (1.034, 1.043, 1.058, 1.085) in Beckman ultracentrifuge tubes and were centrifuged in the SW-41Ti rotor at 20,000 rpm for 15 minutes. The 1.058 fraction was used as NPCs.
FACS
NPCs were incubated with the anti-GPM6A antibody (MBL, Woburn, MA) at 1,500-fold dilution for 30 minutes. After washing, the primary antibody was detected with anti-rat IgG AlexaFluor647 (Life Technologies). After excluding propidium iodide (PI)+ dead cells, PI− live cells were analyzed with a krypton laser and a 424nm filter to detect VitA autofluorescence with FACS Aria I (BD Bioscience, San Jose, CA) in the USC Flow Cytometry Core[4,16]. The VitA-fraction was further separated based on the signal intensities for GPM6A and GFP.
MCs were isolated from the liver surface as previously reported[16]. After whole liver digestion with 1 mg/ml pronase, the cells were incubated with the anti-GPM6A antibody. The primary antibody was detected with anti-rat IgG AlexaFluor568 antibodies and VitA−GPM6A+ MCs were sorted by FACS.
Cell culture and immunocytochemistry
After FACS, the cells (2×10⁴ cells) were plated on collagen-coated 24-well plates in DMEM containing 10% FBS. The cells were treated with 10 ng/ml TGF-β1 (Sigma) or 100 pg/ml PDGF-BB (eBioscience, San Diego, CA). Immunocytochemistry was performed as previously described[16,18]. The cells cultured on a glass cover were fixed with 4% paraformaldehyde. After blocking, the sections were incubated with primary antibodies. The primary antibodies are listed in Supplementary Table 1. The primary antibodies were detected with secondary antibodies conjugated with AlexaFluor568.
QPCR
Total RNA was extracted with RNAqueous Micro (Life Technologies) and cDNA was synthesized using SuperScript III[3]. QPCR was performed with SYBR FAST ROX (Kapa Biosystems, Wilmington, MA) using the ViiA7 Real-Time PCR. The samples were analyzed in triplicate. Each value was normalized against the Gapdh value. Primer sequences are listed in Supplementary Table 2.
Microarray analysis
After FACS sorting, total RNA was extracted, and the microarray probes were synthesized using the Ovation RNA amplification system (Nugen, San Carlos, CA) as previously described[3].
Statistical analysis
Statistical significance was assessed by ANOVA followed by post-hoc Tukey HSD test among multiple samples or Student’s t-test between two samples. A P value of less than 0.05 was considered statistically significant.
Results
Broad expression of GFP in the Col1a1GFP mouse liver
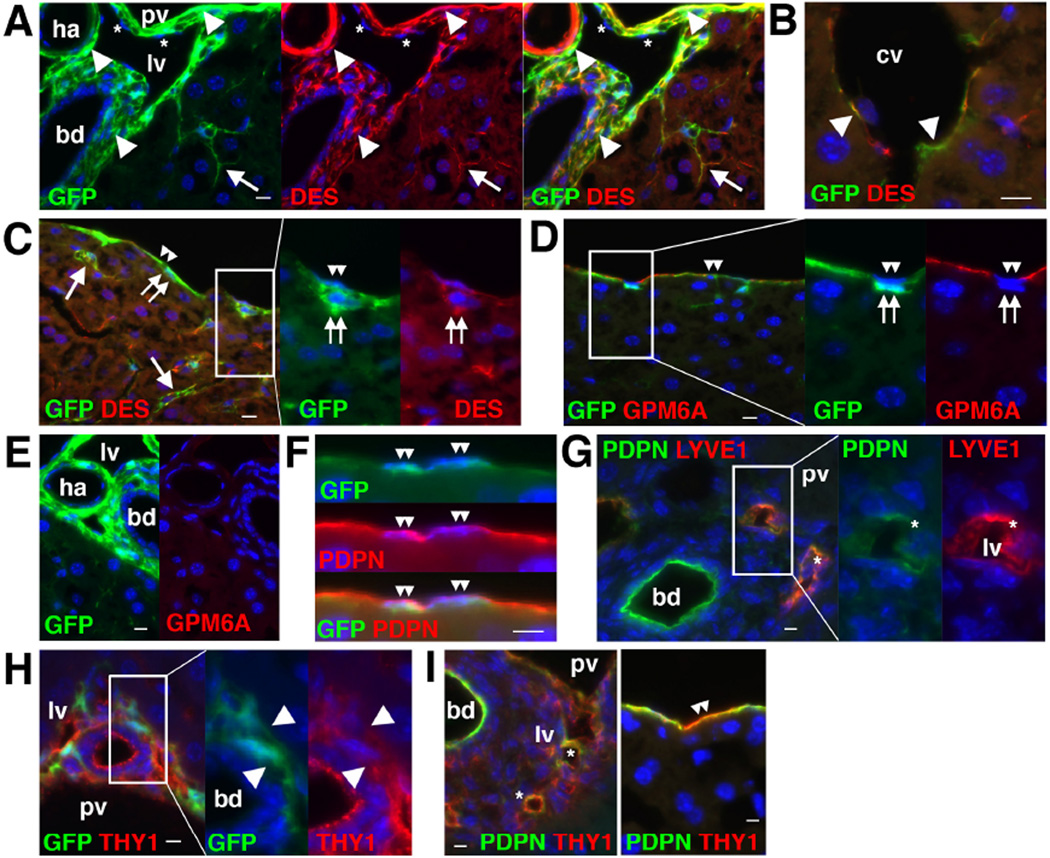
Immunohistochemistry showed that the normal Col1a1GFP liver expresses GFP in some desmin (DES)+ HSCs in the sinusoid, as well as in the PFs adjacent to the bile duct and smooth muscle cells (SMCs) in the hepatic artery and portal vein (Fig. 1A). GFP expression was also observed in possible DES+ SLCs around the central vein as well as in DES+ CFs beneath MCs (Fig. 1B,C). GFP expression was observed in MCs expressing GPM6A which is an MC marker (Fig. 1D). No GPM6A expression was observed in the portal area (Fig. 1E). PDPN was expressed in MCs, bile duct, and LYVE1+ lymphatic vessels adjacent to the portal vein (Fig. 1F,G). THY1 expression was evident in PFs, lymphatic vessels, and some MCs (Fig. 1H,I).
Figure 1. Expression of GFP in HSCs, PFs, SMCs, SLCs, CFs, and MCs in Col1a1GFP mouse livers.
Expression of GFP and different cell markers was examined by immunohistochemistry in the Col1a1GFP (A–F,H) or wild-type (G,I) mouse livers. (A) GFP expression is observed in DES+ HSCs (arrows), PFs (arrowheads) adjacent to bile duct (bd), and SMCs (arrowheads) in the hepatic artery (ha) and portal vein (pv). Asterisks indicate lymphatic vessels (lv). (B) GFP expression is observed in DES+ SLCs (arrowheads) in the central vein (cv). (C) MCs (double arrowheads) and CFs (double arrows) express GFP. Arrows indicate GFP+ HSCs. (D) Both GPM6A+ MCs (double arrowheads) and GPM6A− CFs (double arrows) express GFP. (E) No GPM6A expression in the portal triad. (F) PDPN+ MCs express GFP (double arrowheads). (G) Bile duct and lymphatic vessels (asterisks) are positive for PDPN. (H) THY1+ PFs express GFP (arrowheads). (I) Expression of THY1 in lymphatic vessels (asterisks). Some MCs express THY1 (double arrowheads). Bar: 10 µm.
Separating HSCs with FACS
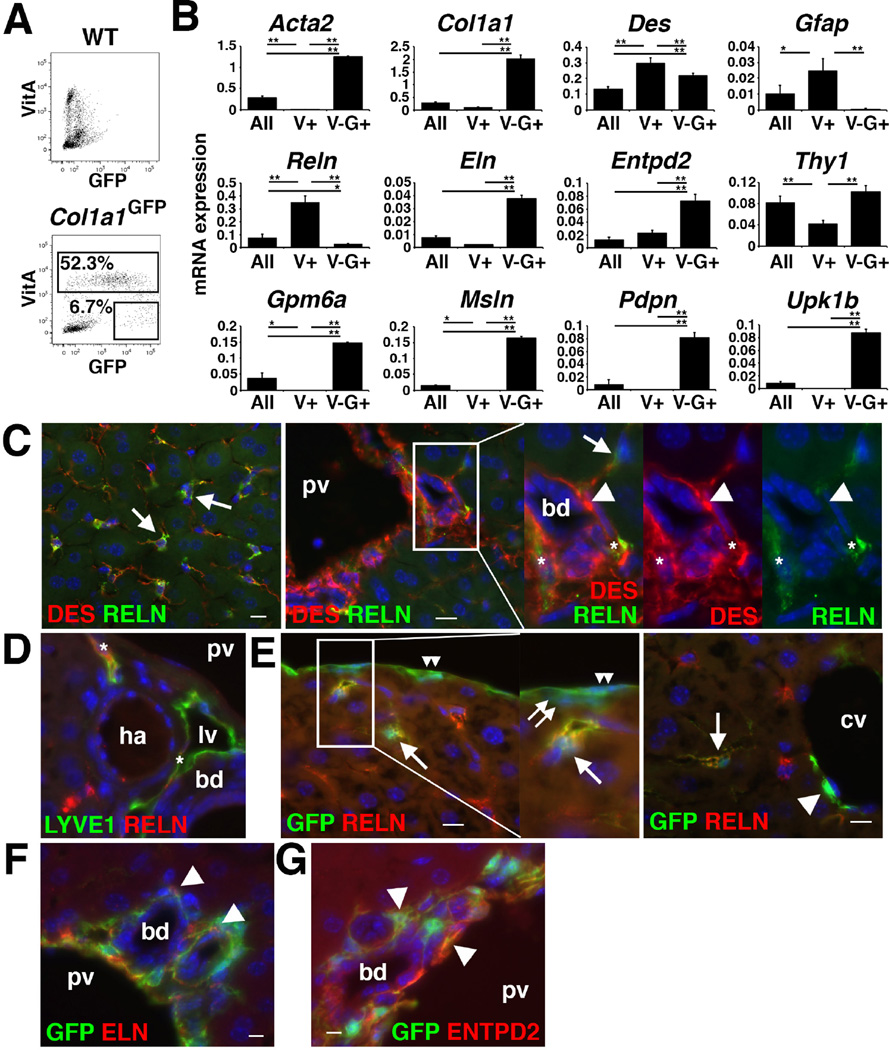
Next, we attempted to isolate HSCs and PFs based on the autofluorescence of VitA in HSCs and GFP expression by FACS. NPCs prepared from the Col1a1GFP mouse showed VitA+ (52.3±14.1%) and VitA−GFP+ (6.7±3.0%) populations (Fig. 2A). To characterize these populations, we surveyed gene expression using microarray and found that VitA+ HSCs highly express Reelin (Reln) (Supplementary Table 3). We validated the high expression of Reln mRNA in VitA+ HSCs by QPCR (Fig. 2B). The VitA+ HSCs also expressed Des and Gfap (Fig. 2B). Immunohistochemistry showed a specific expression of RELN in DES+ HSCs in the sinusoid (Fig. 2C). In the portal triad, lymphatic vessels were also positive for RELN (Fig. 2C,D). In the Col1a1GFP livers, RELN expression was observed in GFP+ HSCs, but not in MCs, CFs, and SLCs (Fig. 2E). These data indicate that RELN is a specific marker for HSCs and lymphatic vessels in the liver.
Figure 2. Separation of VitA+ HSCs and VitA−GFP+ population from Col1a1GFP livers.
(A) VitA+ and VitA−GFP+ populations were sorted from Col1a1GFP NPCs by FACS (n=3). Wild-type NPCs were used as negative controls. (B) QPCR of NPCs before FACS (All), VitA+ HSCs (V+), and VitA−GFP+ (V–G+) population separated from the Col1a1GFP liver. *P<0.05, **P<0.01. (C–G) Immunohistochemistry of the wild-type (C,D) and Col1a1GFP (E–G) mouse livers. (C) RELN is expressed in HSCs (arrows) and lymphatic vessels (asterisks), but not in PFs (arrowheads) around the bile duct (bd) and portal vein (pv). (D) RELN is expressed in LYVE1+ lymphatic vessels (asterisks). (E) No RELN expression in MCs (double arrowheads), CFs (double arrows), and SLCs (an arrowhead) adjacent to the central vein (cv). (F,G) GFP+ PFs (arrowheads) express ELN and ENTPD2. Bar: 10 µm.
The presence of PFs and MCs in the VitA−GFP+ population
Microarray analysis and QPCR showed that the VitA−GFP+ population highly expressed PF markers including Eln and Entpd2 (Supplementary Table 3, Fig. 2B). We confirmed expression of ELN and ENTPD2 in the GFP+ PFs of the Col1a1GFP livers (Fig. 2F,G).
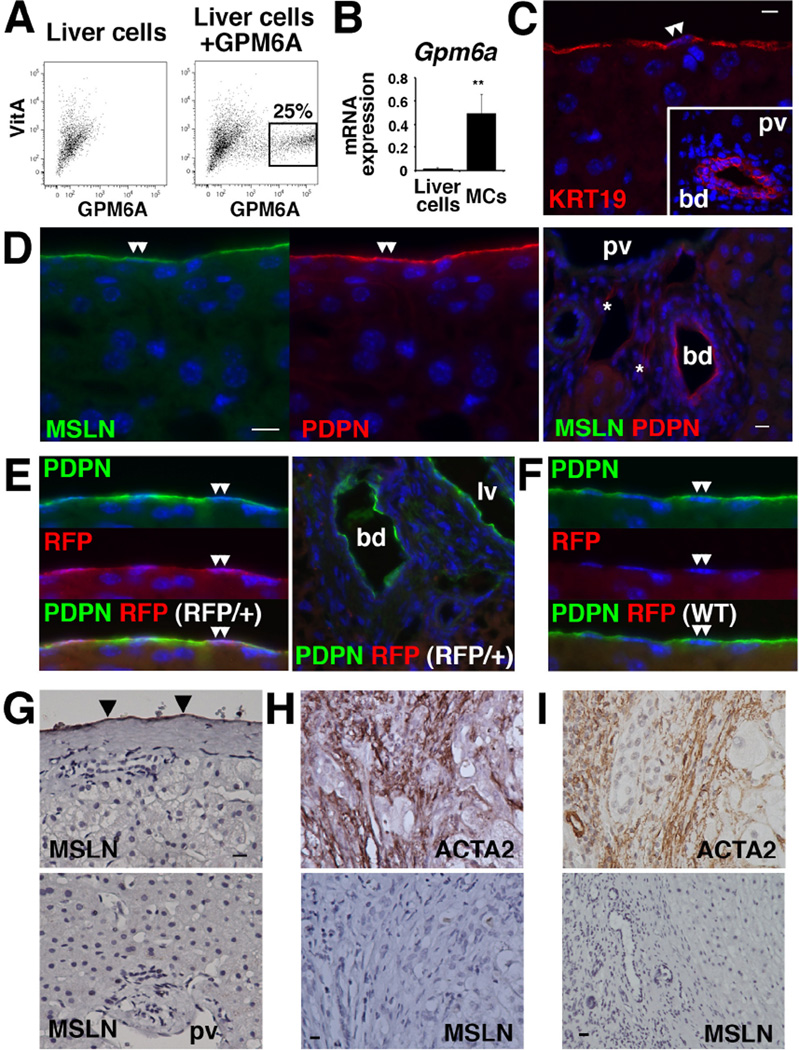
We also found that the VitA−GFP+ population expresses MC markers including Gpm6a, Msln, Pdpn, and Upk1b (Supplementary Table 3, Fig. 2B). Iwaisako et al. reported the separation of a similar VitA−GFP+ population from the Col1a1GFP mouse and identified MSLN as a PF marker[21]. Given that both MCs and PFs express GFP (Fig. 1A,C), we assumed that both MCs and PFs are enriched in the VitA−GFP+ population according to FACS. To test our assumption, we reevaluated the expression of MC markers in mouse livers. We isolated VitA−GPM6A+ MCs by FACS (Fig. 3A). Purified MCs highly expressed Gpm6a mRNA (Fig. 3B). Microarray analysis of VitA−GPM6A+ MCs revealed high expression of Col1a1, Gpm6a, Krt19, Msln, Pdpn, and Upk1b mRNAs (Supplementary Table 3). KRT19 expression in MCs and bile duct was confirmed by immunohistochemistry (Fig. 3C). MSLN expression was exclusively observed in MCs but not in PFs (Fig. 3D). Using Upk1bRFP/+ mice, we confirmed exclusive expression of RFP in MCs (Fig. 3E,F). Based on these data, we concluded that PFs and MCs are enriched in the VitA−GFP+ population.
Figure 3. Expression of MC markers in mouse and human livers.
(A) Isolation of MCs from mouse liver with FACS using anti-GPM6A antibodies. VitA−GPM6A+ MCs were sorted for QPCR and microarray analysis (n=3). (B) QPCR of Gpm6a mRNA in liver cells before FACS and VitA−GPM6A+ MCs. **P<0.01. (C–F) Immunohistochemistry of wild-type (C,D,F) and Upk1bRFP/+ (E) livers. (C) MCs (double arrowheads) and bile duct (bd) express KRT19. (D) MSLN is expressed in the MCs (double arrowheads) but not in the PFs. Asterisks indicate lymphatic vessels. (E) Upk1bRFP/+ liver shows RFP expression in the MCs (double arrowheads). (F) No RFP expression in the control Upk1b+/+ liver. (G–I) Immunohistochemistry of human liver specimens. (G) MSLN is exclusively expressed in MCs (arrowheads) in normal livers. (H) Biliary atresia specimens show ACTA2 expression in the portal area. Myofibroblasts are negative for MSLN. (I) ACTA2+ myofibroblasts in alcohol-induced fibrosis are negative for MSLN. Bar: 10 µm.
In normal human livers, MSLN was exclusively expressed in MCs and no MSLN expression was observed in the portal area (Fig. 3G). Fibrotic livers caused by biliary atresia or chronic alcohol abuse showed the accumulation of ACTA2+ myofibroblasts in the portal area and these myofibroblasts were negative for MSLN (Fig. 3H,I). We concluded that MSLN is a marker for MCs in both mouse and human livers.
Enrichment of PFs by FACS
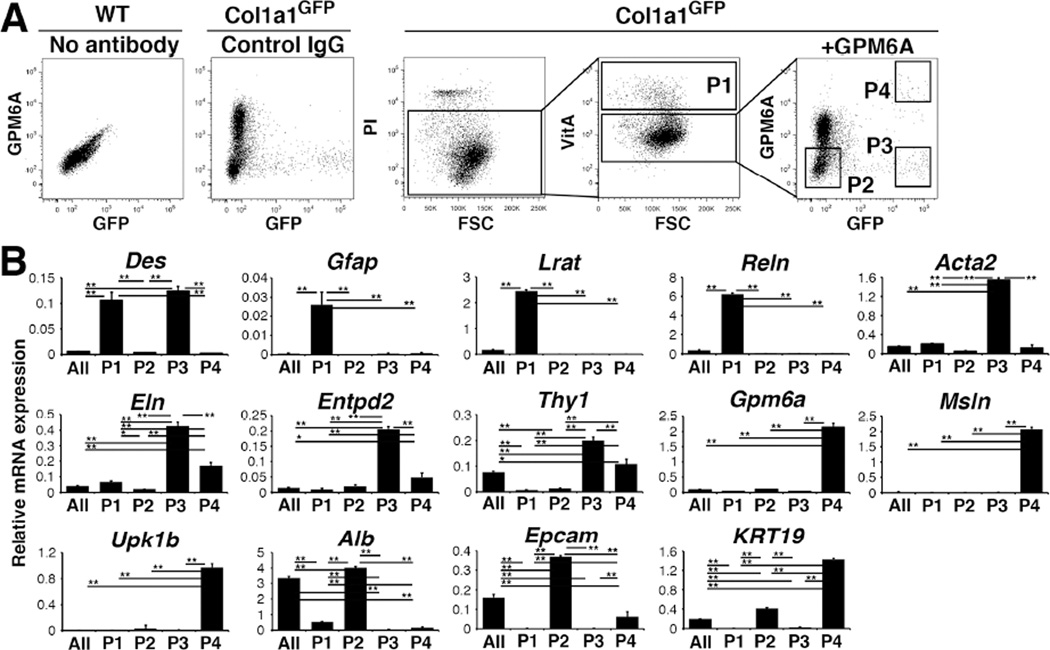
To enrich PFs from the heterogeneous VitA−GFP+ population, we subtracted GPM6A+ MCs and enriched PFs as VitA−GFP+GPM6A− cells. PI− live cells were separated into VitA+ HSCs (P1, 6.3±2.0%, n=8) and VitA− population, and then the VitA− population was further separated into P2 (52.2±12.3%), P3 (1.1±0.3%), and P4 (0.3±0.2%) populations based on the signal intensities for GPM6A and GFP (Fig. 4A). QPCR confirmed enrichment of HSCs in the VitA+ P1 population that expresses Des, Gfap, Lrat, and Reln mRNAs but not markers for PFs (Eln, Entpd2) and MCs (Gpm6a, Msln, Upk1b) (Fig. 4B). The P2 population expressed markers for hepatocytes (Alb) and cholangiocytes (Epcam, Krt19), without enriching other cell markers (Fig. 4B). The P3 population expressed Des, Eln, and Entpd2 but not HSC markers or MC markers (Fig. 4B), suggesting the enrichment of PFs. In addition, high Acta2 mRNA expression suggests the presence of SMCs in this population. The P4 population expressed markers for MCs including Krt19 (Fig. 4B).
Figure 4. Separation of HSCs, PFs, and MCs from the Col1a1GFP livers by FACS.
(A) NPCs prepared from wild-type or Col1a1GFP livers were stained with PI and anti-GPM6A antibodies. PI− cells were analyzed for autofluorescence of VitA and VitA+ HSCs were sorted (P1). The VitA− fraction was further analyzed for the expression of GPM6A and GFP into P2–P4 factions. Wild-type or Col1a1GFP NPCs incubated with the isotype IgG were used as negative controls. (B) QPCR of cells before FACS (All) and P1–P4 fractions obtained by FACS. *P<0.05, **P<0.01.
Myofibroblastic conversion of HSCs, PFs, and MCs
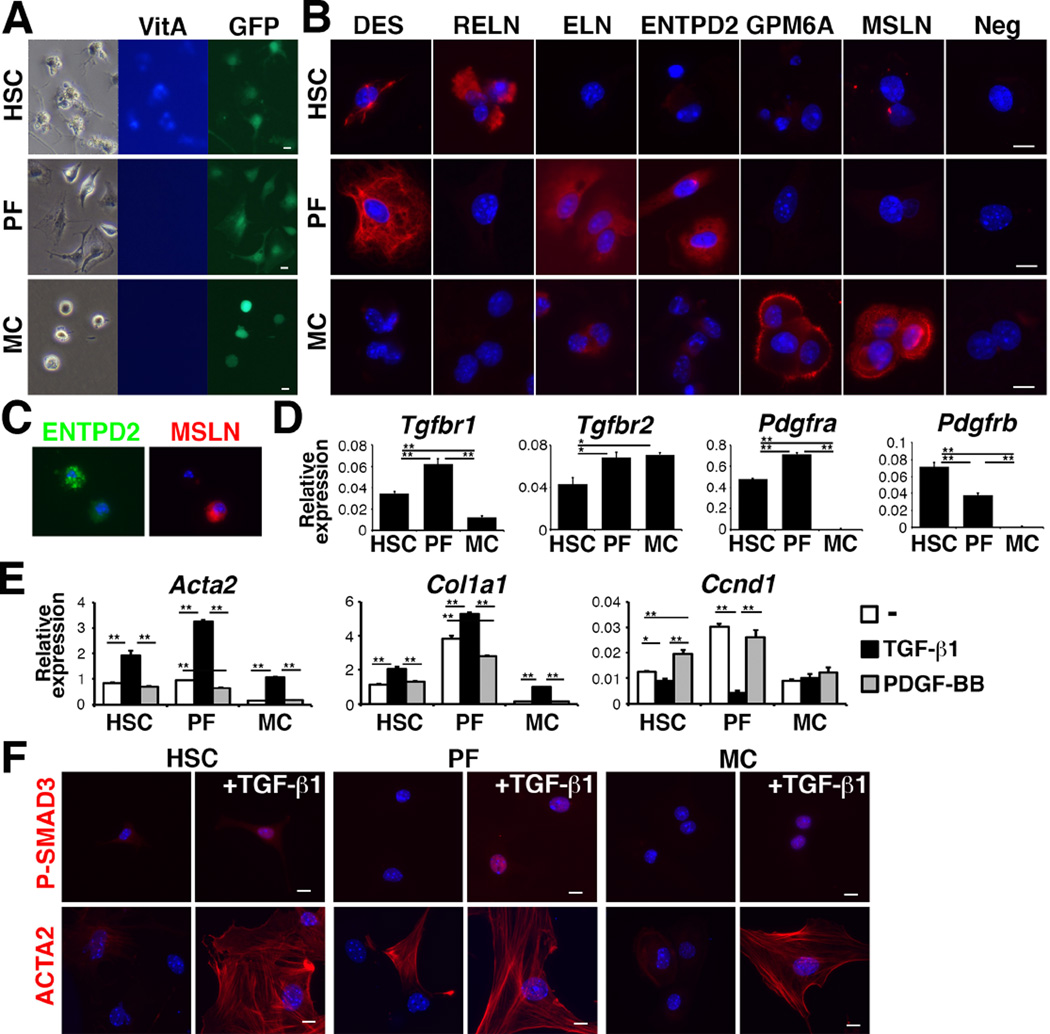
After sorting P1-HSCs, P3-PFs, and P4-MCs from normal Col1a1GFP livers by FACS, we analyzed the phenotypic changes of these cells in culture. After 3 days in culture, HSCs showed autofluorescence of VitA and dendritic processes (Fig. 5A). PFs showed fibroblastic morphology, without VitA autofluorescence. MCs exhibited a round shape and did not show VitA autofluorescence. Immunocytochemistry showed the expression of DES and RELN in the HSCs, but not in the MCs (Fig. 5B). The PFs expressed DES, ELN, and ENTPD2 (Fig. 5B). Only the MCs expressed GPM6A and MSLN (Fig. 5B). ELN was weakly expressed in MCs (Fig. 5B). We confirmed that ENTPD2+ PFs are negative for MSLN in cultured NPCs (Fig. 5C).
Figure 5. Differential responses of HSCs, PFs, and MCs against TGF-β1 and PDGF-BB.
(A) Culture of HSCs, PFs, and MCs purified from Col1a1GFP livers by FACS. (B) Immunocytochemistry of HSCs, PFs, and MCs on day-3 in culture. (C) Immunocytochemistry of NPCs for ENTPD2 and MSLN 24 hours after plating. (D) QPCR of the HSCs, PFs, and MCs. *P<0.05; **P<0.01. (E) QPCR of HSCs, PFs, and MCs treated with either TGF-β1 or PDGF-BB. (F) Immunocytochemistry of P-SMAD3 or ACTA2 in cultured HSCs, PFs, and MCs treated with TGF-β1 for 3 hours (P-SMAD3) or for 3 days (ACTA2). Bar: 10 µm.
QPCR showed that these cells expressed Tgfbr1 and Tgfbr2 mRNAs (Fig. 5D). MCs did not express Pdgfra and Pdgfrb mRNAs (Fig. 5D). After treatment with TGF-β1, HSCs, PFs, and MCs increased the expression of Acta2 and Col1a1 mRNAs (Fig. 5E). Interestingly, TGF-β1 strongly suppressed Cyclin D1 (Ccnd1) mRNA in the PFs but not in MCs (Fig. 5E). PDGF-BB induced Ccnd1 mRNA only in the HSCs (Fig. 5E). TGF-β1 induced the nuclear localization of P-SMAD3, a downstream effector of TGF-β signaling, in HSCs, PFs, and MCs (Fig. 5F). These cells differentiated into ACTA2+ myofibroblasts by TGF-β1 (Fig. 5F). These data indicate that even though HSCs, PFs, and MCs have the differentiation potential to myofibroblasts, their proliferation is differently regulated by TGF-β1 and PDGF-BB.
Expression of HSC, PF and MC markers in fibrotic livers
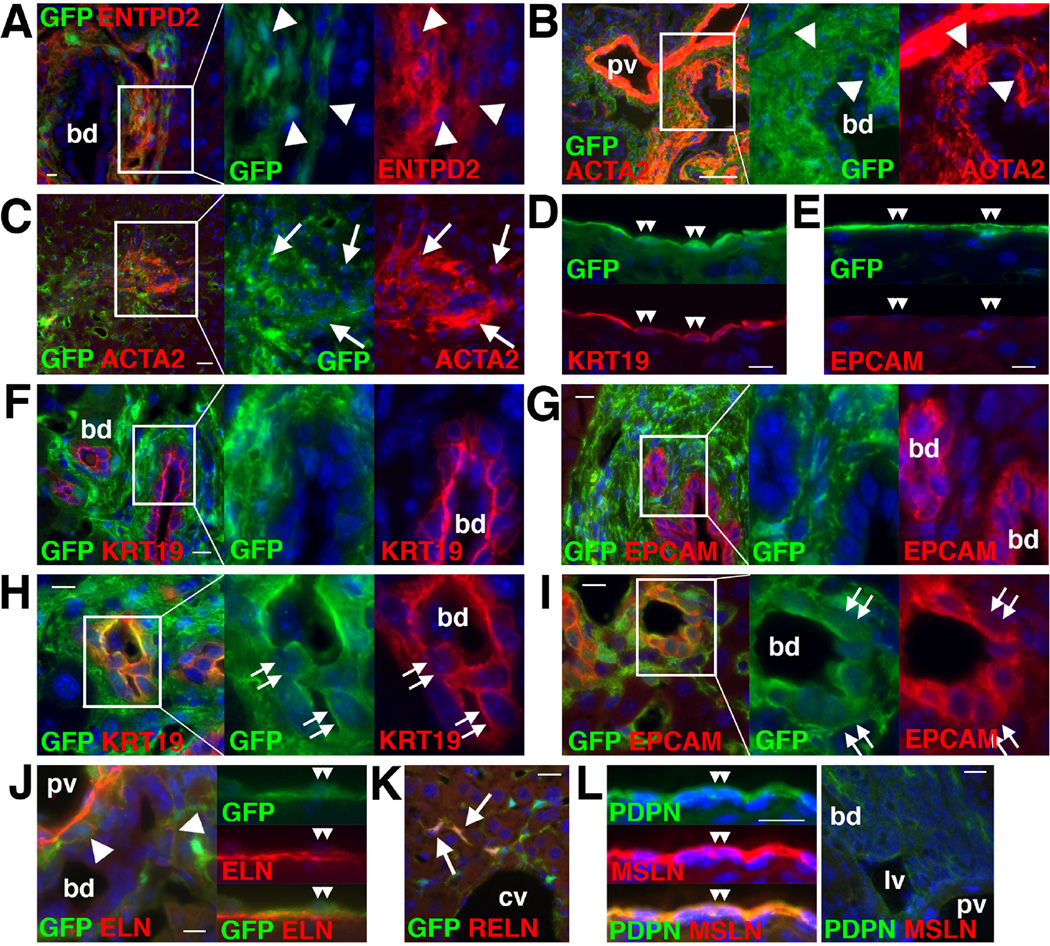
Next, we analyzed phenotypic changes of HSCs, PFs, and MCs in biliary fibrosis induced by BDL for 3 weeks in Col1a1GFP mice. Expression of ENTPD2 was restricted in GFP+ myofibroblasts around the bile duct but not in HSCs in the sinusoid in biliary fibrosis (Fig. 6A). Although expression of ACTA2 was observed in PFs adjacent to the bile duct, not all PFs became positive for ACTA2 (Fig. 6B). The expression of ACTA2 was also observed in some GFP+ HSCs in the injured parenchyma (Fig. 6C). GFP+ MCs expressed KRT19 but not EPCAM on the liver surface (Fig. 6D,E). KRT19+ or EPCAM+ biliary epithelial cells were negative for GFP in the large bile duct (Fig. 6F,G). Unexpectedly, a few biliary epithelial cells showed the GFP expression in the small bile duct in biliary fibrosis (Fig. 6H,I). Deposition of ELN was observed around the bile duct and beneath the MCs (Fig. 6J). RELN was expressed in HSCs in the sinusoid (Fig. 6K). Similar to the normal livers, MSLN was expressed in MCs but not in PFs around the portal vein after BDL (Fig. 6L).
Figure 6. Expression of markers in biliary fibrosis induced by BDL.
Col1a1GFP (A–K) and wild-type (L) mouse livers were analyzed by immunohistochemistry. (A) ENTPD2 is expressed in GFP+ myofibroblasts around the bile duct (bd, arrowheads). (B) ACTA2 is expressed in GFP+ PFs (arrowheads) adjacent to the bile duct. Not all GFP+ PFs express ACTA2. (C) ACTA2 expression in GFP+ HSCs (arrows). (D,E) GFP+ MCs express KRT19 but not EPCAM (double arrowheads). (F–I) A few KRT19+ or EPCAM+ biliary epithelial cells in the small bile duct express GFP (double arrows). (J) The deposition of ELN is observed around the bile duct (arrowheads) and beneath the GFP+ MCs (double arrowheads). (K) RELN is expressed in GFP+ HSCs in the sinusoid (arrows). (L) MSLN is exclusively expressed in PDPN+ MCs (double arrowheads) but not in PFs around the portal vein (pv). Bar: 10 µm.
We also characterized the expression of markers in DDC diet-induced biliary fibrosis or CCl4-induced fibrosis. DDC diet induced expansion of GFP+ cells in the portal triad and some PFs adjacent to the bile duct expressed ACTA2 (Supplementary Fig. 1A). ENTPD2 was weakly expressed in PFs (Supplementary Fig. 1B). Similar to the BDL model, GFP expression was observed in biliary epithelial cells in small bile ducts (Supplementary Fig. 1C–E). GPM6A and MSLN were exclusively expressed in MCs (Supplementary Fig. 1F–H).
After CCl4 injections, accumulation of ACTA2+ myofibroblasts was observed around the central vein and beneath the mesothelium (Supplementary Fig. 2A,B). ENTPD2 and ELN were expressed in PFs that are negative for ACTA2 (Supplementary Fig. 2C,D). The expression of RELN was observed in GFP+DES+ HSCs and its expression was not evident in MCs and myofibroblasts near the liver surface (Supplementary Fig. 2E,F). Differing from the BDL and DDC models, CCl4 did not induce GFP expression in biliary epithelial cells (Supplementary Fig. 2G,H). MCs expressed GPM6A, PDPN, CD200, and MSLN (Supplementary Fig. 2I–L). No MSLN expression was observed in the portal triad.
Isolation of HSCs, PFs, and MCs from fibrotic livers
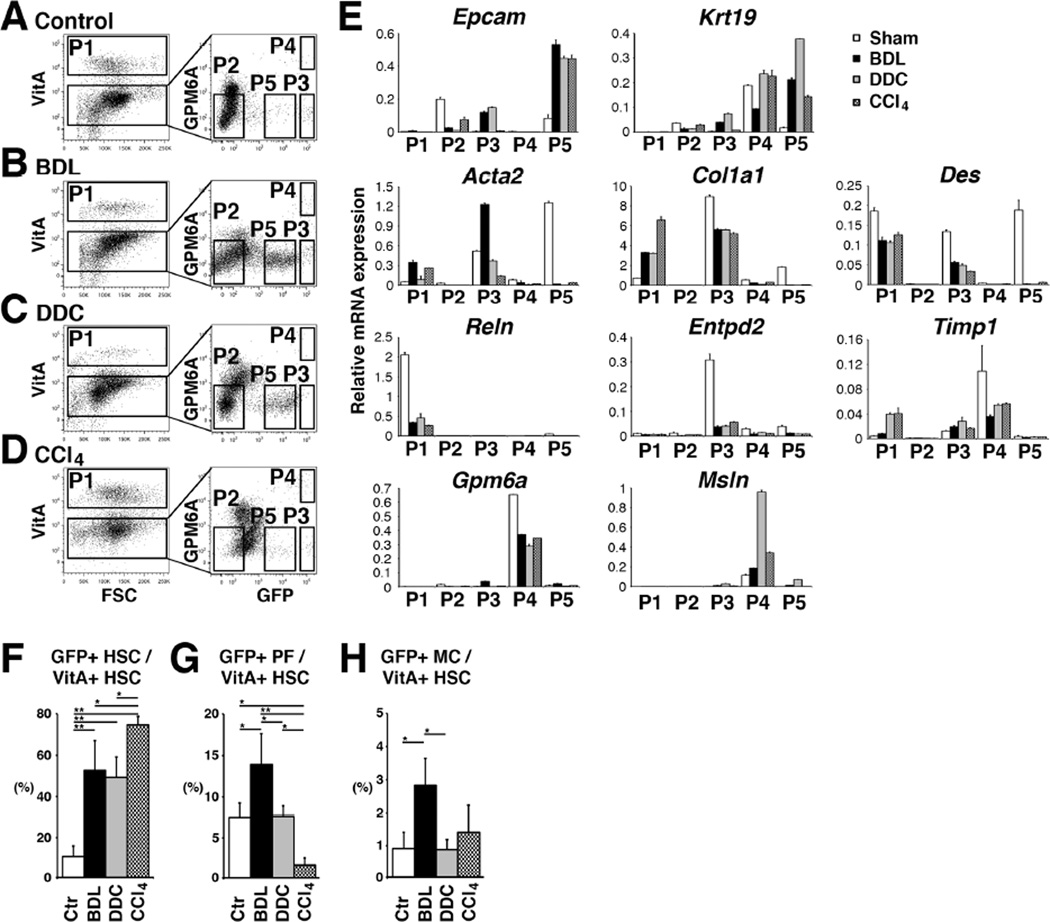
To characterize HSCs, PFs, and MCs in fibrosis induced by BDL, DDC diet, or CCl4 injections, NPCs prepared from Col1a1GFP livers were analyzed by FACS (Fig. 7A–D). We sorted VitA+ HSCs (P1, 11.6±4.3%, n=4), VitA−GFP+GPM6A− PFs (P3, 1.7±0.3%), and VitA− GFP+ GPM6A+ MCs (P4, 0.3±0.1%) from the BDL model (Fig. 7B). We also observed P5-GFPDim cells between P2 and P3 after BDL (Fig. 7B). QPCR revealed that P5 population expresses Epcam and Krt19 mRNAs (Fig. 7E), indicating the enrichment of GFP+ biliary epithelial cells in P5. In contrast, the P3-PFs showed less expression of Epcam and Krt19 and did not express Reln, Gpm6a, and Msln (Fig. 7E). P3-PFs increased expression of Acta2 after BDL (Fig. 7E). Although PFs expressed more Col1a1 mRNA than HSCs, PFs slightly decreased Col1a1 by BDL (Fig. 7E). PFs decreased the expression of Entpd2. After BDL, P1-HSCs decreased the expression of Reln, while increasing Acta2 (Fig. 7E). P4-MCs did not increase the expression of Acta2 and Col1a1 by BDL (Fig. 7E). MCs kept expressing Gpm6a, Msln, and Timp1 mRNAs. We also analyzed the gene expression of these cells by microarray between the sham and BDL samples and confirmed the similar expression patterns (Supplementary Table 3). These results suggest that BDL moderately induces activation of both HSCs and PFs in mouse livers.
Figure 7. Isolation of HSCs, PFs, and MCs from Col1a1GFP fibrotic livers.
(A–D) NPCs were prepared from control (A, n=6) or injured Col1a1GFP livers induced by BDL (B, n=6), DDC (C, n=3), and CCl4 (D, n=4). PI− cells were analyzed for autofluorescence of VitA and P1 VitA+ HSCs were sorted. The VitA− fraction was further analyzed for the expression of GPM6A and GFP. P1–P5 factions were sorted for further analysis. (E) QPCR of P1–P5 fractions. (F–H) Percentages of GFP+ HSCs (F), PFs (G), and MCs (H) in VitA+ HSCs in different models. *P<0.05, **P<0.01.
We also isolated P1–P5 populations from fibrotic Col1a1GFP livers induced by DDC or CCl4 (Fig. 7C,D). Similar to the BDL model, P1-HSCs increased the expression of Col1a1 and Timp1 in the DDC model (Fig. 7E). HSCs reduced the expression of Reln (Fig. 7E). P3-PFs decreased the expression of Acta2 mRNA compared to the BDL model, implying that the DDC model does not fully induce myofibroblastic conversion of PFs. P4-MCs kept expressing Gpm6a, Msln, Krt19, and Timp1. Similar to the BDL model, DDC diet induced GFP expression in P5-biliary epithelial cells (Fig. 7C). In the CCl4 model, GFP+ biliary epithelial cells were few in P5 (Fig. 7D). As expected, CCl4 induced the activation markers in P1-HSCs (Fig. 7E). P3-PFs did not up-regulate the expression of Acta2 and Col1a1 by CCl4.
Based on the FACS data, we estimated the relative contribution of HSCs, PFs, and MCs to GFP+ myofibroblasts in these models. Our method did not allow detecting GFP- PFs. In addition, liver injury caused by different etiology changed the number of blood cells in the NPC fraction. Thus, we quantified the ratio of GFP+ HSCs, PFs, and MCs against VitA+ HSCs in the NPC fraction (Fig. 7A–D). As expected, CCl4 treatment increased the percentage of GFP+ HSCs in VitA+ HSCs (74.5±4.0%) compared to the control (Fig. 7F). Interestingly, BDL and DDC models also increased the percentage of GFP+ HSCs (52.7±14.2% in BDL and 49.3±9.7% in DDC), indicating activation of HSCs in biliary fibrosis (Fig. 7F). In the control liver, the ratio of GFP+ PFs against VitA+ HSCs was 7.5±1.8% and this ratio was increased to 13.9±3.8% by BDL (Fig. 7G). These results suggest that PFs partly contribute to GFP+ myofibroblasts in biliary fibrosis induced by BDL. According to the increase of GFP+ HSCs in the CCl4 model, the percentage of GFP+ P3-PFs decreased (Fig. 7F,G). DDC-induced fibrosis did not increase the percentage of GFP+ P3-PFs (Fig. 7G). GFP+ P4-MCs occupied only 0.9–2.9% all groups (Fig. 7H).
Discussion
During liver fibrosis, myofibroblasts actively synthesize collagen and participate in liver fibrosis. Depending on the etiology, genesis of ACTA2+ myofibroblasts varies, e.g., myofibroblasts appear around the central vein in the CCl4 model, whereas around the bile duct in biliary fibrosis induced by BDL and DDC models. Although HSCs seem to be the major source of myofibroblasts in liver fibrosis[5], PFs are suggested to be another source in biliary fibrosis [10– 14]. In addition, MCs were shown to differentiate into myofibroblasts[16]. To understand the contribution of different cell types to myofibroblasts and their roles, we isolated HSCs, PFs, and MCs from normal or injured livers induced by different insults by FACS. We used the Col1a1GFP transgenic mice to detect activated HSCs, PFs, and MCs. In the present study, we separated GFP+ cells in Col1a1GFP livers and estimated the contribution of HSCs, PFs, and MCs to GFP+ myofibroblasts in different liver injury models.
The Col1a1GFP transgenic mice have been used to detect and isolate activated GFP+ HSCs[8,20–23]. We found that the normal Col1a1GFP liver broadly expresses the GFP in some HSCs, PFs, and MCs. Based on the VitA storage and expression of GFP and GPM6A, we separated VitA+ HSCs, VitA−GFP+GPM6A− PFs, and VitA−GFP+GPM6A+ MCs by FACS. We found that HSCs and lymphatic vessels express RELN, which was previously reported in rat liver[24,25]. No RELN was observed in PFs and MCs, indicating that RELN is a good marker to distinguish HSCs and lymphatic vessels. PFs expressed ELN and ENTPD2 in the portal triad. Li et al. reported that rat PFs express ELN but not DES[13]. In contrast, we found the expression of DES in mouse PFs. ELN was expressed in PFs and MCs in biliary fibrosis. ENTPD2 was originally identified as a PF marker in rat livers, and its expression was shown to decrease in PFs and increase in HSCs in culture activation[13]. Our data showed that Entpd2 mRNA is down-regulated in PFs in fibrosis induced by different etiology. Differing from rat livers, Entpd2 mRNA was not induced in activated mouse HSCs.
After BDL, we observed expansion of GFP+ PFs in the portal triad of the Col1a1GFP mouse. Although ENTPD2+GFP+ PF-derived myofibroblasts were observed around the portal vein, co-expression of ACTA2, a general myofibroblast marker, was restricted near the bile duct, implying that activation state of PFs is heterogeneous. After sorting PFs from the control and BDL models, P3-PFs increased Acta2 mRNA moderately. GFP+ PFs in the normal liver expressed high Col1a1 mRNA compared to HSCs. However, GFP+ PFs isolated from the BDL model did not further increase Col1a1 mRNA. Thus, our data indicate that PFs actively express Col1a1 mRNA in the normal liver and they expand in biliary fibrosis with limited conversion to ACTA2+ myofibroblasts. Based on the FACS data, we estimated that the ratio of GFP+ PFs against VitA+ HSCs is increased from 8% in the control to 14% in the BDL model. GFP+ HSCs were increased from 11% to 53% by BDL. Compared to the BDL model, DDC diet did not increase Acta2 mRNA in P3-PFs. These data indicate that although PFs contribute to GFP+ myofibroblasts in the portal area in biliary fibrosis caused by BDL or DDC diet, the contribution of HSCs is still dominant. In agreement with our results, Mederacke et al. [5] reported that HSCs, but not PFs, are a major source of myofibroblasts in biliary fibrosis using LratCre mice. As expected, CCl4 treatment extensively increased the ratio of GFP+ HSCs in VitA+ HSCs to 75% and the ratio of GFP+ PFs was only 2%. Our quantification data suggest that HSCs are the major source of GFP+ myofibroblasts in liver fibrosis induced by CCl4 injections. PFs partly contribute to myofibroblasts in the BDL model.
Our conclusion contradicts the results from the recent paper in which the authors separated GFP+VitA− cells as PFs from the same Col1a1GFP mouse model and identified MSLN as a PF marker[21]. Based on the increased number of GFP+VitA− cells in the BDL model, they estimated that PFs are the major source of myofibroblasts. In the present study, we found that BDL or DDC diet induces de novo GFP expression in the small bile duct of the Col1a1GFP mouse. Thus, the presence of GFP+ biliary epithelial cells in GFP+VitA− population leads to overestimation of the contribution of GFP+ PFs in biliary fibrosis in their study. Furthermore, our data indicate that the GFP+VitA− population also contains MCs. Immunohistochemistry showed that MSLN is expressed in MCs, but not in PFs in mouse and human livers. During the preparation of NPCs from mouse livers, perfused livers were further digested with collagenase, and MCs appeared to be collected in the NPC fraction. In fact, FACS revealed the presence of GPM6A+ MCs in the NPC fraction. Although we attempted to trace Msln+ cells using MslnCreERT2-IRES-lacZ;R26TGfl/fl mice[26], they did not specifically label MCs in the liver with tamoxifen treatment (data not shown).
In culture, PFs showed fibroblastic morphology without storing VitA lipids, and these characteristics differed from those in HSCs and MCs. After TGF-β1 treatment, the PFs differentiated into myofibroblasts expressing ACTA2, similar to the activation of HSCs. Interestingly, TGF-β1 suppressed Ccnd1 mRNA in PFs but not in HSCs, similar to the previous report of rat livers[12]. These data indicate that HSCs and PFs have the potential to differentiate into myofibroblasts and that their proliferation is differently regulated by TGF-β and PDGF-BB.
Our recent study showed that MCs contribute to 2% of myofibroblasts in the CCl4 model near the liver surface[27]. Upon differentiation to HSCs or myofibroblasts, MCs lose the expression of GPM6A[16]. In the present study, we isolated MCs based on the expression of GPM6A from injured livers and this method was unable to isolate MC-derived myofibroblasts. This might be a reason isolated MCs do not show increased expression of Acta2 and Col1a1 mRNAs in injured livers. As we have previously reported[16], cultured MCs induce ACTA2+ myofibroblasts by TGF-β1. Differing from HSCs and PFs, MCs do not express Pdgfra and Pdgfrb mRNAs and do not respond to PDGF-BB, indicating unique feature of MCs. Microarray analysis revealed that MCs highly express Upk1b and Upk3b (Supplementary Table 3). UPK complex is composed of UPK1B/UPIII and UPK1A/UPII pairs and functions as a permeability barrier of the urothelium[28]. Upk1bRFP/+ heterozygous mice showed specific RFP expression only in MCs in the liver. Although we produced Upk1bRFP/RFP knockout mice, they were born without noticeable abnormalities in the liver or bladder (data not shown). Similarly, Upk3b knockout mice do not show any abnormalities in the mesothelium[28], indicating that UPK is not essential for the development of MCs.
According to immunohistochemistry of the Col1a1GFP livers, CFs, SLCs, and SMCs are also expected to appear in the VitA−GFP+GPM6A− population when using FACS. Differing from PFs, ENTPD2 expression was not observed in the Glisson’s capsule on the liver surface, suggesting that there may be a phenotypic difference between PFs and CFs. The markers we identified will be useful for creating specific Cre lines for further study on the cell lineages of different mesenchymal cells in liver fibrosis.
Supplementary Material
Acknowledgments
We thank Drs. David Brenner, Ekihiro Seki, and Yuval Rinkevich for providing the mice and Meng Li for microarray analysis.
Financial Support: This work was supported by NIH grant R01AA020753 (to K.A.), pilot project funding (to K.A.) from P50AA011999, pilot project funding (to K.A.) from P30DK048522, training program (to I.L.) from T32HD060549, U01DK084538 (to K.W.), and the Robert E. and May R. Wright foundation award (to K.A).
Abbreviations
- MCs
mesothelial cells
- HSCs
hepatic stellate cells
- PFs
portal fibroblasts
- VitA
vitamin A
- GPM6A
glycoprotein M6a
- Col1a1
collagen1a1
- GFP
green fluorescence protein
- TGF-β
transforming growth factor-β
- PDGF
platelet-derived growth factor
- ACTA2
α-smooth muscle actin
- ELN
elastin
- ENTPD2
ectonucleoside triphosphate diphosphohydrolase-2
- SLCs
second-layer cells
- CFs
capsular fibroblasts
- Krt
keratin
- MSLN
mesothelin
- PDPN
podoplanin
- FACS
fluorescence-activated cell sorting
- UPK
uroplakin
- RFP
red fluorescent protein
- BDL
bile duct ligation
- NPCs
nonparenchymal cells
- PI
propidium iodide
- QPCR
quantitative-polymerase chain reaction
- GAPDH
glyceraldehyde-3-phosphate dehydrogenase
- DES
desmin
- SMCs
smooth muscle cells
- RELN
reelin
- Ccnd1
Cyclin D1
- P-SMAD3
phosphorylated-SMAD3
Footnotes
Publisher's Disclaimer: This is a PDF file of an unedited manuscript that has been accepted for publication. As a service to our customers we are providing this early version of the manuscript. The manuscript will undergo copyediting, typesetting, and review of the resulting proof before it is published in its final citable form. Please note that during the production process errors may be discovered which could affect the content, and all legal disclaimers that apply to the journal pertain.
Conflict of interests: The authors have no conflicts of interests.
Author’s contributions: I. Lua study concept and design; acquisition of data; analysis and interpretation of data; critical revision of the manuscript for important intellectual content; obtained funding. Y. Li acquisition of data; analysis and interpretation of data. J. Zagory acquisition of data; material support. K. Wang acquisition of data; material support. J. Sévigny material support. S. French acquisition of data; analysis and interpretation of data; material support. K. Asahina study concept and design; acquisition of data; analysis and interpretation of data; drafting of the manuscript; critical revision of the manuscript for important intellectual content; statistical analysis; obtained funding; study supervision.
GEO accession number for microarray data: GSE66788
References
- 1.Friedman SL. Hepatic stellate cells: protean, multifunctional, and enigmatic cells of the liver. Physiol Rev. 2008;88:125–172. doi: 10.1152/physrev.00013.2007. [DOI] [PMC free article] [PubMed] [Google Scholar]
- 2.Schuppan D, Kim YO. Evolving therapies for liver fibrosis. J Clin Invest. 2013;123:1887–1901. doi: 10.1172/JCI66028. [DOI] [PMC free article] [PubMed] [Google Scholar]
- 3.Asahina K, Tsai SY, Li P, Ishii M, Maxson RE, Jr, Sucov HM, et al. Mesenchymal origin of hepatic stellate cells, submesothelial cells, and perivascular mesenchymal cells during mouse liver development. Hepatology. 2009;49:998–1011. doi: 10.1002/hep.22721. [DOI] [PMC free article] [PubMed] [Google Scholar]
- 4.Lua I, James D, Wang J, Wang KS, Asahina K. Mesodermal mesenchymal cells give rise to myofibroblasts, but not epithelial cells, in mouse liver injury. Hepatology. 2014;60:311–322. doi: 10.1002/hep.27035. [DOI] [PMC free article] [PubMed] [Google Scholar]
- 5.Mederacke I, Hsu CC, Troeger JS, Huebener P, Mu X, Dapito DH, et al. Fate tracing reveals hepatic stellate cells as dominant contributors to liver fibrosis independent of its aetiology. Nat Commun. 2013;4:2823. doi: 10.1038/ncomms3823. [DOI] [PMC free article] [PubMed] [Google Scholar]
- 6.Iredale JP, Benyon RC, Pickering J, McCullen M, Northrop M, Pawley S, et al. Mechanisms of spontaneous resolution of rat liver fibrosis. Hepatic stellate cell apoptosis and reduced hepatic expression of metalloproteinase inhibitors. J Clin Invest. 1998;102:538–549. doi: 10.1172/JCI1018. [DOI] [PMC free article] [PubMed] [Google Scholar]
- 7.Ellis EL, Mann DA. Clinical evidence for the regression of liver fibrosis. J Hepatol. 2012;56:1171–1180. doi: 10.1016/j.jhep.2011.09.024. [DOI] [PubMed] [Google Scholar]
- 8.Kisseleva T, Cong M, Paik Y, Scholten D, Jiang C, Benner C, et al. Myofibroblasts revert to an inactive phenotype during regression of liver fibrosis. Proc Natl Acad Sci USA. 2012;109:9448–9453. doi: 10.1073/pnas.1201840109. [DOI] [PMC free article] [PubMed] [Google Scholar]
- 9.Troeger JS, Mederacke I, Gwak GY, Dapito DH, Mu X, Hsu CC, et al. Deactivation of hepatic stellate cells during liver fibrosis resolution in mice. Gastroenterology. 2012;143:1073–1083. doi: 10.1053/j.gastro.2012.06.036. [DOI] [PMC free article] [PubMed] [Google Scholar]
- 10.Uchio K, Tuchweber B, Manabe N, Gabbiani G, Rosenbaum J, Desmouliere A. Cellular retinol-binding protein-1 expression and modulation during in vivo and in vitro myofibroblastic differentiation of rat hepatic stellate cells and portal fibroblasts. Lab Invest. 2002;82:619–628. doi: 10.1038/labinvest.3780456. [DOI] [PubMed] [Google Scholar]
- 11.Dranoff JA, Kruglov EA, Robson SC, Braun N, Zimmermann H, Sevigny J. The ectonucleoside triphosphate diphosphohydrolase NTPDase2/CD39L1 is expressed in a novel functional compartment within the liver. Hepatology. 2002;36:1135–1144. doi: 10.1053/jhep.2002.36823. [DOI] [PubMed] [Google Scholar]
- 12.Wells RG, Kruglov E, Dranoff JA. Autocrine release of TGF-β by portal fibroblasts regulates cell growth. FEBS Lett. 2004;559:107–110. doi: 10.1016/S0014-5793(04)00037-7. [DOI] [PubMed] [Google Scholar]
- 13.Li Z, Dranoff JA, Chan EP, Uemura M, Sevigny J, Wells RG. Transforming growth factor-β and substrate stiffness regulate portal fibroblast activation in culture. Hepatology. 2007;46:1246–1256. doi: 10.1002/hep.21792. [DOI] [PubMed] [Google Scholar]
- 14.Lemoinne S, Cadoret A, Rautou PE, El Mourabit H, Ratziu V, Corpechot C, et al. Portal myofibroblasts promote vascular remodeling underlying cirrhosis formation through the release of microparticles. Hepatology. 2015;61:1041–1055. doi: 10.1002/hep.27318. [DOI] [PubMed] [Google Scholar]
- 15.Bhunchet E, Wake K. Role of mesenchymal cell populations in porcine serum-induced rat liver fibrosis. Hepatology. 1992;16:1452–1473. doi: 10.1002/hep.1840160623. [DOI] [PubMed] [Google Scholar]
- 16.Li Y, Wang J, Asahina K. Mesothelial cells give rise to hepatic stellate cells and myofibroblasts via mesothelial-mesenchymal transition in liver injury. Proc Natl Acad Sci USA. 2013;110:2324–2329. doi: 10.1073/pnas.1214136110. [DOI] [PMC free article] [PubMed] [Google Scholar]
- 17.Onitsuka I, Tanaka M, Miyajima A. Characterization and functional analyses of hepatic mesothelial cells in mouse liver development. Gastroenterology. 2010;138:1525–1535. doi: 10.1053/j.gastro.2009.12.059. [DOI] [PubMed] [Google Scholar]
- 18.Lua I, Li Y, Pappoe LS, Asahina K. Myofibroblastic conversion and regeneration of mesothelial cells in peritoneal and liver fibrosis. Am J Pathol. 2015;185:3258–3273. doi: 10.1016/j.ajpath.2015.08.009. [DOI] [PMC free article] [PubMed] [Google Scholar]
- 19.Asahina K, Zhou B, Pu WT, Tsukamoto H. Septum transversum-derived mesothelium gives rise to hepatic stellate cells and perivascular mesenchymal cells in developing mouse liver. Hepatology. 2011;53:983–995. doi: 10.1002/hep.24119. [DOI] [PMC free article] [PubMed] [Google Scholar]
- 20.Yata Y, Scanga A, Gillan A, Yang L, Reif S, Breindl M, et al. DNase I-hypersensitive sites enhance α1(I) collagen gene expression in hepatic stellate cells. Hepatology. 2003;37:267–276. doi: 10.1053/jhep.2003.50067. [DOI] [PubMed] [Google Scholar]
- 21.Iwaisako K, Jiang C, Zhang M, Cong M, Moore-Morris TJ, Park TJ, et al. Origin of myofibroblasts in the fibrotic liver in mice. Proc Natl Acad Sci USA. 2014;111:E3297–E3305. doi: 10.1073/pnas.1400062111. [DOI] [PMC free article] [PubMed] [Google Scholar]
- 22.D'Ambrosio DN, Walewski JL, Clugston RD, Berk PD, Rippe RA, Blaner WS. Distinct populations of hepatic stellate cells in the mouse liver have different capacities for retinoid and lipid storage. PLoS One. 2011;6:e24993. doi: 10.1371/journal.pone.0024993. [DOI] [PMC free article] [PubMed] [Google Scholar]
- 23.Yang MD, Chiang YM, Higashiyama R, Asahina K, Mann DA, Mann J, et al. Rosmarinic acid and baicalin epigenetically derepress peroxisomal proliferator-activated receptor gamma in hepatic stellate cells for their antifibrotic effect. Hepatology. 2012;55:1271–1281. doi: 10.1002/hep.24792. [DOI] [PMC free article] [PubMed] [Google Scholar]
- 24.Kobold D, Grundmann A, Piscaglia F, Eisenbach C, Neubauer K, Steffgen J, et al. Expression of reelin in hepatic stellate cells and during hepatic tissue repair: a novel marker for the differentiation of HSC from other liver myofibroblasts. J Hepatol. 2002;36:607–613. doi: 10.1016/s0168-8278(02)00050-8. [DOI] [PubMed] [Google Scholar]
- 25.Samama B, Boehm N. Reelin immunoreactivity in lymphatics and liver during development and adult life. Anat Rec A Discov Mol Cell Evol Biol. 2005;285:595–599. doi: 10.1002/ar.a.20202. [DOI] [PubMed] [Google Scholar]
- 26.Rinkevich Y, Mori T, Sahoo D, Xu PX, Bermingham JR, Jr, Weissman IL. Identification and prospective isolation of a mesothelial precursor lineage giving rise to smooth muscle cells and fibroblasts for mammalian internal organs, and their vasculature. Nat Cell Biol. 2012;14:1251–1260. doi: 10.1038/ncb2610. [DOI] [PMC free article] [PubMed] [Google Scholar]
- 27.Li Y, Lua I, French SW, Asahina K. Role of TGF-β signaling in differentiation of mesothelial cells to vitamin A-poor hepatic stellate cells in liver fibrosis. Am J Physiol Gastrointest Liver Physiol. 2015 doi: 10.1152/ajpgi.00257.2015. ajpgi.00257.02015. [DOI] [PMC free article] [PubMed] [Google Scholar]
- 28.Rudat C, Grieskamp T, Rohr C, Airik R, Wrede C, Hegermann J, et al. Upk3b is dispensable for development and integrity of urothelium and mesothelium. PLoS One. 2014;9:e112112. doi: 10.1371/journal.pone.0112112. [DOI] [PMC free article] [PubMed] [Google Scholar]
Associated Data
This section collects any data citations, data availability statements, or supplementary materials included in this article.


