

Abstract
Preclinical development of RNA interference (RNAi)-based therapeutics requires a rapid, accurate, and robust method of simultaneously quantifying mRNA knockdown in hundreds of samples. The most well-established method to achieve this is quantitative real-time polymerase chain reaction (qRT-PCR), a labor-intensive methodology that requires sample purification, which increases the potential to introduce additional bias. Here, we describe that the QuantiGene® branched DNA (bDNA) assay linked to a 96-well Qiagen TissueLyser II is a quick and reproducible alternative to qRT-PCR for quantitative analysis of mRNA expression in vivo directly from tissue biopsies. The bDNA assay is a high-throughput, plate-based, luminescence technique, capable of directly measuring mRNA levels from tissue lysates derived from various biological samples. We have performed a systematic evaluation of this technique for in vivo detection of RNAi-based silencing. We show that similar quality data is obtained from purified RNA and tissue lysates. In general, we observe low intra- and inter-animal variability (around 10% for control samples), and high intermediate precision. This allows minimization of sample size for evaluation of oligonucleotide efficacy in vivo.
Introduction
RNA interference (RNAi) is an endogenous cellular pathway widely used as a biomedical research tool to silence gene expression in vitro and in vivo [1–3]. RNAi is initiated by a small interfering RNA (siRNA), which guides target mRNA silencing through an RNA-induced silencing complex [4]. Tissue-specific siRNA delivery poses a major challenge to RNAi clinical development [5]. Recent advances in delivery technologies (eg, N-acetyl galactosamine [GalNAc]-siRNA conjugates, which show robust clinical efficacy in hepatocytes [6–8]) have led to a major breakthrough in the development of novel RNAi-based therapies for liver disease. Further research efforts will be required to expand the clinical utility of RNAi beyond the liver. These types of studies require a rapid, simple method to assess oligonucleotide-dependent target gene silencing in vivo. The most common method to quantify target mRNA silencing following siRNA treatment is quantitative real-time polymerase chain reaction (qRT-PCR) [9,10].
qRT-PCR is one of the most widely used methods of analyzing gene expression, and it is an indispensable tool for mRNA quantification for a variety of applications [10–13]. This assay monitors the exponential amplification of a target mRNA following conversion to its complementary DNA (cDNA). However, each step (mRNA isolation and purification, cDNA synthesis, and qRT-PCR) introduces systematic error [9]. These errors include insufficient or nonreproducible mRNA purification from tissues of interest, inefficient cDNA synthesis, and errors in detection of PCR products [10]. Moreover, the purified RNA is subject to degradation by endo- and exonucleases [14]. This complex processing makes analysis of in vivo studies highly laborious, especially in studies designed to test the efficacy of a compound library in distinct tissues, in parallel. This often results in underpowered studies, potentially affecting the reliability of the results. The development and validation of methods that simplify in vivo efficacy studies will constitute a step forward for RNAi platform development.
The QuantiGene® branched DNA (bDNA) assay was developed to circumvent the pitfalls associated with qRT-PCR [15,16]. Unlike qRT-PCR, this bDNA assay relies on amplification of the signal, not the cDNA of interest. This method utilizes a plate-based, luminescent assay to directly assess the amount of mRNA in 96 samples simultaneously, without the need to isolate RNA or include a standard curve [17]. It has been used routinely for diagnostics, and to a lesser extent, to assess the efficacy of oligonucleotides in vivo [15,17–21]. A previous report compared qRT-PCR to the QuantiGene assay and determined that QuantiGene has a better linear range and relative accuracy versus qRT-PCR [22]. This makes the QuantiGene assay a viable alternative to qRT-PCR methods. Here, we describe a systematic evaluation of this technique for in vivo validation of oligonucleotide therapeutics.
Methods
mRNA quantification from total isolated RNA
Animals
Five untreated YAC128 mice were euthanized, brains were harvested, and three 300 μm coronal sections were prepared using a Leica vibratome [23]. From each section, a single 2 mm punch (#15110-20; Miltex®) was taken from both the left and right side of the striatum and cortex (four punches per coronal section) and placed in RNAlater® (#AM7020; Ambion) for 24 h at 4°C. All animal procedures were approved by the University of Massachusetts Medical School Institutional Animal Care and Use Committee (IACUC, protocol numbers A-2411 and A-978).
Sample preparation
For extraction of total purified RNA, three striatum punches and three cortical punches from the left side of the brain were pooled into separate tubes. The pooled tissue punches were homogenized by electronic pestle in 300 μL of lysis buffer. Total RNA was isolated using the mirVana™ miRNA isolation kit (#AM1560; Life Technologies), eluted in 100 μL of RNase free water, and diluted to a volume of 260 μL. Eighty microliters of this solution was combined with 20 μL of a specific probe set solution (human HD [#SA-50339; Affymetrix], mouse PPIB [#SB-10002; Affymetrix], or mouse HPRT [#SB-15463; Affymetrix]) in a 96-well bDNA assay plate (in triplicate). Plates were covered and incubated overnight at 55°C. The following day, the remainder of the QuantiGene assay protocol was performed (#QS0011; Affymetrix). Preamplifying, amplifying, and label solutions were prepared according to the manufacturer's recommended procedure. First, the plates were washed using an automated plate washer. The preamplifying solution (100 μL) was added to each well, and the plates were incubated at 55°C for 1 h. Following incubation, the plates were washed and treated with 100 μL of amplifying solution, and incubated at 55°C for 1 h. Following this step, plates were washed and incubated with 100 μL of labeling solution at 50°C for an additional hour. After a final wash step, 100 μL of substrate was added and plate luminescence was read using either a Veritas® Luminometer or a Tecan® M1000 plate reader.
mRNA quantification from tissue punch biopsies using electronic pestle for sample preperation
Sample preparation
For individual tissue punch homogenates, three striatum and three cortex punches from the right side of the brain, dissected as described in the previous section, were separated into individual tubes. Homogenizing buffer containing Proteinase K (#10642; Affymetrix) was prepared according to the manufacturer's recommended protocol, and 200 μL of this solution was added to each tube. Individual cortical or striatal punches were homogenized with an electronic pestle and incubated for 30 min at 65°C, vortexing for 1 min every 10 min. The homogenate was then spun at 16,000 g for 15 min at 4°C. Supernatant was removed and frozen at −80°C. Before mRNA analysis, tissue punch homogenates were thawed on ice, and 60 μL of the appropriate probe set solution and 40 μL of homogenate were combined in each well of the QuantiGene bDNA 96-well plate, to a final volume of 100 μL. Plates were sealed and incubated overnight at 55°C. The following day, the remainder of the QuantiGene bDNA assay protocol was performed as described above.
mRNA quantification from tissue punch biopsies using TissueLyser II for sample preparation
Oligonucleotide compounds
The siRNAs used for silencing studies were hydrophobically modified siRNAs (hsiRNAs). hsiRNAs are asymmetric compounds consisting of a 20-nucleotide antisense stand and a 15-nucleotide sense strand carrying a 3′-cholesterol bioconjugate and several 2′-O-methyl or 2′-fluoro sugar modifications. In addition, the 5′ and 3′-ends of these strands are modified with phosphorothioate backbone substitutions to promote exonuclease resistance [24,25].
Animals
FVB/N mice 6–8 weeks of age were deeply anesthetized with 1.2% Avertin and microinjected by stereotactic placement into the right striatum (coordinates relative to bregma: 1.0 mm anterior, 2.0 mm lateral, and 3.0 mm ventral). Mice were injected with phosphate-buffered saline (PBS; 2 μL per striata, N = 8 mice), 13 μg of nontargeting control (NTC) hsiRNA, hsiRNANTC (2 μL of 500 μM stock per striata, N = 8 mice), 13 μg of Huntingtin-targeting hsiRNA, hsiRNAHTT (2 μL of 500 μM stock per striata, N = 8 mice), or 25 μg of hsiRNAHTT (2 μL of 1 mM stock per striata, N = 8 mice).
Five days postinjection, the mice were euthanized and brains were harvested. A Leica vibratome was used to cut the area around the injection site into three, 300 μm sections. One 2 mm punch was taken from the ipsilateral (injected, right side) and contralateral (noninjected, left side) side of the striatum and cortex of each 300 μm section and placed into RNAlater (#AM7020; Ambion) in a 96-well plate and put at 4°C overnight. Each punch was processed as an individual sample for bDNA assay analysis as described above.
Sample preparation
mRNA was quantified using the bDNA assay as described previously. Probes used were human HD (#SA-50339; Affymetrix), sheep HD (#SF-10586; Affymetrix), sheep CANX (#SF-10622; Affymetrix), and mouse TEK (#SB-15564; Affymetrix).
Statistical analysis
Data were analyzed using GraphPad Prism 6.04 software (GraphPad Software, Inc.) or STATA IC13. For each independent mouse experiment, following subtraction of the plate background, the level of gene knockdown at each dose was normalized to the mean of the control group (PBS). In vivo data were analyzed by calculating the 95% confidence intervals. Intra- and inter-animal variability and intermediate precision were determined by calculating the coefficient of variation (%CV). %CV is a normalized measure of the dispersion of a probable distribution and is the ratio of the standard deviation to the sample mean times 100 [26].
Results
QuantiGene bDNA assay is a high-throughput assay for mRNA expression detection in vivo
The bDNA assay is a plate-based ELISA-type sandwich assay, where signal amplification is achieved by stepwise branched oligonucleotide hybridization (Fig. 1) [17,27]. It has been routinely used as an alternative for detection of mRNA expression and siRNA efficacy in cell culture assays for the past decade [15,17–21]. Here, we evaluated the merit of using the bDNA assay for detecting mRNA expression directly from tissue biopsies, by using the automatic TissueLyser II (Qiagen) for tissue homogenization, followed with direct detection of mRNA levels by bDNA (see Materials and Methods for experimental details).
FIG. 1.

Combination of TissueLyser II with QuantiGene® bDNA: A high-throughput method of direct mRNA detection from tissues biopsies. Top panel: Punch biopsies from consecutively sectioned coronal brain samples are collected. Biopsies are incubated at RNALater® at 4°C overnight. Tissue is lysed using 96-well plate TissueLyser II. Bottom panel: mRNA Levels in lysates are detected using QuantiGene assay. Quantigene image courtesy of Affymetrix, Inc., Santa Clara, CA. Qiagen image courtesy of © Qiagen, all rights reserved.
This method was assessed in wild-type mice (FVBN) following direct intracranial injection of hsiRNAs targeting huntingtin (Htt) mRNA. As a proof-of-concept, we quantified mRNA levels in individual biopsies collected from the striatum and cortex of treated and control animals. We compared biological replicates by collecting three, 2 mm punches per area of the brain. Use of punches allows normalization in size and weight of collected tissues and minimizes variability. Tissue biopsies were collected in 96-well plates prefilled with RNAlater, incubated overnight, and processed directly in the TissueLyser II (Fig. 1, top panel). The lysates were then transferred to the 96-well bDNA plate. Maintaining a 96-plate format throughout the process is critical for reducing the number of handling steps, and allows evaluation of many animals and tissues in parallel. Then, samples are subjected to the bDNA assay protocol (Fig. 1, bottom panel).
An average oligonucleotide efficacy study utilizes ∼40 animals, composed of 4–5 groups with 8 animals per group: vehicle, NTC, and 2–3 test compounds (at different concentrations or chemistries). In an experiment evaluating just five different tissues with three biopsies per tissue, a typical study can result in 600 samples. This corresponds to 6 × 96-well lysis plates and 12 × 96-well bDNA plates (one for the targeted gene and one for a housekeeping gene for normalization). With the bDNA assay, a study similar to that can be completed and fully analyzed within 2 days by a single person. Analysis of a similar study by qRT-PCR may take significantly longer.
Gene-specific QuantiGene probe validation
Detection of gene expression requires mRNA-specific probe sets. Validation of the linear range and signal-to-noise ratio of the luminescent signal for each probe set is an essential component of the assay. Typically, the same probe sets are used for measuring RNAi compound efficacy in vitro and in vivo. During probe set validation, target mRNA expression levels were evaluated over a range of lysate volumes. Figure 2 shows validation of six individual probe sets in various animals or tissues, including human HTT in YAC128 mouse brain (Fig. 2A), sheep HTT in sheep brain (Fig. 2B), sheep CANX in sheep brain (Fig. 2C), and mouse Tek in mouse liver (Fig. 2D), kidney (Fig. 2E), and placenta (Fig. 2F). We observed consistent signal linearity for all six tested probes. While levels of raw luminescence vary significantly between different targets, the dynamic range of the assay is robust enough to allow reliable mRNA quantification with 20–40 μL of lysate from about 2–5 mg of tissue. The signal-to-noise ratio observed in this study ranged from 20 to 600. Genes with low expression levels (eg, human HTT in the transgenic YAC128 mouse, Fig. 2A) can have signal-to-noise ratios as low as 8-fold above background, which may make variability more pronounced. Pretreatment of the samples with RNAlater before performing the bDNA assay is advised, since samples that are directly processed into the lysis buffer have dramatically lower levels of luminescent signal, indicative of nonspecific mRNA degradation (data not shown).
FIG. 2.

Validation of QuantiGene probes sets shows good linearity with high signal to noise ratio for several mRNA targets in different tissues. Various mRNAs were quantified from different tissue lysates. (A) Human Huntingtin (HTT) quantified from YAC128 mouse striatum, (B) Sheep HTT quantified from sheep striatum, (C) Sheep CANX quantified from sheep striatum, (D) Mouse Tyrosine Kinase (Tek) quantified from mouse liver, (E) Mouse Tek quantified from mouse kidney, (F) Mouse Tek quantified from mouse placenta. S:N, signal to noise ratio.
mRNA levels detected from tissue biopsies or purified RNA show similar variability
One of the major potential advantages of the bDNA assay is direct mRNA detection from tissue lysates without the requirement for RNA purification. As part of the method validation process, we compared the effect of sample processing (purified RNA vs. homogenization of tissue punches) on target gene expression variability (Fig. 3). To assess the variability associated with quantifying mRNA levels from purified RNA, three punches were taken from either the striatum or cortex of a mouse (details described in Methods). Three punches from each brain region were pooled together and RNA extraction was performed using a mirVana kit (Life Technologies). This purified RNA was used in the bDNA assay as technical replicates from one RNA solution. Additionally, three biopsies from the alternate side of the striatum or cortex were homogenized individually, generating biological replicates from within each animal. Using these two distinct processing methods, we analyzed the expression levels of three mRNAs, human HTT, mouse Ppib, and mouse Hprt, using the bDNA assay. HTT mRNA levels were normalized to housekeeping mRNA levels (Ppib or Hprt) and the ratios were plotted in Fig. 3.
FIG. 3.

mRNA expression quantified from tissue lysates or purified total RNA show similar degrees of intra- and inter-animal variability. YAC128 mouse brains were cut into 300 μm sections and three, 2 mm punches were taken from either the (A) striatum or (B) cortex. The punches were either pooled and total RNA extracted or punches were homogenized individually with no additional purification. Graph shows ratio of human huntingtin mRNA to either mouse PPIB or mouse HPRT housekeeping mRNA. Table shows inter- and intra-animal variability (%CV, percent coefficient of variation). All error bars represent mean ± SD.
Calculations for the coefficient of variation (%CV), both within each animal and between animals, showed minimal differences in variability between the two methods. The level of technical variability (the same purified RNA sample in triplicate) is comparable to the level of biological variability observed between different biopsies. Overall levels of Ppib and Hprt expression were not affected by RNA purification, while levels of HTT expression were reduced ∼2-fold. This may be due to the fact that Hprt and Ppib are relatively short mRNAs, while huntingtin mRNA is significantly longer, ∼14,000 bases. We have seen these phenomena multiple times, where long RNAs are not purified as efficiently, resulting in enhanced readings and sensitivity when detected directly from tissue lysates. While these effects are irrelevant in the case of silencing, which compares only relative levels of expression, it is important to note that direct quantification from tissue punches gives a more accurate picture of overall endogenous mRNA expression. Taken together, these data show that the simple and straightforward homogenization of tissue punches is a robust method for mRNA detection.
Sample size calculations for mouse studies using a bDNA assay
A typical mouse efficacy study for novel RNAi-based therapeutics involves comparing a PBS-treated group (or artificial cerebrospinal fluid [aCSF]-treated group), NTC group, and at least one group treated with an active RNAi oligonucleotide compound. Therefore, we used the data obtained in Fig. 3 to perform sample size calculations using the STATA program (Fig. 4). For these models, we determined the number of animals needed to detect a 20%–80% difference from the PBS-treated group (set to 100%) with a power of 70%–90%. As illustrated in Fig. 4, eight animals per group are sufficient to detect a 50% mRNA knockdown with an 80% power. As low as five animals are enough to detect 70% mRNA silencing with an 80% power. Power is the ability to detect a difference between groups, if any exists. This power analysis suggests that lower levels of knockdown require far more animals to detect statistically significant differences between groups.
FIG. 4.
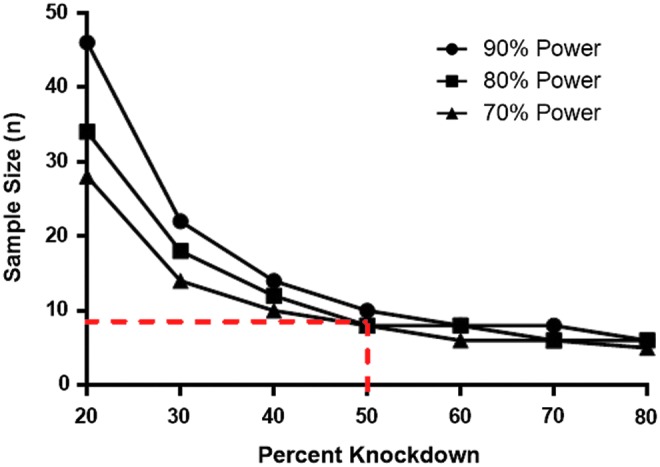
Low variability of the branched DNA (bDNA) assay allows for fewer animals per group. A STATA power analysis indicates that a sample size of eight animals per group is sufficient to detect 50% knockdown between groups with an 80% power (dotted line). Graph shows sample sizes necessary to detect different knockdown percentages at powers of 70%, 80%, or 90%. The y-axis shows the number of animals per group (n).
Low intra- and inter-animal variability
Next, we wanted to determine the intra- and inter-animal variability in a mouse efficacy study (Fig. 5). As a test model, we used hsiRNAHTT, a compound for which efficacy and distribution studies have been performed following direct brain administration [24]. Eight mice per group were unilaterally injected in the right hemisphere with 2 μL of PBS, a NTC (hsiRNANTC), or two different doses of hsiRNA targeting the huntingtin mRNA (hsiRNAHTT). Samples were processed as described in the Materials and Methods section. After subtracting the plate background values and normalizing to a housekeeping gene, mouse Ppib, we observed ∼60% Htt silencing for both doses of the hsiRNAHTT (Fig. 5). The 95% confidence intervals for the two treatment groups (dose 1, 13 μg hsiRNAHTT: 31% [23%–38%] and dose 2, 25 μg hsiRNAHTT: 21% [14%–29%]) were not overlapping with those of the two control groups (PBS: 91% [83%–99%] and hsiRNANTC: 81% [75%–88%]). Moreover, the confidence intervals were narrow, indicating the data were statistically significant with high precision. We determined the “within animal” and “animal-to-animal” coefficients of variation (%CV). The %CV between different punch biopsies from a single animal were ∼10% for both PBS and hsiRNANTC-treated groups, and ∼40% for the hsiRNAHTT-treated groups. The %CV between animals was ∼10% for both PBS and hsiRNANTC-treated groups, and ∼35% for the hsiRNAHTT-treated groups. The increase in %CV for mice treated with hsiRNAHTT is most likely due to the sharp gradient of diffusion observed following direct injection into the striatum, accounting for the higher degree of variability observed [24]. Additionally, the reduction in Htt expression resulting from hsiRNAHTT affects the signal-to-noise ratio.
FIG. 5.
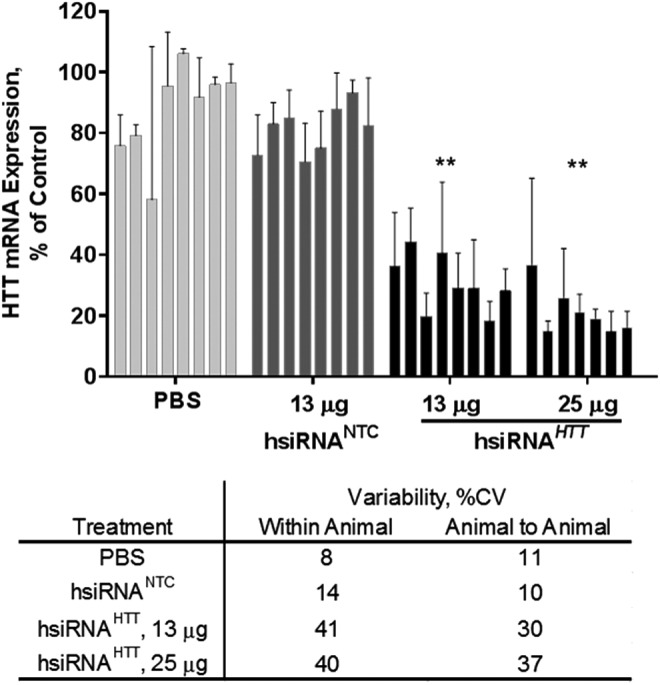
bDNA assay on individual punch biopsies efficiently detects hydrophobically modified small interfering RNA (hsiRNA) silencing of Htt mRNA. PBS, hsiRNANTC, or two different doses of hsiRNAHTT were unilaterally injected into the striatum of FVBN/j mice. Level of mouse Htt mRNA was measured after 5 days using the bDNA assay and normalized to housekeeping gene, mouse Ppib, and presented as percent of untreated control (n = 8 mice) Each bar represents an individual animal. All error bars represent mean ± SD for three individual punch biopsies per animal. NTC, nontargeting control; PBS, phosphate-buffered saline (**P < 0.001).
Reproducible results are important for the progress and translation of novel therapeutics from bench to bedside, and experiments are often performed by different researchers. To assess intermediate precision (the reproducibility among multiple experimenters), we conducted a study where two different operators analyzed the same samples on different days approximately a month apart. Both the raw luminescence readings and %CV were consistent, indicating that samples can be stored and different operators have minimal impact on data (data not shown).
Discussion
In this report, we demonstrate that a bDNA assay (QuantiGene) coupled with an automatic TissueLyser II is an easy, rapid, high-throughput, and robust method to analyze the efficacy of therapeutic oligonucleotides in vivo. One of the major deviations from the manufacturer's protocol was in the sample processing. In our hands, direct processing and storage of tissue biopsies without RNAlater results in detectable mRNA degradation and introduces variability. RNAlater treatment was essential for longer mRNAs, such as HTT, but may not be as critical for shorter mRNAs. We compared the results of mRNA quantification studies following two different cell lysis protocols, and determined that total RNA purification is not necessary for robust and reproducible results. We determined that the Affymetrix probe sets showed good linearity over a wide range of lysate concentrations, for a variety of different tissues in distinct organisms. This method shows low intra- and inter-animal variability and high intermediate precision. We did observe a higher coefficient of variance between animals treated with an HTT-targeting hsiRNA, although the silencing effect was still statistically significant. Additionally, using this method, we calculated that a sample size of eight mice per group is sufficient to detect a 50% reduction in gene expression with an 80% power. The total time necessary from sample collection to full analysis of a complete data set for a typical in vivo dose response efficacy study is 2 days, which enables a well-powered study design. One caveat to the bDNA assay is that it may not be suitable for experiments that only monitor transient or minor differences in mRNA expression levels. In addition, qRT-PCR has a lower limit of detection for mRNA transcripts. However, given the significant reduction in personnel hours, animals, and materials required for the bDNA assay, it is an attractive and cost-effective methodology for detecting mRNA silencing in vivo.
Acknowledgments
This project was funded by the CHDI Foundation (research agreement A-6119 and JSC A6367), RO1GM1088030181, RO1NS038194, and UH3TR000888. The compound synthesis was supported by S10 OD 020012-01. We thank the members of the Khvorova and Aronin Labs for helpful discussions and editorial feedback. QuantiGene image courtesy of Affymetrix eBioscience, Inc. Qiagen image courtesy of Qiagen©, all rights reserved.
Author Disclosure Statement
No competing financial interests exist.
References
- 1.Deleavey GF. and Damha MJ. (2012). Designing chemically modified oligonucleotides for targeted gene silencing. Chem Biol 19:937–954 [DOI] [PubMed] [Google Scholar]
- 2.Elbashir SM, Harborth J, Lendeckel W, Yalcin A, Weber K. and Tuschl T. (2001). Duplexes of 21-nucleotide RNAs mediate RNA interference in cultured mammalian cells. Nature 411:494–498 [DOI] [PubMed] [Google Scholar]
- 3.Fire A, Xu S, Montgomery MK, Kostas SA, Driver SE. and Mello CC. (1998). Potent and specific genetic interference by double-stranded RNA in Caenorhabditis elegans. Nature 391:806–811 [DOI] [PubMed] [Google Scholar]
- 4.Ghildiyal M. and Zamore PD. (2009). Small silencing RNAs: an expanding universe. Nat Rev Genet 10:94–108 [DOI] [PMC free article] [PubMed] [Google Scholar]
- 5.Haussecker D. (2014). Current issues of RNAi therapeutics delivery and development. J Control Release 195:49–54 [DOI] [PubMed] [Google Scholar]
- 6.Bumcrot D, Manoharan M, Koteliansky V. and Sah DW. (2006). RNAi therapeutics: a potential new class of pharmaceutical drugs. Nat Chem Biol 2:711–719 [DOI] [PMC free article] [PubMed] [Google Scholar]
- 7.Gallas A, Alexander C, Davies MC, Puri S. and Allen S. (2013). Chemistry and formulations for siRNA therapeutics. Chem Soc Rev 42:7983–7997 [DOI] [PubMed] [Google Scholar]
- 8.Rajeev KG, Nair JK, Jayaraman M, Charisse K, Taneja N, O'Shea J, Willoughby JL, Yucius K, Nguyen T, et al. (2015). Hepatocyte-specific delivery of siRNAs conjugated to novel non-nucleosidic trivalent N-acetylgalactosamine elicits robust gene silencing in vivo. Chembiochem 16:903–908 [DOI] [PubMed] [Google Scholar]
- 9.Bustin SA. (2002). Quantification of mRNA using real-time reverse transcription PCR (RT-PCR): trends and problems. J Mol Endocrinol 29:23–39 [DOI] [PubMed] [Google Scholar]
- 10.Prokopec SD, Watson JD, Waggott DM, Smith AB, Wu AH, Okey AB, Pohjanvirta R. and Boutros PC. (2013). Systematic evaluation of medium-throughput mRNA abundance platforms. RNA 19:51–62 [DOI] [PMC free article] [PubMed] [Google Scholar]
- 11.Rieu I. and Powers SJ. (2009). Real-time quantitative RT-PCR: design, calculations, and statistics. Plant Cell 21:1031–1033 [DOI] [PMC free article] [PubMed] [Google Scholar]
- 12.Robertson ED, Wasylyk C, Ye T, Jung AC. and Wasylyk B. (2014). The oncogenic MicroRNA Hsa-miR-155-5p targets the transcription factor ELK3 and links it to the hypoxia response. PLoS One 9:e113050. [DOI] [PMC free article] [PubMed] [Google Scholar]
- 13.Gruselle O, Coche T. and Louahed J. (2015). Development of a quantitative real-time RT-PCR assay for the detection of MAGE-A3-positive tumors. J Mol Diagn 17:382–391 [DOI] [PubMed] [Google Scholar]
- 14.Germain E, Roghanian M, Gerdes K. and Maisonneuve E. (2015). Stochastic induction of persister cells by HipA through (p)ppGpp-mediated activation of mRNA endonucleases. Proc Natl Acad Sci U S A 112:5171–5176 [DOI] [PMC free article] [PubMed] [Google Scholar] [Retracted]
- 15.Flagella M, Bui S, Zheng Z, Nguyen CT, Zhang A, Pastor L, Ma Y, Yang W, Crawford KL, et al. (2006). A multiplex branched DNA assay for parallel quantitative gene expression profiling. Anal Biochem 352:50–60 [DOI] [PubMed] [Google Scholar]
- 16.Collins ML, Irvine B, Tyner D, Fine E, Zayati C, Chang C, Horn T, Ahle D, Detmer J, et al. (1997). A branched DNA signal amplification assay for quantification of nucleic acid targets below 100 molecules/ml. Nucleic Acids Res 25:2979–2984 [DOI] [PMC free article] [PubMed] [Google Scholar]
- 17.Kern D, Collins M, Fultz T, Detmer J, Hamren S, Peterkin JJ, Sheridan P, Urdea M, White R, Yeghiazarian T. and Todd J. (1996). An enhanced-sensitivity branched-DNA assay for quantification of human immunodeficiency virus type 1 RNA in plasma. J Clin Microbiol 34:3196–3202 [DOI] [PMC free article] [PubMed] [Google Scholar]
- 18.Foster DJ, Barros S, Duncan R, Shaikh S, Cantley W, Dell A, Bulgakova E, O'Shea J, Taneja N, et al. (2012). Comprehensive evaluation of canonical versus Dicer-substrate siRNA in vitro and in vivo. RNA 18:557–568 [DOI] [PMC free article] [PubMed] [Google Scholar]
- 19.Polach KJ, Matar M, Rice J, Slobodkin G, Sparks J, Congo R, Rea-Ramsey A, McClure D, Brunhoeber E, et al. (2011). Delivery of siRNA to the mouse lung via a functionalized lipopolyamine. Mol Ther 20:91–100 [DOI] [PMC free article] [PubMed] [Google Scholar]
- 20.Soutschek J, Akinc A, Bramlage B, Charisse K, Constien R, Donoghue M, Elbashir S, Geick A, Hadwiger P, et al. (2004). Therapeutic silencing of an endogenous gene by systemic administration of modified siRNAs. Nature 432:173–178 [DOI] [PubMed] [Google Scholar]
- 21.Hall JS, Usher S, Byers RJ, Higgins RC, Memon D, Radford JA. and Linton KM. (2015). QuantiGene Plex represents a promising diagnostic tool for cell-of-origin subtyping of diffuse large B-cell lymphoma. J Mol Diagn 17:402–411 [DOI] [PubMed] [Google Scholar]
- 22.Canales RD, Luo Y, Willey JC, Austermiller B, Barbacioru CC, Boysen C, Hunkapiller K, Jensen RV, Knight CR, et al. (2006). Evaluation of DNA microarray results with quantitative gene expression platforms. Nat Biotechnol 24:1115–1122 [DOI] [PubMed] [Google Scholar]
- 23.Brooks S, Higgs G, Janghra N, Jones L. and Dunnett SB. (2012). Longitudinal analysis of the behavioural phenotype in YAC128 (C57BL/6J) Huntington's disease transgenic mice. Brain Res Bull 88:113–120 [DOI] [PubMed] [Google Scholar]
- 24.Alterman J, Hall L, Coles A, Hassler M, Didiot M-C, Chase K, Abraham J, Sottosanti E, Johnson E, et al. (2015). Hydrophobic siRNAs silence huntingtin mRNA in primary neurons and mouse brain. Mol Ther Nucleic Acids [DOI] [PMC free article] [PubMed] [Google Scholar]
- 25.Byrne M, Tzekov R, Wang Y, Rodgers A, Cardia J, Ford G, Holton K, Pandarinathan L, Lapierre J, et al. (2013). Novel hydrophobically modified asymmetric RNAi compounds (sd-rxRNA) demonstrate robust efficacy in the eye. J Ocul Pharmacol Ther 29:855–864 [DOI] [PubMed] [Google Scholar]
- 26.Reed GF, Lynn F. and Meade BD. (2002). Use of coefficient of variation in assessing variability of quantitative assays. Clin Diagn Lab Immunol 9:1235–1239 [DOI] [PMC free article] [PubMed] [Google Scholar]
- 27.Armstrong TA, Chen H, Ziegler TE, Iyadurai KR, Gao AG, Wang Y, Song Z, Tian Q, Zhang Q, et al. (2013). Quantification of transgene-derived double-stranded RNA in plants using the QuantiGene nucleic acid detection platform. J Agric Food Chem 61:12557–12564 [DOI] [PubMed] [Google Scholar]