

Abstract
Aims
To conduct a systematic review and meta‐analysis of relevant randomized clinical trials (RCTs) to ascertain the effect size of orlistat in modulating plasma levels of adipokines, ghrelin and C‐reactive protein (CRP).
Methods
Medline, SCOPUS, Web of Science and Google Scholar databases were searched. A random‐effects model and the generic inverse variance method were used for quantitative data synthesis. Heterogeneity was quantitatively assessed using I 2 index. Sensitivity analyses were conducted using the one‐study remove approach. Random‐effects meta‐regression was performed using unrestricted maximum likelihood method to evaluate the impact of duration of treatment, percentage change in body mass index (BMI) and baseline BMI values as potential confounders of the estimated effect size.
Results
Meta‐analysis suggested a significant increase in plasma levels of adiponectin [weighted mean difference (WMD): 19.18%, 95% confidence interval (CI): 5.80, 32.57, p = 0.005] and significant reductions in plasma levels of leptin (WMD: −13.24%, 95% CI: −20.69, −5.78, p = 0.001) and CRP (WMD: −11.52%, 95% CI: −16.55, −6.49, p < 0.001) following treatment with orlistat. In meta‐regression, changes in plasma concentrations of adiponectin, leptin and CRP were associated with duration of treatment, but not with either change in BMI or baseline BMI values.
Conclusion
Orlistat is effective in increasing plasma concentrations of adiponectin and decreasing those of leptin and CRP.
What is Already Known about this Subject
Orlistat acts by blocking gastrointestinal lipase
Orlistat has been proven to be effective in reducing body weight
What this Study Adds
Effects of orlistat on insulin‐resistance are not well established
Our meta‐analysis proved that orlistat is effective in increasing plasma concentrations of adiponectin
Orlistat also decreased leptin and C reactive protein levels
Introduction
Overweight and obesity are conditions that substantially raise the risk of morbidity from hypertension, dyslipidemia, type 2 diabetes mellitus, coronary heart disease, stroke, gallbladder disease, osteoarthritis, sleep apnoea and respiratory problems, and endometrial, breast, prostate, and colon cancers 1. Insulin resistance is the major contributor to cardio‐metabolic complications of obesity 2. Insulin resistance is a pathological state in which insulin action is impaired in target tissues including liver, skeletal muscle, and adipose tissue 3. Adipose tissue plays an important role in insulin‐resistance: it releases a large number of bioactive mediators which modulate haemostasis, blood pressure, lipid and glucose metabolism, inflammation, and atherosclerosis 4. In particular, leptin and adiponectin are adipokines that appear to be produced exclusively by adipocytes 5. Adiponectin is an adipose‐specific collagen‐like plasma protein that is exclusively expressed in human adipose tissue 6, 7, but its expression decreases with increase in adiposity 8. Adiponectin actions include decreased gluconeogenesis, increased glucose uptake, triglyceride clearance, and protection from endothelial dysfunction. Leptin is strongly related in its structure to pro‐inflammatory cytokines and plays a major role in body weight regulation; in particular, leptin controls food intake, producing a feeling of satiety, and energy expenditure 9. Obesity is also linked to inflammatory state, because inflammation may be one of the links among obesity and insulin resistance, hypertension and cardiovascular disease 10. In this regard, C‐reactive protein (CRP) is a marker of inflammation, and elevated basal levels of CRP have been linked to increased risk of diabetes, hypertension and cardiovascular disease 10.
After the withdrawal of sibutramine's license due to the publication of data from the Sibutramine Cardiovascular Outcomes Trial (SCOUT) 11, orlistat had been the only molecule licensed in Europe as an anti‐obesity drug until January 2015, when liraglutide, an anti‐diabetic drug, was licensed for the treatment of obesity 12. Orlistat has a unique molecular structure, which allows it to bind to the active site of gastrointestinal lipase and block that enzyme activity. The enzyme is thus unable to break triglycerides (TG) down into their component parts 13. Orlistat proved to be effective in reducing body weight 14, 15, 16, 17; however, the effects of orlistat on insulin resistance are not well established, and findings of randomized controlled trials (RCTs) have not been conclusive 13. Hence, the aim of the present study was to conduct a systematic review and meta‐analysis of relevant RCTs in order to ascertain the effect size of orlistat in modulating insulin resistance.
Methods
Search strategy
To perform the present study, the 2009 Preferred Reporting Items for Systematic Reviews and Meta‐Analysis (PRISMA) statement was followed 18. A search in Medline, SCOPUS, Web of Science and Google Scholar databases was performed using the following terms in titles and abstracts: (adiponectin OR leptin OR adipokine OR adipokines OR adipocytokine OR adipocytokines OR “C‐reactive protein” OR CRP OR hsCRP OR hs‐CRP) AND (orlistat OR xenical). In order to increase the accuracy of search and avoid missing studies, the wild‐card term ‘*’ was used. The last search was performed on 18 May 2015.
Study selection
The eligibility criteria for inclusion of studies in the meta‐analysis were: (i) being a randomized parallel‐group or cross‐over controlled trial; (ii) comparison of the effect of orlistat in monotherapy versus control represented by diet alone or placebo; (iii) treatment effects on fasting concentrations of adipokines or CRP in serum or plasma, considering that there is evidence of a variation of adipokines in post‐prandial phase 19; (iv) providing baseline and end‐treatment plasma concentrations of adipokines or CRP in both orlistat and control groups, or presenting the net change values; and (v) English language. Exclusion criteria were: (i) non‐interventional studies; (ii) single‐arm and uncontrolled trials; (iii) case‐control, cross‐sectional or cohort studies; (iv) measurement of post‐prandial (instead of fasting) concentrations of adipokines or CRP; and (v) insufficient information on baseline or end‐treatment plasma concentrations of adipokines or CRP.
Data extraction
After reading the studies that met the inclusion criteria, the following information were extracted: (i) first author's name; (ii) publication year; (iii) study location; (iv) study design; (v) dose and duration of treatment with orlistat; (vi) inclusion criteria and baseline disease; (vii) number of subjects in the orlistat and control groups; (viii) age, gender and body mass index (BMI) of the studied populations; and (ix) plasma adipokines/CRP concentrations at baseline and study end, or changes in the mentioned parameters during the course of the trial.
Quality assessment
Risk of bias in the included studies was evaluated according to the Cochrane criteria 20. Risk of bias assessment according to the Cochrane criteria includes the following items: adequacy of sequence generation, allocation concealment, blinding, addressing of dropouts (incomplete outcome data), selective outcome reporting, and other potential sources of bias. According to the recommendations of the Cochrane Handbook, a judgment of ‘yes’ indicated low risk of bias, while ‘no’ indicated high risk of bias. Labelling an item as ‘unclear’ indicated an unclear or unknown risk of bias.
Quantitative data synthesis
The meta‐analysis procedure was conducted using Comprehensive Meta‐Analysis (CMA) V2 software (Biostat, NJ) 21. Change scores (defined as net changes in measurements) were calculated as follows: value at the end of treatment period − value at baseline. For cross‐over trials, change scores for plasma concentrations of adiponectin, leptin and CRP were calculated by subtracting the value after control intervention from that reported after treatment. Standard deviations (SDs) of the mean difference were calculated using the following formula: SD = √[(SDpre‐treatment)2 + (SDpost‐treatment)2 – (2R × SDpre‐treatment × SDpost‐treatment)], assuming a correlation coefficient (R) = 0.5 conversion of median and inter‐quartile range into mean and SD was performed according to the method described by Hozo et al. 22. Standard error of the mean (SEM) was converted to SD using the following formula: SD = SEM × √(n), where n is the number of subjects. When the results were presented in multiple time points, only values reported for the longest duration of treatment were considered.
A random‐effects model (using DerSimonian‐Laird method) and the generic inverse variance method was used for the meta‐analysis. The reason for choosing a random‐effects over a fixed‐effects model was to address the inter‐study heterogeneity in terms of demographic characteristics of studied populations and also differences in study designs. Heterogeneity was quantitatively assessed using the I 2 index. Effect sizes were expressed as weighted mean difference (WMD) and 95% confidence interval (CI). In order to evaluate the influence of each study on the overall effect size, sensitivity analysis was conducted using a leave‐one‐out approach that includes iteratively removing studies and repeating the analysis [23, 24].
Meta‐regression
Random‐effects meta‐regression was performed using the unrestricted maximum likelihood method to evaluate the association between calculated effect size and potential confounder variables including duration of treatment, percentage change in BMI and baseline BMI values.
Publication bias
Assessment of publication bias in the meta‐analysis was performed through visual inspection of Begg's funnel plot asymmetry, ‘fail‐safe N’ method, Begg's rank correlation test, and Egger's weighted regression test. Duval & Tweedie's ‘trim and fill’ method was used to correct the effects of publication bias in the meta‐analysis [25].
Results
Flow of included studies
The initial literature search yielded 534 articles. Of these 534 publications, 17 were selected for full‐text assessment. After careful assessment, 12 articles met the inclusion criteria and were selected for meta‐analysis 17, 26, 27, 28, 29, 30, 31, 32, 33, 34, 35, 36. Reasons for rejecting the other five articles were as follows: three were uncontrolled studies, one study was not written in English, and one study 37 reported data for the overall population without providing separate numerical values for leptin levels in the orlistat and placebo groups.
A summary of the study selection process is shown in Figure 1.
Figure 1.
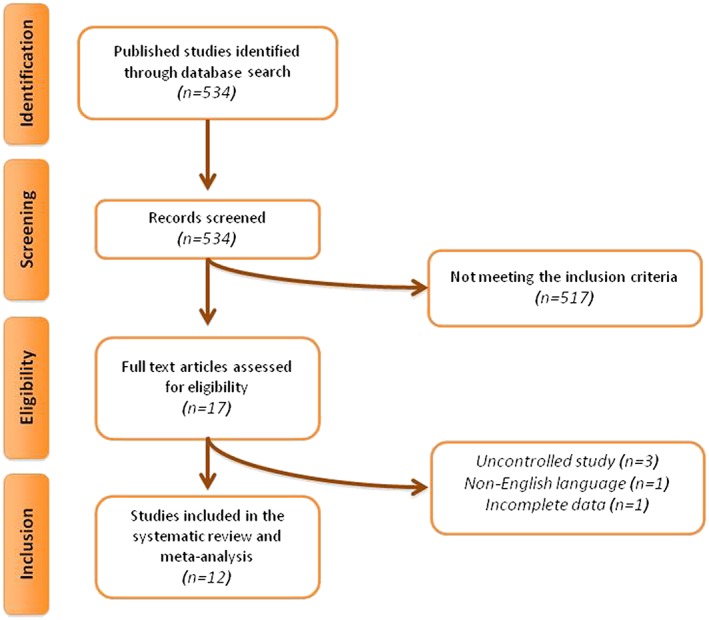
Flow chart of the number of studies identified and included into the meta‐analysis
Characteristics of included studies
A total of 823 subjects were included in the 12 eligible studies, comprising 417 subjects in the orlistat group and 406 in the control group. The largest study had a population size of 254 subjects 17, while the smallest study recruited 21 subjects 36. The included studies were published between 2004 and 2010, and were conducted in Italy 17, Greece 26, Brazil 27, 28, the UK 28, USA 29, 31, Taiwan 30, Denmark 32, 33 and Turkey 34, 35, 36.
The maximum licensed dose of orlistat (360 mg/day) was used in the included trials, with the exception of one study where the dose administered was not revealed 26. Duration of studies ranged from 3 months 34, 35, 36, 4 months 27, 6 months 26, 9 months 31, 12 months 17, 28, 29, 30 to 36 months 32, 33. All trials were designed as parallel‐group studies 17, 26, 27, 28, 29, 30, 31, 32, 33, 34, 35, 36, all were double arm parallel‐group studies 17, 26, 27, 28, 29, 30, 31, 32, 33, 34, 36, and one was a triple arm parallel‐group study 35. Selected studies were performed in overweight hypertensive subjects 27, in obese euglycemic subjects 26, 29, 30, 32, 33, 34, 35, 36, in obese type 2 diabetic patients 17, in obese patients with impaired glucose tolerance 28, and in overweight subjects with non‐alcoholic steatohepatitis 31. Baseline body weight and insulin resistance parameters were generally matched between orlistat and control groups in the included studies. All studies that measured CRP applied a high sensitivity assay. Demographic and baseline biochemical parameters of the included studies are shown in Tables 1, 2.
Table 1.
Demographic characteristics of the studies included (first part)
| Study | Bougoulia et al. 2006 26 | Borges et al. 2006 27 | Derosa et al. 2010 17 | Dixon et al. 2008 28 | Garcia et al. 2006 29 | Hsieh et al. 2005 30 |
|---|---|---|---|---|---|---|
| Location | Greece | Brazil | Italy | UK and Greece | USA | Taiwan |
| Design | Randomized, controlled parallel group | Randomized, controlled parallel group | Randomized, double‐blind placebo‐controlled parallel group | Randomized, non‐blinded, controlled parallel group | Randomized, controlled parallel group | Randomized, double‐blind placebo‐controlled parallel group |
| Treatment duration | 6 months | 4 months | 12 months | 12 months | 12 months | 12 months |
| Inclusion criteria | Obese women with normal glucose tolerance | Overweight, hypertensive, with central obesity women | Obesity and uncontrolled type 2 diabetes mellitus | Overweight and impaired glucose tolerance | Obese women of Mexican origin (both parents), aged 21–65 years | Overweight without any major systemic disease |
| Orlistat dose | NS | 120 mg three times a day | 120 mg three times a day | 120 mg three times a day | 120 mg three times a day | 120 mg three times a day |
| Control group | Hypocaloric diet | Hypocaloric diet | Placebo | Hypocaloric diet | Hypocaloric diet | Placebo |
| Participants | 71 | 24 | 254 | 31 | 48 | 106 |
| Orlistat | 35 | 14 | 126 | 16 | 25 | 51 |
| Control | 36 | 10 | 128 | 15 | 23 | 55 |
| Age (years) | ||||||
| Orlistat | 38.0 ± 7.1 | 47.9 ± 9.3 | 53 ± 6 | NS | 43.6 ± 7.9 | 36.3 ± 5.9 |
| Control | 35.4 ± 9·2 | 46.8 ± 5.8 | 52 ± 5 | NS | 44.0 ± 9.6 | 35.6 ± 6.7 |
| Male/Females | ||||||
| Orlistat | 0/35 | 0/24 | 62/64 | 7/9 | 0/25 | 21/30 |
| Control | 0/36 | 0/14 | 66/62 | 8/7 | 0/23 | 25/30 |
| Smokers | ||||||
| Orlistat | NS | NS | 46 | NS | NS | NS |
| Control | NS | NS | 41 | NS | NS | NS |
| BMI ( kg/m 2 ) | ||||||
| Orlistat | 37.2 ± 5.3 | 35.4 ± 5.9 | 33.1 ± 2.9 | 29.4 ± 3.0 | 37.7 ± 7.9 | 31.10 ± 2.11 |
| Control | 38.5 ± 7.0 | 36.0 ± 7.6 | 32.5 ± 2.3 | 27.3 ± 3.1 | 35.8 ± 5.28 | 31.12 ± 2.31 |
| HbA 1c (%) | ||||||
| Orlistat | NS | NS | 8.4 ± 1.4 | NS | 6.08 | NS |
| Control | NS | NS | 8.2 ± 1.3 | NS | 6.00 | NS |
| Adiponectin (μg/ml) | ||||||
| Orlistat | 0.0172 ± 0.0049 | 0.0065 ± 0.0018 | 5.0 ± 1.3 | 11.79 ± 5.35 | NA | 4.56 ± 1.06 |
| Control | 0.0205 ± 0.0062 | 0.0074 ± 0.0034 | 4.8 ± 1.1 | 12.97 ± 6.31 | NA | 4.88 ± 1.20 |
| Leptin (ng/ml) | ||||||
| Orlistat | 90.1 ± 30.0 | 39.4 ± 27.1 | 31.6 ± 15.9 | NA | 21.8 ± 13.0 | 13.89 ± 2.51 |
| Control | 88.7 ± 29.3 | 62.4 ± 31.9 | 30.9 ± 15.4 | NA | 18.7 ± 12.0 | 14.47 ± 2.56 |
| CRP (mg/l) | ||||||
| Orlistat | 9.37 ± 5.5 | 0.00095 ± 0.00081 | 2.5 ± 1.6 | 6.08 ± 4.68 | NA | 3.04 ± 0.34 |
| Control | 8.58 ± 3.9 | 0.00048 ± 0.00045 | 2.3 ± 1.4 | 5.00 ± 6.26 | 3.09 ± 0.18 | |
| Ghrelin (pg/ml) | ||||||
| Orlistat | NA | NA | NA | NA | 589 ± 225 | NA |
| Control | NA | NA | NA | NA | 596 ± 242 | NA |
| Resistin (ng/ml) | ||||||
| Orlistat | 22.3 ± 8.1 | NA | NA | NA | NA | NA |
| Control | 23.7 ± 9.1 | NA | NA | NA | NA | NA |
Values are expressed as mean ± SD or median (interquartile range).
Abbreviations: HbA1c: glycated haemoglobin; TC: total cholesterol; Tg: triglicerides; HDL‐C: high‐density lipoprotein cholesterol; CRP: C‐reactive protein (high sensitivity assay); NS: not stated; NA: not applicable.
Table 2.
Demographic characteristics of the studies included (second part)
| Study | Harrison et al. 2008 31 | Madsen et al. 2009 32 | Madsen et al. 2008 33 | Ozcelik et al. 2004 34 | Ozcelik et al. 2005 35 | Ozkan et al. 2009 36 |
|---|---|---|---|---|---|---|
| Location | USA | Denmark | Denmark | Turkey | Turkey | Turkey |
| Design | Randomized, controlled parallel group | Randomized double‐blind, placebo‐controlled parallel group | Randomized, double‐blind placebo‐controlled parallel group | Randomized, double‐blind placebo‐controlled parallel group | Randomized, double‐blind placebo‐controlled three parallel group | Randomized, controlled parallel group |
| Treatment duration | 9 months | 36 months | 36 months | 3 months | 3 months | 3 months |
| Inclusion criteria | Overweight with non‐alcoholic steatohepatitis | Abdominally obese subjects with impaired fasting glucose and/or dyslipidemia | Abdominally obese subjects with impaired fasting glucose and/or dyslipidemia | Obese women aged 18–50 years | Obese women aged 18–50 years | Obese subjects |
| Orlistat dose | 120 mg three times a day | 120 mg three times a day | 120 mg three times a day | 120 mg three times a day | 120 mg three times a day | 120 mg three times a day |
| Control group | Hypocaloric diet | Placebo | Placebo | Placebo | Hypocaloric diet | Hypocaloric diet |
| Participants | 41 | 68 | 93 | 24 | 24 | 21 |
| Orlistat | 23 | 35 | 49 | 14 | 8 | 11 |
| Control | 18 | 33 | 44 | 10 | 8 | 10 |
| Orlistat + diet | 8 | |||||
| Age (years) | 37.4 ± 12.4 | |||||
| Orlistat | 47.9 ± 7.5 | NS | NS | 38.7 ± 2.9 | 38.0 ± 3.1 | |
| Control | 45.8 ± 10.7 | NS | NS | 40.6 ± 1.8 | 43.0 ± 2.1 | |
| Male/Females | 6/15 | |||||
| Orlistat | 7/16 | NS | NS | 0/14 | 8 | |
| Control | 6/12 | NS | NS | 0/10 | 8 | |
| Smokers | ||||||
| Orlistat | NS | NS | NS | NS | NS | NS |
| Control | NS | NS | NS | NS | NS | NS |
| BMI ( kg/m 2 ) | ||||||
| Orlistat | 37.3 ± 6.0 | 33.0 ± 3.3 | 32.7 (31.5–33.9) | 37.7 ± 1.1 | NA | 37.7 ± 3.1 |
| Control | 35.2 ± 6.5 | 33.0 ± 3.9 | 32.8 (31.6–34.1) | 39.4 ± 1.3 | NA | 36.2 ± 2.8 |
| HbA 1c (%) | ||||||
| Orlistat | 5.7 ± 0.6 | NA | NA | NA | NA | NA |
| Control | 5.8 ± 1.2 | NA | NA | NA | NA | NA |
| Adiponectin (μg/ml) | ||||||
| Orlistat | 9.9 × 10⁻⁶ ± 6.3 × 10⁻⁶ | NA | 0.49 (0.41–0.58) | NA | NA | NA |
| Control | 8.7 × 10⁻⁶ ± 3.8 × 10⁻⁶ | NA | 0.5 (0.42–0.6) | NA | NA | NA |
| Leptin (ng/ml) | ||||||
| Orlistat | NA | 470.2 (336.8–656.5) | 16.2 ± 1.2 | 16.1 ± 1.4 | 37.0 ± 21.0 | |
| Control | NA | 352.9 (243.3–512) | 19.3 ± 2.1 | 20.6 ± 1.7 | 36.4 ± 17.5 | |
| CRP (mg/l) | ||||||
| Orlistat | NA | NA | 2.6 (2.3–2.8) | NA | NA | NA |
| Control | NA | NA | 2.2 (2.0–2.4) | NA | NA | NA |
| Ghrelin (fmol/ml) | ||||||
| Orlistat | NA | NA | NA | NA | NA | 59.4 ± 27.5 |
| Control | NA | NA | NA | NA | NA | 59.1 ± 34.7 |
| Resistin (pg/ml) | ||||||
| Orlistat | 12.6 ± 11.2 | NA | NA | NA | NA | NA |
| Control | 11.8 ± 5.7 | NA | NA | NA | NA | NA |
Values are expressed as mean ± SD or median (interquartile range).
Abbreviations: HbA1c: glycated haemoglobin; TC: total cholesterol; Tg: triglicerides; HDL‐C: high‐density lipoprotein cholesterol; CRP: C‐reactive protein (high sensitivity assay); NS: not stated; NA: not applicable.
Quality assessment
Only one of the selected studies provided sufficient data about random sequence generation and allocation concealment 16. Nevertheless, other potential sources of bias were sufficiently addressed by most of the included trials. Details on the risk of bias among included trials are summarized in Table 3.
Table 3.
Risk of bias assessment in the studies considered for meta‐analysis
| Study | Random sequence generation | Allocation concealment | Blinding | Incomplete outcome data | Selective reporting | Free of other bias |
|---|---|---|---|---|---|---|
| Bogulia et al. 2006 26 | L | U | H | L | L | L |
| Borges et al. 2006 27 | L | U | H | L | L | L |
| Derosa et al. 2010 17 | L | L | L | L | L | L |
| Dixon et al. 2008 28 | L | U | H | L | L | L |
| Garcia et al. 2006 29 | L | U | U | L | L | L |
| Hsieh et al. 2005 30 | L | U | L | L | L | L |
| Harrison et al. 2008 31 | L | U | H | L | L | L |
| Madsen et al. 2009 32 | L | U | L | L | L | L |
| Madsen et al. 2008 33 | L | U | L | L | L | L |
| Ozcelik et al. 2004 34 | L | U | L | L | L | L |
| Ozcelik et al. 2005 35 | L | U | H | L | L | L |
| Ozkan et al. 2009 36 | L | U | H | L | L | L |
Criteria defined for quality assessment are based on the Cochrane guidelines.
Abbreviations: H: high risk of bias; L: low risk of bias; U: unclear or unrevealed risk of bias.
Effect of orlistat on plasma adipokines and CRP
The impact of orlistat on plasma levels of leptin, adiponectin, resistin, ghrelin and CRP were reported in nine, seven, two, two and six RCTs, respectively. Meta‐analysis suggested a significant increase in plasma levels of adiponectin (WMD: 19.18%, 95% CI: 5.80, 32.57, p = 0.005) and significant reductions in plasma levels of leptin (WMD: −13.24%, 95% CI: −20.69, −5.78, p = 0.001) and CRP (WMD: −11.52%, 95% CI: −16.55, −6.49, p < 0.001) following treatment with orlistat (Figure 2). All these effect sizes turned out to be robust in the leave‐one‐out sensitivity analysis. No significant change in plasma levels of resistin (WMD: 18.05, 95% CI: −27.40, 63.51, p = 0.436) and ghrelin (WMD: 12.47, 95% CI: 7.97, 16. 97, p < 0.001) were found (Figure 3).
Figure 2.
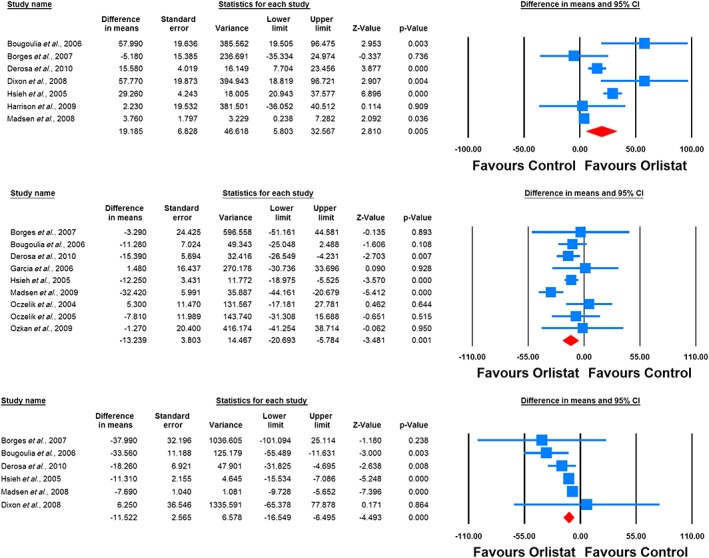
Forest plot detailing weighted mean difference and 95% confidence intervals for the impact of orlistat on plasma concentrations of adiponectin (upper plot), leptin (middle plot) and C‐reactive protein (lower plot)
Figure 3.
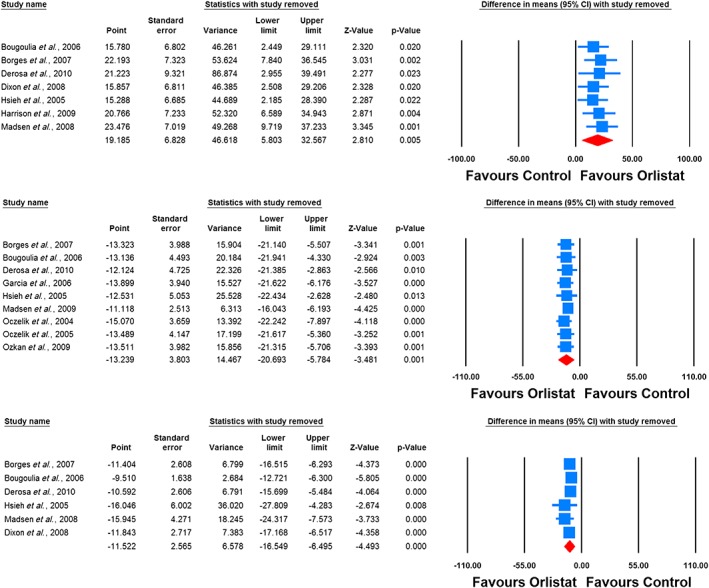
Leave‐one‐out sensitivity analysis for the impact of orlistat on plasma concentrations of adiponectin (upper plot), leptin (middle plot) and C‐reactive protein (lower plot)
When the studies were categorized according to the duration of treatment, adiponectin‐elevating and leptin‐lowering effects of orlistat were significant only in the subgroup of RCTs lasting ≥ 48 weeks (WMD: 20.28%, 95% CI: 4.89, 35.67, p = 0.010 [adiponectin]; WMD: −17.46%, 95% CI: −28.49, −6.43, p = 0.002 [leptin]). With respect to CRP, significant reductions were observed in both subgroups lasting ≥ 48 weeks (WMD: −9.50%, 95% CI: −12.84, −6.16, p < 0.001) and < 48 weeks (WMD: −34.04%, 95% CI: −54.75, −13.32, p = 0.001) (Figure 4).
Figure 4.
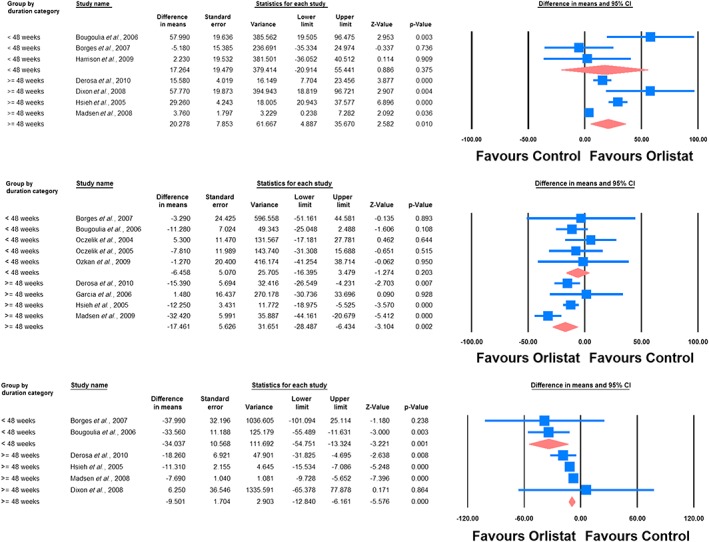
Forest plot detailing weighted mean difference and 95% confidence intervals for the impact of orlistat on plasma concentrations of adiponectin (upper plot), leptin (middle plot) and C‐reactive protein (lower plot) in subgroups of trials with treatment durations of < 48 weeks and ≥ 48 weeks
Meta‐regression
Random‐effects meta‐regression was performed to assess the impact of potential moderator variables on the adipokine and CRP responses to orlistat in the included RCTs. Changes in plasma concentrations of adiponectin (slope: −0.18; 95% CI: −0.28, −0.08; p < 0.001), leptin (slope: −0.21; 95% CI: −0.33, −0.09; p < 0.001) and CRP (slope: 0.05; 95% CI: 0.01, 0.10; p = 0.021) were found to be significantly associated with duration of treatment with orlistat (Figure 5). Nevertheless, meta‐regression did not suggest any significant association of the assessed parameters (leptin, adiponectin and CRP) with either changes in BMI or baseline BMI values (Figures 6, 7).
Figure 5.
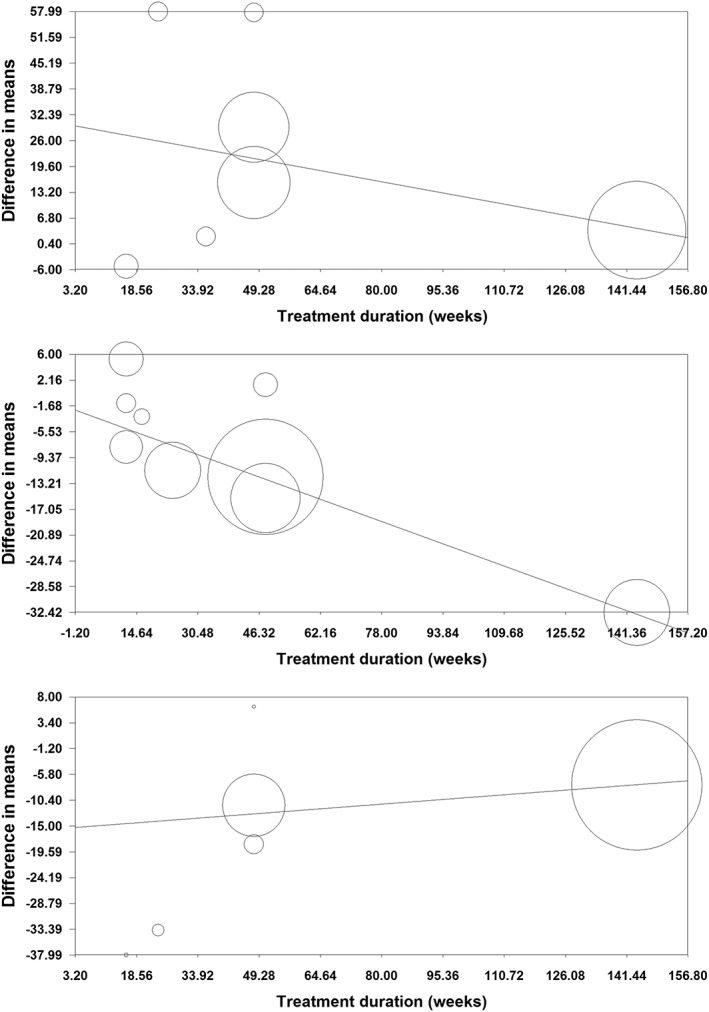
Meta‐regression bubble plots of the association of mean changes in plasma concentrations of adiponectin (upper plot), leptin (middle plot) and C‐reactive protein (lower plot) with treatment duration. The size of each circle is inversely proportional to the variance of change
Figure 6.
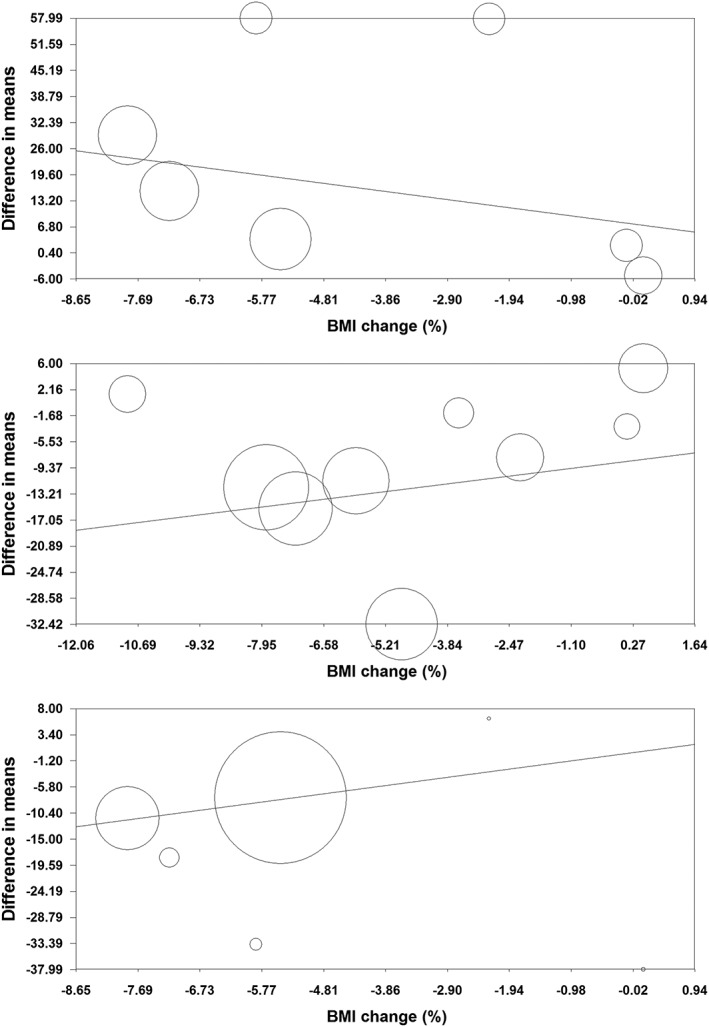
Meta‐regression bubble plots of the association of mean changes in plasma concentrations of adiponectin (upper plot), leptin (middle plot) and C‐reactive protein (lower plot) with percentage changes in BMI. The size of each circle is inversely proportional to the variance of change
Figure 7.
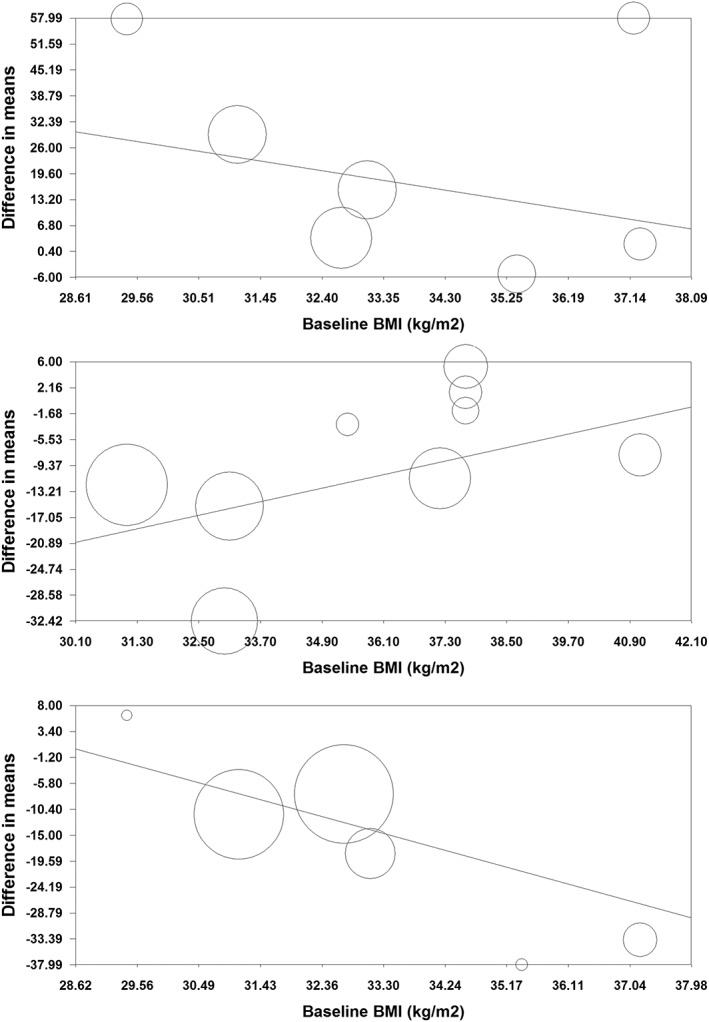
Meta‐regression bubble plots of the association of mean changes in plasma concentrations of adiponectin (upper plot), leptin (middle plot) and C‐reactive protein (lower plot) with baseline BMI. The size of each circle is inversely proportional to the variance of change
Publication bias
The funnel plot of precision (inverse standard error) versus effect size (mean difference) did not suggest any potential publication bias in the meta‐analysis of orlistat's effect on plasma adiponectin concentrations. However, the funnel plots for the analysis of orlistat's effects on plasma leptin and CRP concentrations were asymmetric, suggesting potential publication bias. Using the ‘trim and fill’ method, one potentially missing study was imputed for themeta‐analysis of leptin changes, yielding an imputed effect size of −11.23% (95% CI: −16.08, −6.39). With respect to the leptin meta‐analysis, four potentially missing studies were imputed, yielding an effect size of −16.60% (95% CI: −23.82, −9.37) (Figure 8). For all analyses, there was no sign of publication bias according to the Begg's rank correlation, Egger's linear regression, and ‘fail‐safe N’ tests (Table 4).
Figure 8.
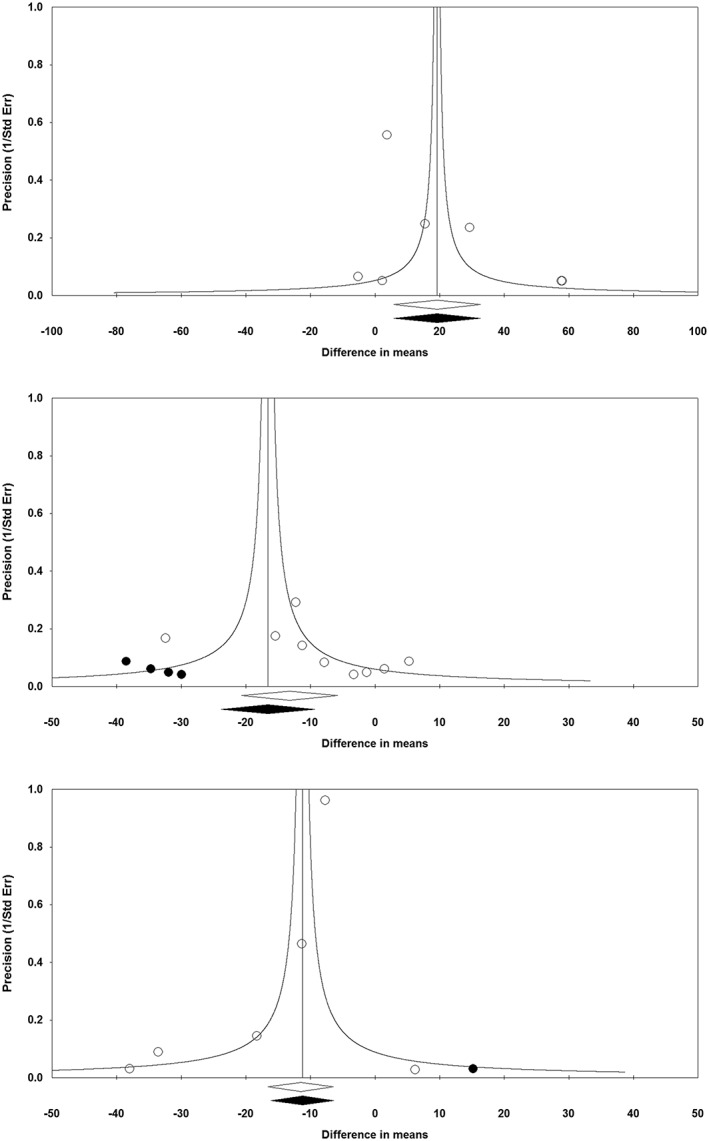
Funnel plot detailing publication bias in the studies reporting the impact of orlistat on plasma concentrations of adiponectin (upper plot), leptin (middle plot) and C‐reactive protein (lower plot)
Table 4.
Assessment of publication bias in the meta‐analysis of studies reporting the effects of orlistat on plasma concentrations of adiponectin, leptin and CRP
| Begg's rank correlation test | Egger's linear regression test | ||||||||
|---|---|---|---|---|---|---|---|---|---|
| Kendall's Tau a | z‐value | p‐value b | Intercept | 95% CI | t | df | p‐value b | n c | |
| Adiponectin | 0.29 | 0.90 | 0.37 | 2.04 | −1.54, 5.63 | 1.47 | 5 | 0.202 | 83 |
| Leptin | 0.08 | 0.31 | 0.754 | 0.84 | −1.17, 2.84 | 0.99 | 7 | 0.356 | 40 |
| CRP | 0 | 0 | 1.000 | −1.23 | −2.89, 0.43 | 2.06 | 4 | 0.109 | 91 |
With continuity correction;
Two‐tailed;
The number of studies (calculated using the ‘fail‐safe N’ method) required to make the p‐value non‐significant.
Discussion
The main finding of the present meta‐analysis is the positive effect of orlistat in increasing adiponectin and decreasing leptin and CRP levels. Adiponectin is secreted by adipocytes and has been linked to glucose and lipid regulation. Adiponectin is decreased in obesity and is inversely related to glucose and insulin levels; adiponectin stimulates oxidation of fatty acids, suppresses gluconeogenesis and inhibits monocyte adhesion, macrophage transformation, and proliferation and migration of smooth muscle cells in blood vessels 38. Leptin, instead, contributes to body weight regulation by controlling food intake and energy expenditure at the hypothalamic level. Leptin abnormalities have been proposed to increase the propensity to obesity [39]. Regarding CRP, increased serum levels of inflammatory biomarkers have been reported in obese subjects and have been related to the degree of insulin resistance and endothelial dysfunction 40. The positive effects of orlistat on these markers, cannot be explained only by change in body weight, as our meta‐regression did not suggest any significant association between changes in plasma concentrations of leptin, adiponectin and CRP with changes in BMI. Regarding the mechanism through which orlistat increases adiponectin, a possible explanation could be the action of orlistat on intestinal microbiota: circulating endotoxin lipopolysaccharide (LPS) is produced by commensal bacteria within the gut, and orlistat's effect on gut flora leads to a change in circulating LPS levels. This is an important effect, considering that a correlation between the reduction in LPS and the increase in adiponectin levels has been previously reported 28. Regarding the decrease of leptin levels with orlistat, while reductions in adipose tissue and insulin resistance are influential, a direct action of orlistat has also been suggested 41, though the mechanism is still unknown. Considering orlistat effects on CRP, several mechanisms have been suggested to elucidate the obesity‐related low‐grade inflammation. Firstly, fat tissue is an important source of proinflammatory and anti‐inflammatory substances; moreover, inflammation of the adipose tissue worsens insulin resistance. Secondly, insulin resistance can increase inflammation by interfering with the anti‐inflammatory effect of insulin. Therefore reducing body weight may explain, at least in part, the CRP‐lowering effect of orlistat which is in line with what has been reported previously 15, 16, 17, 18.
Regarding ghrelin and resistin, serum ghrelin levels are reduced in obese individuals compared with age‐matched non‐obese controls [42], and increased during weight loss following dietary treatment. Ghrelin is secreted into the circulation from intestinal structures, and it increases appetite while decreasing adipose tissue utilization [42]. Conversely, resistin has been reported to be elevated in adipose tissue and serum of obese and insulin‐resistant individuals, although studies have produced controversial results [38]. Resistin appears to confer an increased risk of inflammation and atherosclerosis. Our meta‐analysis showed a neutral effect of orlistat on ghrelin and resistin levels, in contrast with what has been reported previously [14, 36]; this can be explained by the fact that previous evidence might have come from single‐arm, quasi‐randomized and uncontrolled studies, or even animal studies. Our pooled result comes from RCT as the highest level of evidence. Moreover, studies included in our meta‐analysis enrolled obese subjects, but some studies included obese diabetic patients, and there is evidence that orlistat effects are less pronounced in diabetics. In fact, people with diabetes often take medications that are associated with weight gain; these include antihyperglycaemic, antihypertensive, pain relief and antidepressant agents [43]. In this paper we did not evaluate orlistat's effects on lipid changes, or glycaemic control, because they were not within the goal of this review and meta‐analysis and the literature search was not specified for such effects of orlistat. However, interestingly, a recently published meta‐analysis discussed this, reporting the positive effects of orlistat on glycaemic control 44. Taking into account our results and the results reported by Aldekhail et al. 44, we can suggest a positive effect of orlistat on insulin resistance.
The present meta‐analysis has some limitations. Included studies were heterogeneous regarding population characteristics, study design and duration of supplementation. Nevertheless, the impact of heterogeneity on estimated effect sizes was minimized by choosing a random‐effects mode of analysis. As is inherent with almost every meta‐analysis, there is the possibility that some relevant RCTs have been missed. We tried to address this potential limitation by performing several assessments of publication bias. Finally, there was no substantial variation in the orlistat dose across the included trials, and therefore the dose dependence of the observed effect could not be evaluated.
Conclusion
The present systematic review is the first to assess the effects of orlistat on adipokines and CRP, and provides a thorough synthesis of results from RCTs. The main finding of this meta‐analysis is that orlistat is effective in increasing adiponectin and decreasing leptin and CRP, but has a neutral effect on ghrelin and resistin. Future studies are warranted to assess the impact of these positive effects of orlistat on insulin sensitivity using the gold standard hyperinsulinemic euglycaemic clamp method. Further, evaluation of the effects of orlistat, either alone or combined with hypolipidemic drugs 45, 46, 47, on hard outcomes of obesity and obesity‐related disorders is open to question. Also the effects of orlistat on tumour necrosis factor‐α, as an adipose‐derived inflammatory parameter, could be of interest for a future meta‐analysis.
Competing Interests
All authors have completed the Unified Competing Interest form at www.icmje.org/coi_disclosure.pdf (available on request from the corresponding author) and declare: no support from any organization for the submitted work; no financial relationships with any organizations that might have an interest in the submitted work in the previous three years; no other relationships or activities that could appear to have influenced the submitted work.
Contributors
All the authors were responsible for the design, conduct and data collection of this study. Amirhossein Sahebkar was responsible for the data analysis, but all authors took part in the writing of the manuscript.
Derosa, G. , Maffioli, P. , and Sahebkar, A. (2016) Improvement of plasma adiponectin, leptin and C‐reactive protein concentrations by orlistat: a systematic review and meta‐analysis. Br J Clin Pharmacol, 81: 819–834. doi: 10.1111/bcp.12874.
References
- 1. Expert Panel on the Identification, Evaluation, and Treatment of Overweight and Obesity in Adults . Clinical guidelines on the identification, evaluation, and treatment of overweight and obesity in adults: executive summary. Am J Clin Nutr 1998; 68: 899–917. [DOI] [PubMed] [Google Scholar]
- 2. Ter Horst KW, Gilijamse PW, Koopman KE, de Weijer BA, Brands M, Kootte RS, Romijn JA, Ackermans MT, Nieuwdorp M, Soeters MR, Serlie MJ. Insulin resistance in obesity can be reliably identified from fasting plasma insulin. Int J Obes (Lond) 2015; 39: 1703–9. [DOI] [PubMed] [Google Scholar]
- 3. Taniguchi CM, Emanuelli B, Kahn CR. Critical nodes in signaling pathways: insights into insulin action. Nat Rev Mol Cell Biol 2006; 7: 85–96. [DOI] [PubMed] [Google Scholar]
- 4. Rabe K, Lehrke M, Parhofer KG, Broedl UC. Adipokines and insulin resistance. Mol Med 2008; 14: 741–51. [DOI] [PMC free article] [PubMed] [Google Scholar]
- 5. Yadav A, Kataria MA, Saini V, Yadav A. Role of leptin and adiponectin in insulin resistance. Clin Chim Acta 2013; 417: 80–4. [DOI] [PubMed] [Google Scholar]
- 6. Ouchi N, Walsh K. A novel role for adiponectin in the regulation of inflammation. Arterioscler Thromb Vasc Biol 2008; 28: 1219–21. [DOI] [PubMed] [Google Scholar]
- 7. Vasseur F, Leprêtre F, Lacquemant C, Froguel P. The genetics of adiponectin. Curr Diab Rep 2003; 3: 151–8. [DOI] [PubMed] [Google Scholar]
- 8. Scherer PE, Williams S, Fogliano M, Baldini G, Lodish HF. A novel serum protein similar to C1q, produced exclusively in adipocytes. J Biol Chem 1995; 270: 26746–9. [DOI] [PubMed] [Google Scholar]
- 9. Friedman J Fat in all the wrong places. Nature 2002; 415: 268–9. [DOI] [PubMed] [Google Scholar]
- 10. Fernández‐Real JM, Ricart W. Insulin resistance and chronic cardiovascular inflammatory syndrome. Endocr Rev 2003; 24: 278–301. [DOI] [PubMed] [Google Scholar]
- 11. James WP, Caterson ID, Coutinho W, Finer N, Van Gaal LF, Maggioni AP, Torp‐Pedersen C, Sharma AM, Shepherd GM, Rode RA, Renz CL; SCOUT Investigators. Effect of sibutramine on cardiovascular outcomes in overweight and obese subjects. N Engl J Med 2010; 363(10): 972–4. [DOI] [PubMed] [Google Scholar]
- 12. European Medicines Agency . Saxenda recommended for approval in weight management for adults. Press release, 23 January 2015 [online]. Available at http://www.ema.europa.eu/ema/index.jsp?curl=pages/news_and_events/news/2015/01/news_detail_002255.jsp&mid=WC0b01ac058004d5c1 (last accessed 10 February 2016).
- 13. Derosa G, Maffioli P. Anti‐obesity drugs: a review about their effects and their safety. Expert Opin Drug Saf 2012; 11: 459–71. [DOI] [PubMed] [Google Scholar]
- 14. Derosa G, Cicero AF, D'Angelo A, Fogari E, Maffioli P. Effects of 1‐year orlistat treatment compared to placebo on insulin resistance parameters in patients with type 2 diabetes. J Clin Pharm Ther 2012; 37: 187–95. [DOI] [PubMed] [Google Scholar]
- 15. Derosa G, Maffioli P, Ferrari I, D'Angelo A, Fogari E, Palumbo I, Randazzo S, Cicero AF. Comparison between orlistat plus l‐carnitine and orlistat alone on inflammation parameters in obese diabetic patients. Fundam Clin Pharmacol 2011; 25: 642–51. [DOI] [PubMed] [Google Scholar]
- 16. Derosa G, Maffioli P, Ferrari I, D'Angelo A, Fogari E, Palumbo I, Randazzo S, Cicero AF. Orlistat and L‐carnitine compared to orlistat alone on insulin resistance in obese diabetic patients. Endocr J 2010; 57: 777–86. [DOI] [PubMed] [Google Scholar]
- 17. Derosa G, Maffioli P, Salvadeo SA, Ferrari I, Gravina A, Mereu R, D'Angelo A, Fogari E, Palumbo I, Randazzo S, Cicero AF. Comparison of orlistat treatment and placebo in obese type 2 diabetic patients. Expert Opin Pharmacother 2010; 11: 1971–82. [DOI] [PubMed] [Google Scholar]
- 18. Moher D, Liberati A, Tetzlaff J, Altman DG; PRISMA Group. Preferred reporting items for systematic reviews and meta‐analyses: the PRISMA statement. BMJ 2009; 339: b2535. [DOI] [PMC free article] [PubMed] [Google Scholar]
- 19. Derosa G, D'Angelo A, Salvadeo SA, Ferrari I, Fogari E, Gravina A, Mereu R, Palumbo I, Maffioli P, Randazzo S, Cicero AF. Oral glucose tolerance test effects on endothelial inflammation markers in healthy subjects and diabetic patients. Horm Metab Res 2010; 42: 8–13. [DOI] [PubMed] [Google Scholar]
- 20. Higgins JPT, Green S, eds. Cochrane Handbook for Systematic Reviews of Interventions. Version 5.0.2. London: The Cochrane Collaboration; 2009. [Google Scholar]
- 21. Borenstein M, Hedges L, Higgins J, Rothstein H. Comprehensive meta‐analysis. Version 2. Englewood Cliffs, NJ: Biostat; 2005. [Google Scholar]
- 22. Hozo SP, Djulbegovic B, Hozo I. Estimating the mean and variance from the median, range, and the size of a sample. BMC Med Res Methodol 2005; 5: 13. [DOI] [PMC free article] [PubMed] [Google Scholar]
- 23. Ferretti G, Bacchetti T, Sahebkar A. Effect of statin therapy on paraoxonase‐1 status: A systematic review and meta‐analysis of 25 clinical trials. Prog Lipid Res 2015; 60: 50–73. [DOI] [PubMed] [Google Scholar]
- 24. Sahebkar A Are curcuminoids effective C‐reactive protein‐lowering agents in clinical practice? Evidence from a meta‐analysis. Phytother Res 2014; 28: 633–42. [DOI] [PubMed] [Google Scholar]
- 25. Duval S, Tweedie R. Trim and fill: a simple funnel‐plot‐based method of testing and adjusting for publication bias in meta‐analysis. Biometrics 2000; 56: 455–63. [DOI] [PubMed] [Google Scholar]
- 26. Bougoulia M, Triantos A, Koliakos G. Effect of weight loss with or without orlistat treatment on adipocytokines, inflammation, and oxidative markers in obese women. Hormones (Athens) 2006; 5: 259–69. [DOI] [PubMed] [Google Scholar]
- 27. Borges RL, Ribeiro‐Filho FF, Carvalho KM, Zanella MT. Impact of weight loss on adipocytokines, C‐reactive protein and insulin sensitivity in hypertensive women with central obesity. Arq Bras Cardiol 2007; 89: 409–14. [DOI] [PubMed] [Google Scholar]
- 28. Dixon AN, Valsamakis G, Hanif MW, Field A, Boutsiadis A, Harte A, McTernan PG, Barnett AH, Kumar S. Effect of the orlistat on serum endotoxin lipopolysaccharide and adipocytokines in South Asian individuals with impaired glucose tolerance. Int J Clin Pract 2008; 62: 1124–9. [DOI] [PubMed] [Google Scholar]
- 29. Garcia JM, Iyer D, Poston WS, Marcelli M, Reeves R, Foreyt J, Balasubramanyam A. Rise of plasma ghrelin with weight loss is not sustained during weight maintenance. Obesity (Silver Spring) 2006; 14: 1716–23. [DOI] [PubMed] [Google Scholar]
- 30. Hsieh CJ, Wang PW, Liu RT, Tung SC, Chien WY, Chen JF, Chen CH, Kuo MC, Hu YH. Orlistat for obesity: benefits beyond weight loss. Diabetes Res Clin Pract 2005; 67: 78–83. [DOI] [PubMed] [Google Scholar]
- 31. Harrison SA, Fecht W, Brunt EM, Neuschwander‐Tetri BA. Orlistat for overweight subjects with nonalcoholic steatohepatitis: a randomized, prospective trial. Hepatology 2009; 49: 80–6. [DOI] [PubMed] [Google Scholar]
- 32. Madsen EL, Bruun JM, Skogstrand K, Hougaard DM, Christiansen T, Richelsen B. Long‐term weight loss decreases the nontraditional cardiovascular risk factors interleukin‐18 and matrix metalloproteinase‐9 in obese subjects. Metabolism 2009; 58: 946–53. [DOI] [PubMed] [Google Scholar]
- 33. Madsen EL, Rissanen A, Bruun JM, Skogstrand K, Tonstad S, Hougaard DM, Richelsen B. Weight loss larger than 10% is needed for general improvement of levels of circulating adiponectin and markers of inflammation in obese subjects: a 3‐year weight loss study. Eur J Endocrinol 2008; 158: 179–87. [DOI] [PubMed] [Google Scholar]
- 34. Ozcelik O, Dogan H, Kelestimur H. Effects of a weight‐reduction program with orlistat on serum leptin levels in obese women: a 12‐week, randomized, placebo‐controlled study. Curr Ther Res Clin Exp 2004; 65: 127–37. [DOI] [PMC free article] [PubMed] [Google Scholar]
- 35. Ozcelik O, Dogan H, Celik H, Ayar A, Serhatlioglu S, Kelestimur H. Effects of different weight loss protocols on serum leptin levels in obese females. Physiol Res 2005; 54: 271–7. [PubMed] [Google Scholar]
- 36. Ozkan Y, Aydin S, Donder E, Koca SS, Aydin S, Ozkan B, Sahin I. Effect of orlistat on the total ghrelin and leptin levels in obese patients. J Physiol Biochem 2009; 65: 215–23. [DOI] [PubMed] [Google Scholar]
- 37. Toornvliet AC, Pijl H, Frölich M, Westendorp RG, Meinders AE. Insulin and leptin concentrations in obese humans during long‐term weight loss. Neth J Med 1997; 51: 96–102. [DOI] [PubMed] [Google Scholar]
- 38. Jackson MB, Ahima RS. Neuroendocrine and metabolic effects of adipocyte‐derived hormones. Clin Sci (Lond) 2006; 110: 143–52. [DOI] [PubMed] [Google Scholar]
- 39. Wauters M, Considine RV, Van Gaal LF. Human leptin: from an adipocyte hormone to an endocrine mediator. Eur J Endocrinol 2000; 143: 293–311. [DOI] [PubMed] [Google Scholar]
- 40. Derosa G, Fogari E, D'Angelo A, Bianchi L, Bonaventura A, Romano D, Maffioli P. Adipocytokine levels in obese and non‐obese subjects: an observational study. Inflammation 2013; 36: 914–20. [DOI] [PubMed] [Google Scholar]
- 41. Dimitrov D, Bohchelian H, Koeva L. Effect of orlistat on plasma leptin levels and risk factors for the metabolic syndrome. Metab Syndr Relat Disord 2005; 3: 122–9. [DOI] [PubMed] [Google Scholar]
- 42. Ariyasu H, Takaya K, Tagami T, Ogawa Y, Hosoda K, Akamizu T, Suda M, Koh T, Natsui K, Toyooka S, Shirakami G, Usui T, Shimatsu A, Doi K, Hosoda H, Kojima M, Kangawa K, Nakao K. Stomach is a major source of circulating ghrelin, and feeding state determines plasma ghrelin like immunoreactivity levels in humans. J Clin Endocrinol Metab 2001; 86: 4753–8. [DOI] [PubMed] [Google Scholar]
- 43. Canadian Diabetes Association Clinical Practice Guidelines Expert Committee , Wharton S, Sharma AM, Lau DC. Weight management in diabetes. Can J Diabetes 2013; 37: S82‐6. [DOI] [PubMed] [Google Scholar]
- 44. Aldekhail NM, Logue J, McLoone P, Morrison DS. Effect of orlistat on glycaemic control in overweight and obese patients with type 2 diabetes mellitus: a systematic review and meta‐analysis of randomized controlled trials. Obes Rev 2015; 16: 1071–80. [DOI] [PubMed] [Google Scholar]
- 45. Sahebkar A, Chew GT, Watts GF. Recent advances in pharmacotherapy for hypertriglyceridemia. Prog Lipid Res 2014; 56: 47–66. [DOI] [PubMed] [Google Scholar]
- 46. Sahebkar A, Watts GF. New therapies targeting apoB metabolism for high‐risk patients with inherited dyslipidaemias: what can the clinician expect? Cardiovasc Drugs Ther 2013; 27: 559–67. [DOI] [PubMed] [Google Scholar]
- 47. Sahebkar A, Chew GT, Watts GF. New peroxisome proliferator‐activated receptor agonists: potential treatments for atherogenic dyslipidemia and non‐alcoholic fatty liver disease. Expert Opin Pharmacother 2014; 15: 493–503. [DOI] [PubMed] [Google Scholar]