Figure 6.

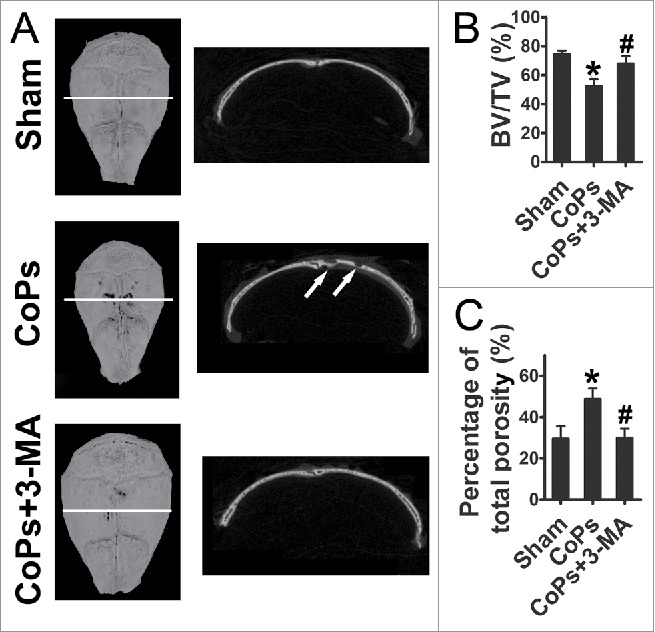
The autophagy inhibitor 3-MA ameliorates CoPs-induced mouse calvarial osteolysis assessed by micro-CT. (A) Representative images of micro-CT with 3-dimensional reconstructed images from each group (left). Cross-sectional views of the reconstructed images were indicated by the white horizontal line in the left panel, and the bone osteolysis sites are indicated by white arrows (right). (B) BV/TV and percentage of total porosity of each sample were measured. Values are expressed as means ± S.E.M. n = 7 mice per group. *, P < 0.05, vs. sham; #, P < 0.05 vs. CoPs group.
