Abstract
Purpose
Advances in two-photon (2P) deep tissue imaging provide powerful options for simultaneously viewing multiple fluorophores within tissues. We determined imaging parameters for optimally visualizing three fluorophores in the human trabecular meshwork (TM) to simultaneously detect broad-spectrum autofluorescence and multiple fluorophores through a limited number of emission filters.
Methods
2P imaging of viable human postmortem TM was conducted to detect Hoechst 33342–labeled nuclei, Alexa-568-conjugated phalloidin labeling of filamentous actin, and autofluorescence of the structural extracellular matrix (ECM). Emission detection through green (500–550 nm), near-red (565–605 nm), and far-red (590–680 nm) filters following 2P excitation at 750, 800, 850, and 900 nm was analyzed. Region-of-interest (ROI) image analysis provided fluorescence intensity values for each fluorophore.
Results
Red-channel Alexa 568 fluorescence was of highest intensity with 2P 750 nm and 800 nm excitation. Alexa 568 was imperceptible with 900 nm excitation. With excitation at 750 nm and 800 nm, Hoechst 33,342 intensity swamped autofluorescence in the green channel, and marked bleed-through into red channels was seen. 850 nm excitation yielded balanced Hoechst 33342 and autofluorescence intensities, minimized their bleed-through into the far-red channel, and produced reasonable Alexa 568 intensities in the far-red channel.
Conclusions
2P excitation at 850 nm and long-wavelength emission detection in the far-red channel allowed simultaneous visualization of the specific mix of endogenous and exogenous fluorophores with reasonably balanced intensities while minimizing bleed-through when imaging the human TM.
Introduction
We have applied two-photon (2P) excitation fluorescence (TPEF) and deep tissue optical sectioning to the human trabecular meshwork (TM) [1–5] to understand molecular mechanisms relevant to glaucoma. Simultaneously detecting multiple fluorophores in tissues provides important capacity for analyzing epitopes in situ, but the optimal parameters for achieving this in the human TM have not been determined.
With 2P imaging, two low-energy photons simultaneously interact to nonlinearly excite emission. 2P infrared-shifted imaging permits deeper tissue penetration, excitation of a broad range of fluorophores at a single wavelength, and use of lower energy levels with no or much less light damage to the tissue compared with one-photon (1P) imaging.
Parameters for simultaneously detecting endogenous and exogenous fluorophores in tissue are not easily predicted from standard 2P emission profiles. Tissues have significant autofluorescence (AF) with a broad emission spectrum that is expected to vary according to the tissue content and distribution of endogenous fluorophores. Even within a tissue, endogenous fluorescence itself may be heterogenous [2,5].
For each 2P tissue application, it must be determined whether the particular tissue’s endogenous signal is desirable or to be avoided. Tissue AF may interfere with the simultaneous identification of other fluorescent labels and is often considered a nuisance. In the TM, however, the structural extracellular matrix’s (ECM) AF signature is useful as it provides tissue localization clues and information on cell–ECM associations [2,3,5]. Thus, there are cases where AF is to be exploited and others in which it is to be mitigated during imaging. If AF is to be used, strategies are needed to ensure the endogenous signal does not interfere with the simultaneous identification of other fluorophores.
The aim of the present study was to determine appropriate parameters for simultaneously identifying three independent fluorophores during 2P imaging of the human TM. A typical TM application would be to localize a labeled epitope of interest with reference to cells and structural ECM in situ. This is possible with double labeling: For example, Alexa-568-conjugated antibody for the epitope of interest [1] and Hoechst 33342 for nuclear localization [2–4] combined with a third signal from tissue AF. We do not quench the AF but exploit it as a reference to localize labeled epitopes or cellular structures within the tissue [2,5].
The following basic considerations were used to optimize simultaneous detection of triple fluorescence from Hoechst 33342, Alexa-568, and AF in the human TM. The known range of optimal 2P excitation wavelengths for Hoechst 33342 is 700–820 nm and for Alexa-568 is 780–840 nm. The 2P emission spectrum maxima for Hoechst 33342 is at 440 nm but is at 25% of the maxima at 400 nm and 550 nm [6]. Thus, Hoechst 33342 is detectable through a green filter (500–550 nm) although bleed-through to the red spectrum (565–680 nm) may still occur. The 2P range of emission maxima for Alexa-568 is 596–603 nm, which is detectable through near-red (565–605 nm) and far-red (590–680 nm) filters. The TM AF emission spectrum is broad, detectable through blue and green filters, and may bleed through as far as the near-red range (565–605 nm). For this reason, we chose a far-red filter (590–680 nm) to segregate detection of Alexa-568 fluorescence from AF. A green filter (500–550 nm) allowed detection of AF and Hoechst 33342 fluorescence. Despite being spectrally similar when detected through the same filter, Hoechst 33342–labeled TM nuclei and the autofluorescent structural ECM are easily distinguished by their respective morphologies. Depending on 2P excitation wavelength, they may also have different fluorescence emission intensities. We empirically determined an optimal 2P excitation wavelength that would yield balanced emission intensities for the three fluorophores as detected through green and red emission filters.
Methods
Human donor corneoscleral rim tissue was generously provided by physicians of the Doheny Corneal Service with institutional review board approval, in compliance with the Declaration of Helsinki, and adherence to the ARVO statement on human subjects. Tissue was received immediately after cornea harvesting for transplantation, within 6 days postmortem as previously described [2] and maintained in Optisol GS transport media (Bausch & Lomb, Rochester, NY) at 4 °C. This tissue is typically discarded after transplant surgery but was salvaged and repurposed for research because it contains the intact TM. The work presented here is based on observations in tissues from 44 donors.
Tissue viability screening
Tissue was sectioned into wedges, and a sampling of wedges from each donor was colabeled with calcein AM (Life Technologies, Waltham, MA) and propidium iodide (PI; Life Technologies) to assess live cellularity and viability as previously described [4,7]. Wedges were incubated with 0.3 μl calcein AM and 1 μg/ml PI in Dulbecco’s PBS (1X; 137 mM NaCl, 2.7 mM KCl, 8.1 mM Na2HPO4, 1.5 mM KH2PO4, pH 7.4; Cat. No. 21–031, Corning Life Sciences, Tewksbury, MA) for 30 min at 37 °C and 8% CO2. TPEF optical sectioning through the TM was performed, and calcein-positive cells and PI-positive cells in z-stacks were counted. The percentage of calcein-positive cells relative to total cells (i.e., total cells=calcein-positive cells + PI-positive cells) was used to quantify live cellularity. Minimum live cellularity of 50% was needed to verify that a tissue was viable.
We previously found that two thirds of human corneoscleral donor tissues retrieved right after transplant surgery had a TM live cellularity rate of 70% or greater based on calcein AM positive labeling. By comparison, tissues not deemed viable, under 50% typically, had live cellularity rates of around 10% [7], confirmed with positive propidium iodide nuclear labeling in the non-viable cells. These “dead” cells remain in the trabecular meshwork; they do not float away. The same method we used previously was employed here [7].
Tissue fixation and staining
For labeling, tissue wedges were placed in 24-well plate wells, washed twice with 1 ml PBS, fixed for 30 min in 1 ml 4% paraformaldehyde, permeabilized for 2 h in 1 ml of 5% Triton X-100 in PBS rocking at 4 °C, and blocked in 1% BSA (BSA) for 30 min at room temperature. Wedges were placed in 96-well plate wells and incubated with 150 μl of Alexa Fluor©-568-conjugated phalloidin (Life Technologies) and Hoechst 33342 (Life Technologies) in 0.1% BSA/PBS overnight (16 h) at 4 °C on a rocking platform. They were transferred to fresh 24-well plates and washed five times with 1 ml PBS for 5 h at room temperature.
Imaging setup
Tissue wedges were imaged with a Leica TCS SP5 AOBS MP confocal microscope system (Leica Microsystems, Heidelberg, Germany) coupled to a Chameleon Ultra-II multiphoton laser (Coherent, Santa Clara, CA). The wedges were placed TM-side down on a glass-bottom microwell dish. Incident light was focused, and the emitted signals collected, with an inverted HCX PL APO CS 63X/1.3NA glycerol objective (Leica). The laser was centered at 750, 800, 850, or 900 nm to excite AF, indirect epifluorescence, and Hoechst 33342 fluorescence. TPEF signals were collected in epifluorescence configuration, split with a dichroic mirror, passed through multiphoton bandpass filters (green=525/50 nm (500–550 nm); near-red=585/40 nm (565–605 nm; Leica); or far-red=635/90 or 590–680 nm (Chroma, Bellows Falls, VT)) and guided onto a non-descanned photomultiplier tube detector (Hamamatsu, Bridgewater, NJ). 1P images were generated using 488 nm argon laser and a 543 nm helium neon laser excitation and tunable prism-based spectrophotometric detectors (SP mirrors) adjusted to emission windows of 500–535 nm for green fluorescence and 555–700 nm for red fluorescence. All images were captured at a resolution of 1024 × 1024 pixels and color depth of 16 bits. Images were captured at relative depths of 7–8 μm (from the surface of the uveal meshwork) unless otherwise specified.
The imaging was performed within a standard 2P setup that includes a dual-channel non-descanned photomultiplier tube (PMT) detector and two emission filters, a commonly used 2P setup. “Non-descanned” geometry refers to PMT positioning in the light path immediately after the objective. This improves detection sensitivity for deep tissue scanning. In contrast, less sensitive descanned detectors used with 1P imaging are separated from the objective with a series of dichroics, mirrors, filters, and a pinhole to collect a specific wavelength of in-focus photons.
Image analysis
Five regions of interest (ROIs) of equal size were placed in fixed positions across each analyzed image. The mean gray values in the ROIs were calculated in image analysis software (Leica LAS AF Lite). Average fluorescence intensities (0–65535) for pixels in the ROIs of the images captured through the red and green filters were recorded, representing red and green values, respectively. Yellow values were calculated as red-to-green ratios.
In a separate analysis, 12 small ROIs were used to isolate regions of ECM AF alone and Hoechst 33342 nuclei labeling alone (six ROI each). Mean gray values were calculated for each ROI (Leica LAS AF Lite). Average fluorescence intensity (0–65535) per pixel was reported for the nuclear ROI and the AF ROI. These mean gray values were used as a control to check that changes in the mean gray values in the red channels were not attributable to fluctuations in AF and/or Hoechst 33342 fluorescence intensities or their bleed-through into the red channels. The Hoechst 33342-to-ECM AF ratios for average fluorescence intensity per pixel values were calculated from these results.
Results
Comparison of 1P and 2P excitation
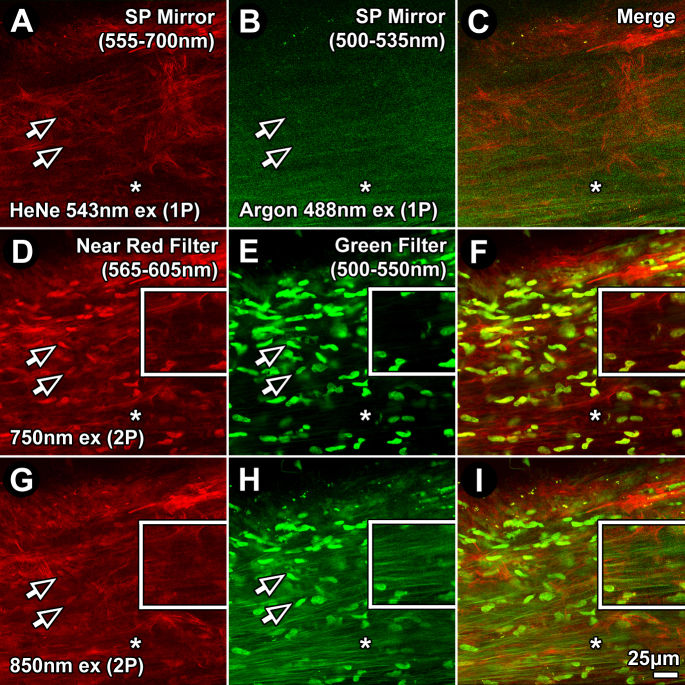
Differences between TM AF, Hoechst 33342, and Alexa-568 fluorescence due to 1P excitation as detected through red (555–700 nm) and green filters (500–535 nm), and 2P excitation through red (565–605 nm) and green (500–550 nm) filters were evident, as shown in Figure 1. One-photon excitation at 543 nm and 488 nm revealed Alexa 568 phalloidin fluorescence in the red channel (Figure 1A; 555–700 nm) and autofluorescent trabecular beams in the green channel (Figure 1B; 500–535 nm), respectively. Hoechst 33342–labeled nuclear fluorescence was not observed in the 1P green (500–535 nm) or red (555–700 nm) channels (Figure 1A-) as it requires a shorter wavelength emission filter to be seen. Hoechst 33342 nuclear labeling was detected in the 2P channels (arrows point to Hoechst 33342–labeled nuclei captured with 2P (Figure 1D,E,H), primarily in the green channel (500–550 nm), with some bleed-through into the near-red channel (565–605 nm), especially with 750 nm excitation.
Figure 1.
One-(1P) and two-photon (2P) imaging of Hoechst 33342, autofluorescence, and Alexa-568 in the human juxtacanalicular meshwork. 1P (A–C) and 2P (D–I) fluorescence excitation imaging, at varying excitation wavelengths, resulted in unique combinations of Hoechst 33342, autofluorescence (AF), and Alexa-568-conjugated phalloidin emission signals. Emission was captured through red (565–605 nm; A, D, G) and green (500–550 nm; B, E, H) filters. 1P excitation was at 543 nm for the red channel and 488 nm for the green channel. 2P excitation was at 750 nm (D–F) or 850 nm (G–I). Alexa-568-phalloidin fluorescence was similar in the red channel across all conditions. Hoechst 33342 nuclear fluorescence was visible in the green channel (500–550 nm) with 2P, but not 1P, excitation, in which it was brighter at shorter excitation wavelengths (E versus H). With 750 nm excitation (E), Hoechst 33342 was bright, but AF was almost imperceptible. With 850 nm excitation (H), AF and Hoechst 33342 intensities and visualization were more balanced. Arrows=Hoechst 33342–labeled nuclei. Asterisk=extracellular matrix-associated AF. SP mirror=tunable prism-based spectrophotometric detector. Bar=25 μm. Insets: 2X magnification of regions indicated by asterisks.
Autofluorescence intensity varies between tissues and with 2P excitation wavelength
AF intensity varied between tissues from different individuals, as shown in Figure 2A-D (four donors). Pixel fluorescence intensity in autofluorescent beams decreased with 2P excitation wavelength; at 750 nm excitation, mean intensity was 2495±1331 (mean ± standard deviation (SD); maximum range: 1–65355); at 800 nm, mean intensity was 2448±1200; at 850 nm, 986±456; and at 900 nm, 337±232.
Figure 2.
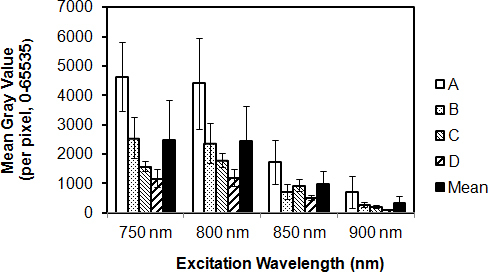
Autofluorescence intensity in the human trabecular meshwork. Extracellular matrix (ECM)-derived autofluorescence (AF) intensity (mean gray value) was determined for tissues from 4 human donors (A, B, C, and D). Each column represents mean pixel intensity for a donor human trabecular meshwork (TM) excited at a particular two-photon (2P) wavelength. Mean intensity of four donor tissues for each excitation wavelength is shown as an adjacent black column. Error bars=standard deviation.
2P-excited Hoechst 33342 nuclear fluorescence
Hoechst fluorescence intensity in the green channel (500–550 nm) was highest with 2P excitation at 750 nm, but emission intensity diminished with longer excitation wavelengths (compare Figure 1E,H; shown for 850 nm excitation). Relative intensity of Hoechst 33342 fluorescence diminished with increasing excitation wavelength (compare Figure 3A,C,B,D, blue ROIs; Figure 4, white bars), becoming virtually imperceptible with 900 nm excitation (see Figure 3E,F, blue ROIs).
Figure 3.
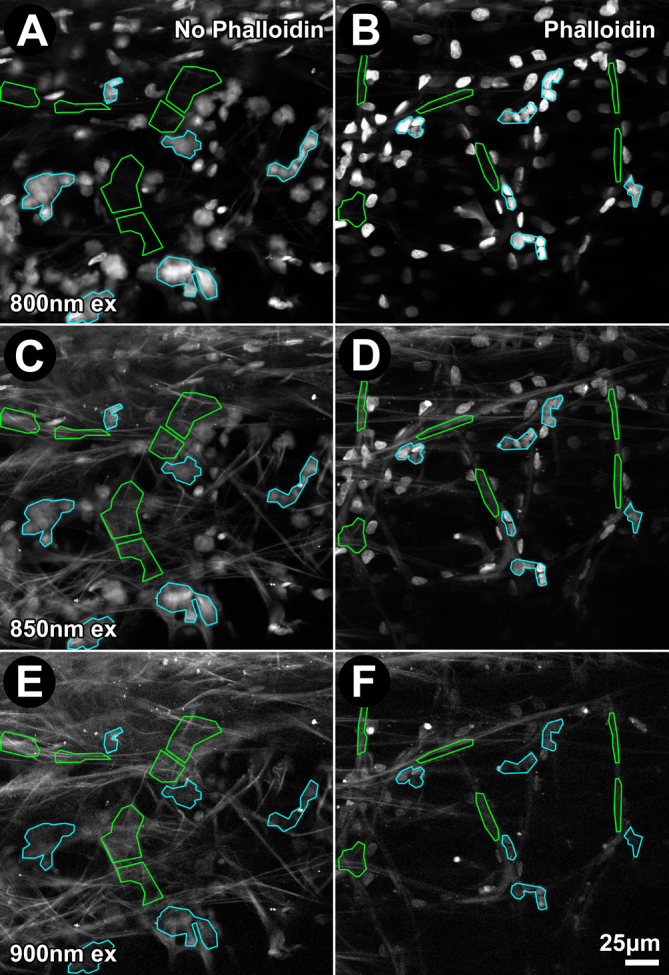
Increasing two-photon (2P) excitation wavelength decreased Hoechst 33342 nuclear fluorescence intensity and increased autofluorescence (AF) intensity. Two tissue sections from the same donor were fixed and incubated without (A, C, E) or with Alexa-568-conjugated phalloidin (B, D, F) and imaged. Emission from the uveal meshwork following 2P excitation at 800 nm (A, B), 850 nm (C, D), and 900 nm (E, F) was captured through a green filter (500–550 nm). Region-of-interest (ROI) analysis of AF (green) and Hoechst 33342 nuclear fluorescence (blue) are illustrated. Bar=25 μm.
Figure 4.
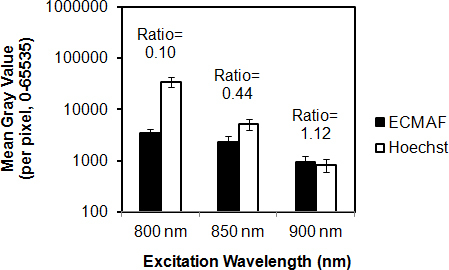
Effect of excitation wavelength on relative Hoechst 33342 fluorescence and autofluorescence intensities. Autofluorescence (AF) from the extracellular matrix (black columns) and Hoechst 33342 nuclear fluorescence (white columns) were collected in the green channel (500–550 nm) with varying two-photon (2P) excitation wavelengths. Fluorescence intensities (mean gray value) were measured within regions-of-interest illustrated in Figure 3. AF-to-Hoechst 33342 ratios increased sharply with increasing excitation wavelength (800 nm to 900 nm). The y-axis (mean gray value of fluorescence intensity) is set to a logarithmic (base 10) scale. Error bars=standard deviation.
Bleed-through of Hoechst 33342 fluorescence into the near red channel (565–605 nm) was analyzed at excitation wavelengths of 750, 800, 850, and 900 nm in the fixed tissues, as shown in Figure 5. ECM AF bleed-through intensity sharply decreased with longer wavelengths. Hoechst 33342 colabeling did not significantly alter the ECM AF bleed-through. Hoechst 33342–labeled nuclear bleed-through was an order of magnitude higher than ECM AF bleed-through across all excitation wavelengths. The Hoechst 33342 bleed-through intensity decreased with 2P excitation wavelength; 2354±1577 (mean ± SD) at 750 nm; 594±520 at 800 nm; 26±37 at 850 nm; and 9±13 at 900 nm excitation.
Figure 5.
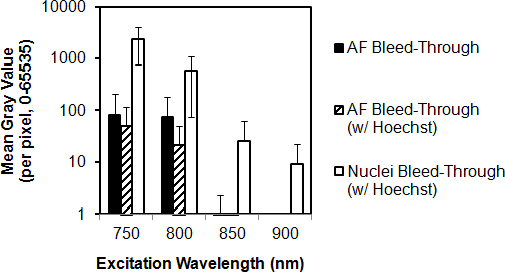
Effect of excitation wavelength on Hoechst 33342 and autofluorescence bleed-through. Bleed-through of fluorescence (AF) associated with Hoechst 33342-stained nuclei (nuclei bleed-through) and of AF from extracellular matrix (AF bleed-through) was collected through a near red filter channel (565–605 nm) at different 2-photon (2P) excitation wavelengths. Black columns: AF bleed-through intensity from fixed trabecular meshwork (TM). Hatched columns: AF bleed-through intensity from fixed TM colabeled with Hoechst 33342. White columns: Nuclear bleed-through. Nuclear bleed-through was an order higher than AF bleed-through. y-axis (mean gray value of fluorescence intensity) is set to a logarithmic (base 10) scale. Error bars=standard deviation.
2P-excited autofluorescence
ECM AF intensity modestly decreased with longer 2P excitation wavelengths (Figure 4, black bars), the corresponding Hoechst 33342 intensity decrease was more dramatic (white bars). Thus, Hoechst 33342 and AF viewed together, ECM AF was less apparent with shorter 2P excitation wavelengths (especially 800 nm; Figure 3A,C,E) as overall image brightness had to be reduced to accommodate the overwhelmingly intense Hoechst 33342 signal (see Figure 4 for 800 nm excitation).
Balancing 2P excited autofluorescence and Hoechst 33342 fluorescence
Two-photon-excited Hoechst 33342 and AF emission overlapped over a broad spectrum (Figure 1E,H). Both were seen not only in the green channel (500–550 nm) but also as bleed-through into the red channel (Figure 1D), especially with 750 nm excitation. Higher Hoechst 33342 fluorescence intensity with 750 nm or 800 nm excitation was associated with virtually imperceptible AF (Figure 1E, asterisk; Figure 3A), corresponding to a Hoechst:AF intensity ratio of at least 10:1. With 850 nm excitation, however, autofluorescence and Hoechst 33342 fluorescence were easily seen together (Figure 1H, asterisk; green channel), with the fluorophores emitting at more balanced intensities (Hoechst:AF ratio about 2:1; Figure 4). At 900 nm excitation, although the Hoechst:AF ratio was nearly 1:1, labeled nuclei were barely perceptible.
Alexa 568 phalloidin fluorescence following 2P excitation
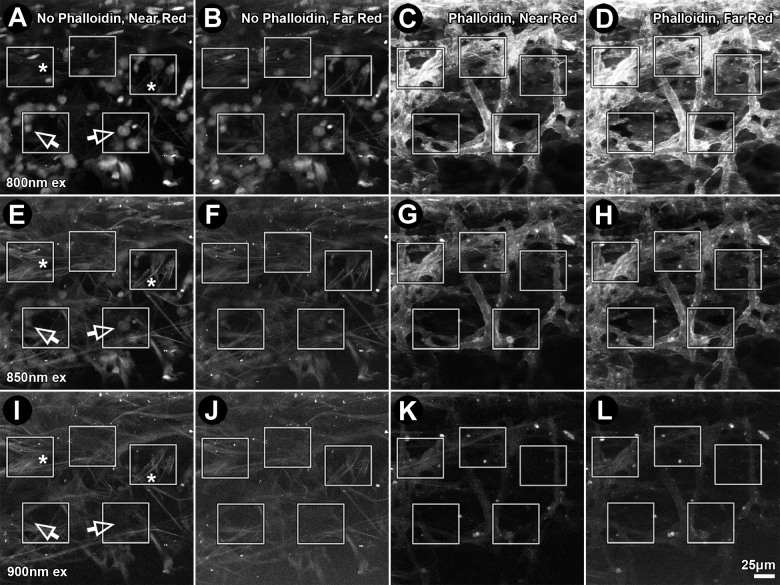
Fluorescence intensity of Alexa-568-phalloidin (for F-actin) diminished with increasing 2P excitation wavelength from 800 nm to 850 nm to 900 nm. Alexa-568 pixel intensity was 18,348 for 800 nm (Figure 6C), 4,064 for 850 nm (Figure 6G), and 871 for 900 nm excitation (Figure 6K). Pixel intensity of Alexa-568 emission through near-red (565–605 nm) and far-red filters (590–680 nm) decreased with increasing 2P excitation wavelength, as did AF intensity, as shown in Figure 7. At 850 nm excitation, Alexa-568 emission intensity through the far-red filter was more than 200% that of Alexa-568 emission detected through the near-red filter or AF detected through the near-red or far-red filter.
Figure 6.
Effect of emission filter bandwidth on fluorescence intensities of Alexa-568, autofluorescence (AF), and Hoechst 33342 after two-photon (2P) excitation. Fluorescence from Alexa-568-phalloidin (red), Hoechst 33342 (green; 500–550 nm) and AF was collected from the uveal meshwork through near-red (565–605 nm; A, C, E, G, I, K) and far-red (590–680 nm; B, D, F, H, J, L) emission filters following 2P excitation at 800 nm (800 nm ex), 850 nm (850 nm ex), or 900 nm (900 nm ex). Boxes: region-of-interest (ROI) analysis of fluorescence intensity (red, green, or red/green ratio (yellow values)). Tissues were without (A, B, E, F, I, J) or with Alexa-568-phalloidin (C, D, G, H, K, L) label. Arrows: Hoechst 33342–labeled nuclei. Bar=25 μm.
Figure 7.
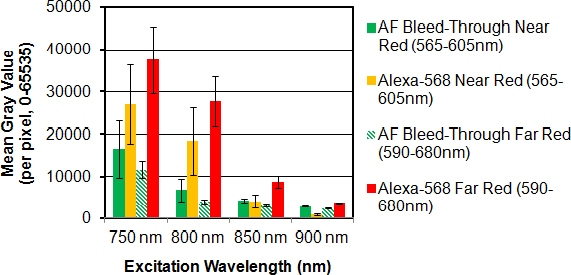
Effect of red filter bandpass on two-photon (2P) red-to-green fluorescence intensity ratios representing the signal-to-noise ratio in the red channel. Pixel intensity (mean gray value) was calculated in five regions of interest (ROIs) positioned in each image frame (see Figure 6). In the absence of Alexa-568 (-Red Dye), red channel fluorescence was attributed to broad spectrum Hoechst 33342 and autofluorescence (AF) bleed-through. Alexa-568-to-AF bleed-through mean gray value ratios decreased with increasing excitation wavelength (800 to 900 nm) and were highest through a far-red filter (590–680 nm). For the ratio values, see Table 1.
Effect of 2P excitation and filter wavelength on fluorophore bleed-through
Hoechst 33342 and AF bleed-through contributed to some of the fluorescence detected in the red channel (565–680 nm), as shown in Figure 1D (arrows). Figure 6A,B,E,F,I,J depict Hoechst 33342 and AF bleed-through into the red channels (near-red: 565–605 nm; far-red: 590–680 nm). Hoechst 33342 bleed-through was highest for shorter excitation wavelengths (800 nm; Figure 6A, arrows) and virtually absent for longer wavelengths (900 nm; Figure 6I, arrows). AF bleed-through into the near-red channel (565–605 nm) was more at higher excitation wavelengths (compare 800 nm with 850 nm and 900 nm; Figure 6A,E,I; asterisks). Total Hoechst 33342 fluorescence and AF bleed-through into the red channel was less with a far-red filter (590–680 nm) than with a near-red filter (565–605 nm): by 41% for 800 nm excitation, 28% for 850 nm excitation, and 17% for 900 nm excitation (compare Figure 6A,E,I to Figure 6B,F,J; also Figure 7, green bars).
The extent to which Hoechst 33342 and AF bleed-through affected interpretation of the Alexa-568 signal depended on 2P excitation wavelength and choice of near-red (565–605 nm) or far-red filter (590–680 nm), as shown in Table 1 and Figure 6. Alexa-568-phalloidin signal-to-noise ratios (i.e., representing Alexa-568 signal above AF bleed-through in the red channel) were higher in the far-red channel (590–680 nm) than in the near-red channel (565–605 nm) by 144% for 800 nm excitation, 180% for 850 nm excitation, and 284% for 900 nm excitation (Figure 6C,D,G,H,K,L; Figure 7; and Table 1).
Table 1. Effect of red filter bandpass on signal-to-noise ratio.
|
Emission Filter Wavelength Range (nm) |
Near Red: 565–605 |
Far Red: 590–680 |
|||||
|---|---|---|---|---|---|---|---|
| Excitation Wavelength (nm) | 800 | 850 | 900 | 800 | 850 | 900 | |
|
-Red Dye |
AF Bleed-Through |
6774 |
4290 |
2904 |
3972 |
3096 |
2398 |
|
+Red Dye |
Alexa-568 in Red Channel |
18,348 |
4064 |
871 |
27,776 |
8736 |
3626 |
| Ratio of Alexa-568-to- AF Bleed-Through | 2.71 | 0.95 | 0.30 | 6.99 | 2.82 | 1.51 | |
Pixel intensity was calculated in five regions of interest (ROI) positioned in each image frame (see Figure 6). In the absence of Alexa-568 (-Red Dye), fluorescence in the near-red (565–605 nm) and far-red (590–680 nm) channels was attributed to Hoechst and autofluorescence (AF) bleed-through (AF Bleed-Through) and considered background signal or “noise.” In the presence of Alexa-568 dye (+Red Dye); intensity measurements in the same ROIs represented a mix of Alexa-568 signal and background noise. The signal-to-noise ratio (Ratio of Alexa-568-to-AF Bleed Through) decreased with increasing excitation wavelength (from 800 to 900 nm) and use of a far-red filter (590–680 nm).
Optimizing 2P-excited multiple fluorophore detection and minimizing bleed-through
Overall, human TM 2P excitation at 850 nm provided well balanced and reasonably bright Hoechst 33342–labeled nuclear fluorescence and AF (Figure 4) in the same green channel (500–550 nm) with no measureable Alexa-568 bleed-through. With 2P 850 nm excitation, Alexa-568-phalloidin fluorescence had a favorable balance of brightness and signal-to-noise ratio through a far-red filter (590–680 nm). Hoechst 33342 and AF bleed-through from the green channel (500–550 nm) into the far-red channel (590–680 nm) was minimal (Table 1).
Discussion
We have sought to optimize 2P excitation of endogenous and exogenous fluorophores in the human TM to simultaneously visualize multiple fluorophores through two emission filters. Hoechst 33342 and Alexa-568-phalloidin were exogenous fluorophores while AF originated from ECM endogenous fluorophores with broad-spectrum emissions. Ideally, we wanted: (a) minimal Hoechst 33342 and AF bleed-through into the red channel, in which Alexa-568-phalloidin–associated fluorescence was viewed; (b) a high Alexa-568-phalloidin signal-to-noise ratio (bleed-through/background fluorescence) in the red channel; (c) reasonably matched Hoechst 33342 and AF intensities in the green channel (500–550 nm), allowing both signals to be seen and clearly distinguished in the same pass simultaneously; and (d) minimal or no Alexa-568 bleed-through into the green channel.
2P excitation at 850 nm, short-wavelength emission detection in a green channel (500–550 nm) and long-wavelength emission detection in a far-red channel (590–680 nm) met our criteria. We used these parameters to visualize three fluorophores—Hoechst 33342 (nuclei), AF (structural ECM), and Alexa-568-phalloidin (F-actin) —allowing simultaneous visualization of a specific mix of endogenous and exogenous fluorophores in the human TM with reasonably balanced intensities and minimal bleed-through based on the following observations:
1) 850 nm 2P-excited Alexa-568-phalloidin fluorescence intensity was relatively high, but with scant bleed-through into the green channel (500-550 nm; Figure 1). Although shorter 2P excitation wavelengths (e.g., 750 nm and 800 nm) yielded even higher Alexa-568-phalloidin fluorescence intensities, Alexa-568 bleed-through into the green channel (500–550 nm) was pronounced.
2) Bleed-through from Hoechst 33342 and AF into the red channel diminished with longer excitation wavelengths, with bleed-through least for 900 nm and most for 800 nm excitation. Alexa-568-phalloidin fluorescence was barely seen with 900 nm 2P excitation in the red channel, but it was relatively strong at 850 nm. Thus 850 nm 2P excitation yielded an optimal Alexa-568-phalloidin fluorescence signal-to-noise ratio, with minimal Hoechst 33342 and AF bleed-through into the red channel.
3) With 850 nm excitation, the Hoechst 33342 nuclear fluorescence and AF intensities were closely matched, with balanced intensities, and structures easily distinguished in the green channel (500–550 nm) in the same pass. At lower wavelength excitation (e.g., 800 nm), Hoechst 33342 nuclear fluorescence intensity was high, requiring overall image intensity reduction to a level that rendered the dimmer AF signal imperceptible.
4) Total Hoechst 33342 and AF bleed-through into the red channel was reduced with a far-red filter (590–680 nm) compared with a near-red filter (565–605 nm). Because of the possibility that paraformaldehyde fixation may itself induce some AF, all of the AF intensity analysis comparisons were performed under similar conditions, and never between fixed and unfixed tissue.
The basic considerations outlined here are worth keeping in mind when simultaneously imaging multiple fluorophore combinations in the human TM during tissue-based TPEF imaging. Depending on the imaging application, these considerations provide options to either use or negate the tissue AF signal. We have adapted these principles for simultaneously visualizing multiple intravital dyes of Hoechst 33342 (2P emission peak of 478 nm), calcein AM (1P emission peak of 517 nm; green) and propidium iodide (1P emission peak of 617 nm; far-red) in the TM [2–4,7]. If a 2P setup with three or more emission filters is available, our described filter arrangement and 850 nm can still be used. But we would suggest adding a narrow-band filter designed to collect photons at a full-width half maximum wavelength of 425 nm [5], exactly half that of the 850 nm excitation wavelength proposed here. This permits detection of second harmonic generation (SHG) from structural collagen (between 365 and 440 nm) [8]. Detection of collagen SHG (at 425 nm) is not subject to AF bleed-through [5]. A similar setup was recently reported for 2P imaging of corneoscleral limbal structures using SHG, 4',6-diamidino-2-phenylindole (DAPI) labeling, and 850 nm excitation [9].
Acknowldegments
National Institutes of Health, Bethesda, MD K08EY020863 (JCHT); P30EY03040 (Doheny Vision Research Institute Imaging Core); 1S10RR024754 (USC Multiphoton Core); Kirchgessner Foundation Research Grant (JCHT); American Glaucoma Society Mentoring for Physician Scientists Award and Young Clinician Scientist Award; Career Development Award from Research to Prevent Blindness (JCHT); and an unrestricted grant (UCLA Department of Ophthalmology) from the Research to Prevent Blindness, Inc.
References
- 1.Gonzalez JM, Jr, Hsu HY, Tan JC. Observing live actin in the human trabecular meshwork. Clin Experiment Ophthalmol. 2014;42:502–4. doi: 10.1111/ceo.12255. [DOI] [PMC free article] [PubMed] [Google Scholar]
- 2.Tan JC, Gonzalez JM, Jr, Hamm-Alvarez S, Song J. In situ autofluorescence visualization of human trabecular meshwork structure. Invest Ophthalmol Vis Sci. 2012;53:2080–8. doi: 10.1167/iovs.11-8141. [DOI] [PMC free article] [PubMed] [Google Scholar]
- 3.Gonzalez JM, Jr, Heur M, Tan JC. Two-photon immunofluorescence characterization of the trabecular meshwork in situ. Invest Ophthalmol Vis Sci. 2012;53:3395–404. doi: 10.1167/iovs.11-8570. [DOI] [PMC free article] [PubMed] [Google Scholar]
- 4.Gonzalez JM, Jr, Hamm-Alvarez S, Tan JC. Analyzing live cellularity in the human trabecular meshwork. Invest Ophthalmol Vis Sci. 2013;54:1039–47. doi: 10.1167/iovs.12-10479. [DOI] [PMC free article] [PubMed] [Google Scholar]
- 5.Huang AS, Gonzalez JM, Jr, Le PV, Heur M, Tan JC. Sources of structural autofluorescence in the human trabecular meshwork. Invest Ophthalmol Vis Sci. 2013;54:4813–20. doi: 10.1167/iovs.12-11235. [DOI] [PMC free article] [PubMed] [Google Scholar]
- 6.Gryczynski I, Malak H, Lakowicz JR. Multiphoton excitation of the DNA stains DAPI and Hoechst. Bioimaging. 1996;4:138–48. [Google Scholar]
- 7.Gonzalez JM, Jr, Tan JCH. Semi-automated vitality analysis of human trabecular meshwork. Intravital. 2014;2:e27390. [Google Scholar]
- 8.Zoumi A, Yeh A, Tromberg BJ. Imaging cells and extracellular matrix in vivo by using second-harmonic generation and two-photon excited fluorescence. Proc Natl Acad Sci USA. 2002;99:11014–9. doi: 10.1073/pnas.172368799. [DOI] [PMC free article] [PubMed] [Google Scholar]
- 9.Park CY, Lee JK, Zhang C, Chuck RS. New details of the human corneal limbus revealed with second harmonic generation imaging. Invest Ophthalmol Vis Sci. 2015;56:6058–66. doi: 10.1167/iovs.15-16783. [DOI] [PMC free article] [PubMed] [Google Scholar]


