

Abstract
Study Objectives:
To determine the association between self-reported sleep duration and cortical thinning among older adults.
Methods:
We studied 122 cognitively normal participants in the Baltimore Longitudinal Study of Aging with a mean age = 66.6 y (range, 51–84) at baseline sleep assessment and 69.5 y (range, 56–86) at initial magnetic resonance imaging (MRI) scan. Participants reported average sleep duration and completed a mean of 7.6 1.5-T MRI scans (range, 3–11), with mean follow-up from initial scan of 8.0 y (range, 2.0–11.8).
Results:
In analyses adjusted for age, sex, education, race, and interval between sleep assessment and initial MRI scan, participants reporting > 7 h sleep at baseline had thinner cortex in the inferior occipital gyrus and sulcus of the left hemisphere at initial MRI scan than those reporting 7 h (cluster P < 0.05).
In adjusted longitudinal analyses, compared to those reporting 7 h of sleep, participants reporting < 7 h exhibited higher rates of subsequent thinning in the superior temporal sulcus and gyrus, inferior and middle frontal gyrus, and superior frontal sulcus of the left hemisphere, and in the superior frontal gyrus of the right hemisphere; those reporting > 7 h of sleep had higher rates of thinning in the superior frontal and middle frontal gyrus of the left hemisphere (cluster P < 0.05 for all). In sensitivity analyses, adjustment for apolipoprotein E (APOE) e4 genotype reduced or eliminated some effects but revealed others. When reports of < 7 h of sleep were compared to reports of 7 or 8 h combined, there were no significant associations with cortical thinning.
Conclusions:
Among cognitively normal older adults, sleep durations of < 7 h and > 7 h may increase the rate of subsequent frontotemporal gray matter atrophy. Additional studies, including those that use objective sleep measures and investigate mechanisms linking sleep duration to gray matter loss, are needed.
Citation:
Spira AP, Gonzalez CE, Venkatraman VK, Wu MN, Pacheco J, Simonsick EM, Ferrucci L, Resnick SM. Sleep duration and subsequent cortical thinning in cognitively normal older adults. SLEEP 2016;39(5):1121–1128.
Keywords: aging, atrophy, cortical thinning, gray matter, neuroimaging, sleep duration
Significance.
Prior studies have identified associations between sleep duration and cognitive performance, but little is known about the association of sleep duration with subsequent neurodegeneration. We examined the prospective association of sleep duration with gray matter atrophy among older adults who reported their average sleep duration and then completed a series of MRI scans of the brain. Our results indicate that older adults reporting < 7 h or > 7 h sleep have more rapid cortical thinning in particular brain regions over time, compared to those reporting 7 h of sleep. These data are among the first to link sleep duration prospectively to a pattern of gray matter atrophy, and suggest the possibility that sleep duration alters rates of neuronal loss.
INTRODUCTION
Over the past decade, findings from numerous studies suggest that sleep is important for maintaining brain health. Studies of older adults document associations between indices of disturbed sleep and lower cognitive performance or cognitive decline, and recent studies link poor sleep in later life to Alzheimer disease (AD) biomarkers.1,2 Sleep duration is one of many dimensions of sleep that have been examined in relation to cognitive outcomes. In prior studies, lower cognitive function has been observed in those reporting either short sleep3,4 or long sleep,5–7 compared to intermediate sleep duration. Other studies have found that, among older adults, both short and long sleepers have lower performance than those reporting intermediate sleep duration.8,9
Other studies have investigated associations between sleep and neurodegeneration by examining the association between sleep-related variables and magnetic resonance imaging (MRI) measures of brain volume and patterns of atrophy in humans. However, most of these studies have compared imaging results of individuals with clinical insomnia from younger or mixed-age samples and have been cross sectional.10–16 We are aware of only two longitudinal studies in this domain. One found that older adults reporting shorter baseline sleep duration had greater atrophy over a 2-y period, measured by expansion of the ventricles.16 The second found no association between baseline sleep duration and 3.5-y change in cortical volume in a sample ranging in age from 20 to 84 y.17 Here, we investigated the prospective association between self-reported sleep duration and gray-matter atrophy, measured by cortical thinning over an average of 8 y in cognitively normal community-dwelling older adults.
METHODS
Participants
Participants were individuals enrolled in the Baltimore Longitudinal Study of Aging Neuroimaging Study (BLSA-NI),18 which consists of a subset of participants in the larger BLSA.19 To participate in the BLSA, at the time of initial enrollment, prospective participants must be free of cognitive impairment, functional limitations, major diseases (except controlled hyper-tension), and of any medical conditions that limit functioning or life expectancy, or that necessitate ongoing treatment with antibiotics, chronic pain medications, corticosteroids, histamine2 blockers, or immunosuppressants. Participants in this study attended routine BLSA study visits every 2 y.
BLSA participants could enroll in the BLSA-NI if they had no neurological disease, serious cardiovascular or pulmonary disease, or metastatic cancer. MRI studies in the BLSA-NI began February 10, 1994 and are ongoing, although the current analyses are limited to MRI scans acquired on GE 1.5 Signa scanners (General Electric, Milwaukee, WI; see next paragraphs). BLSA-NI participant visits took place annually; some were concurrent with routine BLSA visits, and others occurred at special 1-day visits between routine visits. Of 158 participants enrolled in the BLSA-NI in 1994, 132 had at least three MRI visits. Of these, 123 had normal cognitive status at the time of their initial neuroimaging scan, and if they subsequently progressed to mild cognitive impairment or dementia, we only included scans acquired prior to onset of cognitive impairment. One participant was excluded for a potentially confounding health condition, yielding a final sample of 122 participants.
MRI Acquisition and Processing
Participants completed MRI scans on a 1.5-T scanner with a spoiled gradient-recalled acquisition sequence (repetition time [TR], 35 msec; echo time [TE], 5 msec; flip angle 45°; image matrix, 256 × 256; 124 sections; voxel size, 0.94 × 0.94 × 1.5 mm). We used the Freesurfer image analysis suite (v. 5.1; http://surfer.nmr.mgh.harvard.edu/) for cortical reconstruction and volumetric segmentation; these methods have been described in detail previously.20 Briefly, a hybrid watershed/surface deformation procedure was applied to volumetric T1-weighted images to remove non-brain tissue,21 automated Talairach transformation was performed and deep gray matter volumetric structures and subcortical white matter were segmented.22,23 Images were intensity normalized,24 the gray matter-white matter boundary was tessellated, and an automated topology correction was applied.25,26 Finally, a surface-deformation procedure used intensity gradients to estimate the borders between gray and white matter and between gray matter and cerebrospinal fluid; the points at which the greatest transition in intensity occurred were used to identify these boundaries.27–29 Cortical thickness was calculated as the distance between the boundary of the gray and white matter and the boundary between the gray matter and cerebrospinal fluid along each vertex of the surface. All subjects were processed using the Freesurfer longitudinal processing pipeline, which initialized each timepoint with a subject-specific template in order to improve segmentation and surface reconstruction.30 The resulting images were smoothed with a 10 mm full-width at half maximum kernel.
Baseline Sleep Duration
From the inception of the BLSA-NI, participants were asked to report at their regular BLSA visits how many hours of sleep they obtained on average over the past month. Responses could range from 1 to 12 h, but participants in the current analysis reported a range of 5 to 9 h. In all cases, sleep duration data, which we label “baseline sleep duration,” were collected at a visit prior to the initial MRI scan, with a mean interval between sleep assessment and scanning of 2.9 ± 1.0 y (range, 1 to 7).
Other Measures
On enrollment in BLSA, participants reported demographic information. In conjunction with either the BLSA-NI visit or a routine BLSA visit, they underwent neuropsychological testing. Performance on cognitive tests was reviewed at a consensus conference for participants screening positive on the Blessed Information Memory Concentration Test31 (score ≥ 4), if they had a Clinical Dementia Rating32 score ≥ 0.5 according to participant or informant report, or if concerns about their cognitive status were expressed. All BLSA participants were evaluated in a case conference on death or termination of participation. Mild cognitive impairment was diagnosed based on the Petersen criteria33 when participants had impairment in one cognitive domain (usually memory) or in multiple cognitive domains, in the absence of substantial functional impairment. Dementia was diagnosed according to Diagnostic and Statistical Manual of Mental Disorders (Third Edition-Revised) criteria34 and AD diagnoses were based on the National Institute of Neurological and Communication Disorders—Alzheimer's Disease and Related Disorders Association criteria.35 Participants without diagnoses indicating cognitive impairment were deemed to be cognitively normal. At routine BLSA visits, a nurse practitioner evaluated participants regarding diagnoses and signs and symptoms of medical conditions, and reviewed their medical records. Blood pressure was measured by sphygmomanometer and height and weight were measured, enabling calculation of body mass index (kg/m2). Blood was drawn and apolipoprotein E (APOE) e4 genotype ascertained (i.e., e4 carrier or noncarrier), given the link between the e4 allele and AD risk.36
Statistical Analyses
To examine the association between baseline sleep duration and both cortical thickness at initial MRI scan and prospective change in cortical thickness, we applied spatiotemporal linear mixed effects models across the entire cortical surface.37,38 Based on the distribution of participant responses (Table 1), we categorized participants as sleeping for < 7 h, 7 h, or > 7 h. Seven hours was the reference category, to capture potential U-shaped associations between sleep duration and cortical thinning, except when comparing shortest vs. longest sleep duration categories, when < 7 h served as the reference. The mixed-effects model applied to each vertex included age at initial MRI, sex, education, race, sleep duration category, the interval between sleep assessment and initial MRI scan, and time as fixed effects. Time was coded as years since initial MRI to compare differences in initial levels of cortical thickness across sleep duration categories. We also included interactions of each of these with time, with the exception of the baseline sleep to initial MRI scan interval. Sleep duration category and its interaction with time was the primary predictor. Participant-specific intercepts and slopes were included as random effects and the outcome was cortical thickness at each time point. Vertex-wise analyses were implemented in MATLAB 2013a (MathWorks, Natick, MA). To limit type 1 error resulting from multiple comparisons, we required a vertex-level P < 0.01 for statistical significance in neuroimaging analyses, and after applying this threshold, we only interpreted results from regions with a cluster P < 0.05. We also extracted mean cortical thickness from select significant clusters in order to characterize the rates of cortical thinning for each sleep duration category. Predicted values were estimated from the previously specified mixed effects model for each region of interest selected and are shown in Table S1 and Figure S1 in the supplemental material. Differences in participant characteristics between sleep duration groups were tested with analysis of variance for continuous variables and Fisher exact test for categorical variables in RStudio version 0.98.1091 (RStudio, Inc., Boston, MA).
Table 1.
Distribution of self-reported sleep duration (n = 122).

As the APOE e4 genotype increases the risk of AD36 and may affect brain atrophy, we performed sensitivity analyses adding APOE e4 status and the interaction between APOE e4 status and time to the model, to determine whether the association between sleep duration and atrophy is independent of the e4 allele.
In light of the recent publication of sleep duration recommendations from the National Sleep Foundation (NSF) for adults aged 65 y and older,39 we performed additional sensitivity analyses comparing cortical thinning among participants reporting < 7 h of sleep to that of those reporting 7 or 8 h (combined in one reference category). Although a joint American Academy of Sleep Medicine (AASM) and Sleep Research Society (SRS) taskforce recently published guidelines for those aged 18 to 60 y,40 we used the NSF recommendations because most participants (77%) were older than 60 y. Because only seven participants reported > 8 h of sleep, we did not compare thinning between those reporting > 8 h and those reporting 7 or 8 h.
RESULTS
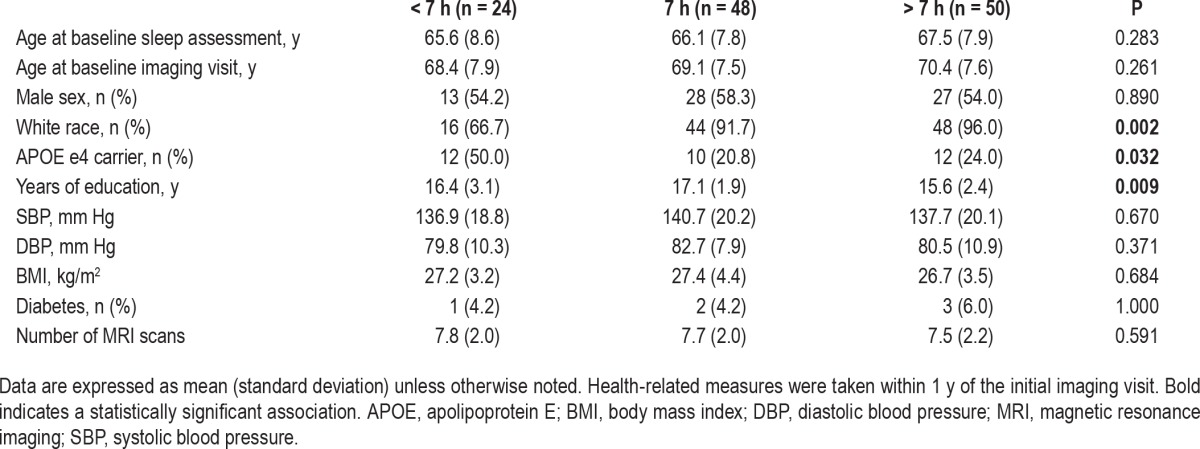
The 122 participants had a mean (standard deviation) age of 66.6 (8.0) y (range 51–84) at time of sleep assessment (i.e., our baseline), which occurred between March 1991 and December 1996, and were aged 69.5 (7.6) y (range 56–86) at initial MRI. Overall, 54 (44.3%) were women and 108 (88.5%) were white. They completed an average of 7.6 (2.1) scans (range 3–11) over 8.0 (2.4) y (range 2–11.8). Overall, 24 (19.7%) reported < 7 h sleep duration, 48 (39.3%) reported 7 h, and 50 (41.0%) reported > 7 h (Table 1).
Across sleep duration categories, participants differed by race, education, and APOE e4 status (Table 2). When we examined the association between sleep duration and cortical thickness on initial MRI scans, compared to participants reporting 7 h of sleep, those reporting > 7 h had thinner cortex in the inferior occipital gyrus and sulcus of the left hemisphere (surface area = 279.70 mm2, peak F-statistic = −13.52, cluster P < 0.05). This association remained in a sensitivity analysis that further adjusted for APOE e4 status (surface area = 288.98 mm2, peak F-statistic = −13.70, cluster P < 0.05). There were no other associations between sleep duration and initial cortical thickness in our primary vertex-wise analyses.
Table 2.
Participant characteristics at baseline by sleep duration (n = 122).
In longitudinal results, compared to those reporting 7 h of sleep, those reporting < 7 h had higher rates of cortical thinning in the superior temporal sulcus, superior temporal gyrus, inferior frontal gyrus, middle frontal gyrus, and superior frontal sulcus of the left hemisphere, and in the superior frontal gyrus of the right hemisphere (Table 3 and Figure 1; cluster P < 0.05 for all). In addition, compared to those reporting 7 h of sleep, those reporting > 7 h had higher rates of thinning in the superior frontal and middle frontal gyrus of the left hemisphere (cluster P < 0.05 for both). Rates of cortical thinning did not differ between those in the shortest and the longest sleep duration categories. Average rates of cortical thinning and trajectories of thinning in select regions are displayed by sleep duration in Table S1 and Figure S1 in the supplemental material. Of note, there was no association between sleep duration and thinning in the inferior occipital gyrus and sulcus of the left hemisphere in longitudinal analyses, despite associations between sleep duration and cortical thickness in these regions on initial MRI scans.
Table 3.
Association of sleep duration with subsequent rates of cortical thinning (n = 122).
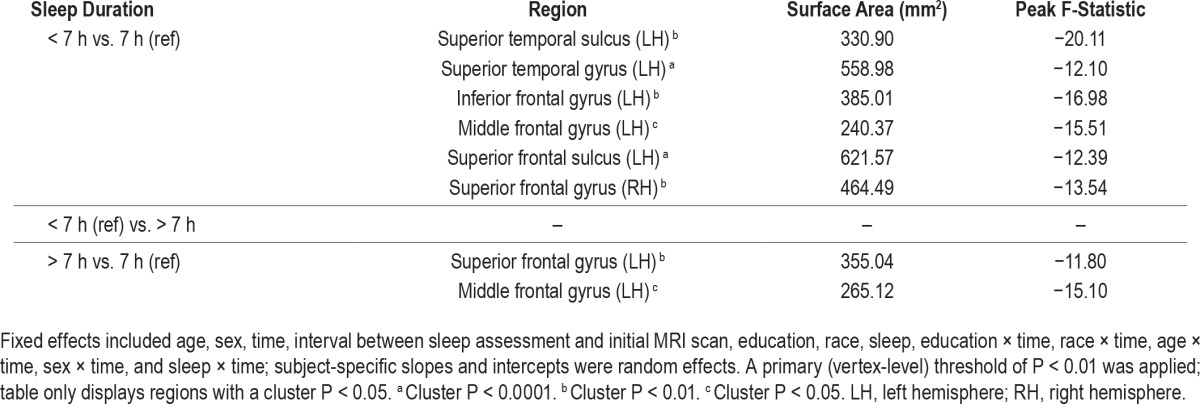
Figure 1.

Prospective association of sleep duration with subsequent cortical thinning in cognitively normal older adults. Longitudinal magnetic resonance images (MRIs) from 122 cognitively normal participants indicate faster rates of cortical thinning in frontal and temporal regions among those reporting < 7 h average sleep duration (n = 24) and those reporting > 7 h average sleep duration (n = 50), compared to those reporting 7 h of sleep duration (n = 48) over the prior month. Fixed effects included age, sex, time, interval between sleep assessment and initial MRI scan, education, race, sleep, education × time, race × time, age × time, sex × time, and sleep × time; subject-specific slopes and intercepts were random effects. A primary (vertex-level) threshold of P < 0.01 was applied; figure displays regions with a cluster P < 0.05.
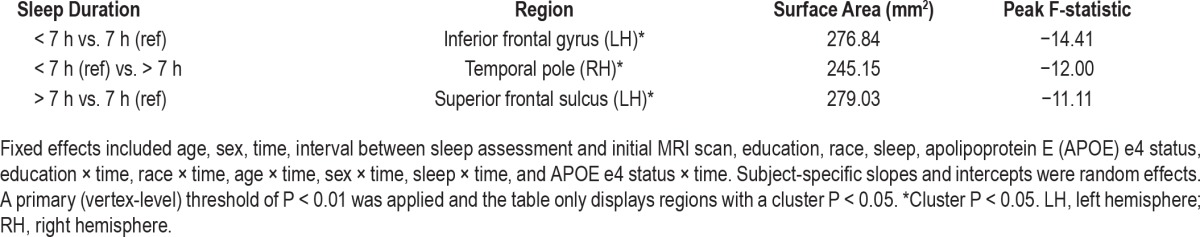
After further adjustment for APOE e4 status, compared to participants reporting 7 h sleep duration, those reporting < 7 h still had higher rates of thinning in the inferior frontal gyrus of the left hemisphere, and those reporting > 7 h still had higher rates of thinning in the superior frontal sulcus of the left hemisphere (Table 4; cluster P < 0.05 for all). In addition, after adjusting for e4 status, those reporting > 7 h sleep duration had higher rates of thinning in the temporal pole of the right hemisphere, compared to those reporting < 7 h of sleep (cluster P < 0.05).
Table 4.
Apolipoprotein E e4-adjusted association of sleep duration with subsequent rates of cortical thinning (n = 122).
In sensitivity analyses, compared to those reporting < 7 h sleep, those reporting 7 or 8 h of sleep had significantly greater cortical thickness on initial MRI scans in the left inferior angular gyrus (area = 263.8 mm2, cluster P < 0.05) and thinner cortical thickness in the right insula (area = 358.4 mm2, cluster P < 0.01). In longitudinal sensitivity analyses using 7 or 8 h of sleep as the reference category, although some frontal and temporal regions showed trends for increased cortical thinning in those reporting < 7 h, no results met the vertex-level P < 0.01 threshold and the cluster-level P < 0.05 threshold for significance. Furthermore, no regions survived cluster-level significance for baseline and longitudinal comparisons after controlling for e4 status.
DISCUSSION
In this study of older adults who remained cognitively normal, we found that compared to those reporting an average baseline sleep duration of 7 h, participants who reported shorter or longer sleep duration had higher rates of subsequent gray matter atrophy, measured by cortical thinning on MRI, over an average of 8 y of follow-up. In longitudinal analyses, associations between sleep duration and decreases in cortical thickness were restricted to frontal and temporal regions, and occurred predominantly in the left hemisphere. Sleep duration longer than 7 h was associated with thinner cortex in the inferior occipital gyrus and sulcus on initial MRI scans, but there was no prospective association between sleep duration and atrophy in these regions. Our findings extend prior studies linking short or long sleep duration to cognitive impairment and decline,3–9 and indicate that among older adults, sleep of too short or too long a duration may increase the rate of a frontotemporal pattern of neurodegeneration.
Our findings are partially consistent with those from prior imaging studies in younger or mixed-age samples of individuals with diagnosed insomnia. Some prior cross-sectional studies linked insomnia diagnosis with reduced gray matter in both prefrontal and superior temporal gyrus,11 and in the left orbitofrontal cortex.15 Although these regions partially overlap with those in which we observed more rapid sleep duration-related atrophy in our longitudinal results, we did not observe associations between baseline sleep duration and initial MRI scan in these regions. In addition, prior studies tied insomnia to decreased gray matter in the pericentral cortex11 and precuneus,15 in which we did not find evidence of greater atrophy, and three additional cross-sectional studies reported no differences between the brains of individuals with or without insomnia.12–14 These discrepancies may exist in part because, in our study, sleep duration was measured an average of almost 3 y before the initial MRI scan was performed.
Less has been published to date about sleep duration and gray matter atrophy over time. Lo et al. found that older adults reporting short sleep had more rapid ventricular expansion over a 2-y period, but contrary to our findings, did not observe links between sleep duration and other brain structures.16 Similarly, Sexton et al. found no association between self-reported sleep duration and changes in brain volume over two timepoints in a sample that included young adults.17 Our divergent findings may be attributable to the greater statistical power afforded by the repeated sampling in our study with an average of 7.6 MRI scans over a longer follow-up interval. In contrast to our findings linking longer sleep duration to reduced thickness in the inferior occipital gyrus and sulcus on initial MRI scans, Sexton and colleagues17 found cross-sectional associations between shorter sleep duration and reduced volume of a region of the superior frontal cortex. This difference may be attributable to the different age compositions of our samples. We also found that sleep duration was primarily associated with thinning in the left hemisphere, but the two prior studies that investigated the association of sleep duration and cortical thinning either did not focus on laterality of findings or had null results.16,17 The reason for our lateralized findings is unclear and replication in another sample is needed.
Although adding APOE e4 status to our statistical models attenuated the observed associations in this study, this should be interpreted cautiously. The APOE e4 genotype increases the risk of AD,36 and amyloid deposition (a key component of AD) leads to disturbed sleep in animal models.41 If abnormal sleep duration in fact increases the risk of atrophy, APOE genotype would be on the causal pathway of interest, and adjusting for it might overadjust to the extent that sleep duration is affected by APOE e4-related amyloid deposition in our sample. Indeed, we have previously reported a cross-sectional association between amyloid deposition and self-reported sleep duration among BLSA participants.1 However, APOE e4 genotype may drive some of the associations we observed, and further studies in larger samples are needed to investigate the nature of the associations between APOE and sleep duration, including potential interactions, on cortical thinning.
Our findings raise the question of whether short or long sleep duration actually accelerates atrophy. Our study's prospective design suggests the interpretation that short or long sleep duration may cause gray matter atrophy. However, because this is an observational study, we are unable to make conclusive causal inferences. It may be that prior atrophy affected sleep duration as measured at our baseline, and that short or long sleep duration does not cause cortical atrophy, but actually results from it. It is also possible that a third variable is confounding the observed associations of sleep duration with higher rates of cortical thinning.
The mechanism that might mediate a causal link between short sleep duration and higher rates of cortical thinning remains to be identified. Recent studies in flies, mice, and humans have suggested that reduced sleep may accelerate β-amyloid (Aβ) pathology.1,42,43 However, this relationship is unlikely to account for our findings, given regions of early Aβ deposition and neurodegeneration are generally not correlated.44 Another possibility relates to slow wave sleep (SWS), which is postulated to downscale the synaptic strength that increases during wakefulness,45 and shows a predilection for the frontal lobes.46 Thus, loss of SWS might lead to excessive neuronal activity, which might relate to the regional frontal atrophy that we observed. Indeed, in cross-sectional studies, Mander et al. found that the degree of gray matter atrophy in the medial prefrontal cortex is associated with decreased SWS47 and Dubé et al. showed that reduced cortical thickness in brain regions—including the frontotemporal areas in which we observed thinning over time in relation to sleep duration—was associated with reduced density of slow waves during sleep.48 In addition, a recent study of older Japanese American men found that a lower proportion of time spent in SWS was associated with greater generalized brain atrophy at autopsy.49 Alternatively, positron emission tomography studies have suggested a relatively specific reduction in glucose metabolism in prefrontal and temporal cortices, as well as in subcortical structures, following sleep deprivation.50–52 Thus, these brain regions may be particularly susceptible to decreases in sleep duration, although functional MRI data reveal more complex patterns of regional changes in activity following sleep deprivation.52 In summary, changes in neuronal activity related to sleep loss may help account for our findings, but further studies are needed to elucidate potential causal mechanisms.
The mechanisms that might causally link long sleep duration to greater subsequent atrophy are less readily identified. It may be that although a moderate amount of sleep-induced downscaling of neuronal activity promotes brain health, excessive downscaling resulting from chronic long sleep duration is harmful. However, this has yet to be demonstrated. Alternatively, long sleep may be a marker of medical illness or pre-clinical atrophy and not a cause.7 The nature of the association between long sleep duration and neurocognitive outcomes in general requires further study.
Our study has several limitations that must be considered. First, sleep duration was measured by self-report rather than by an objective measure such actigraphy or polysomnography. Future studies that use these methods are needed to corroborate our results. Second, approximately 75% of our sample reported 7 or 8 h of sleep, and only seven participants (6%) reported obtaining > 8 h, precluding us from examining whether sleep duration of > 8 or > 9 h is associated with more rapid atrophy than sleep of > 7 h duration. This is important, given the recent NSF recommendations regarding sleep duration (7 to 9 h for those aged 25 to 64 y, 7 to 8 h for those age 65 y or older)39 and the consensus recommendations from the AASM and SRS (7 to 9 h for ages 18 to 60 y).40 Studies with a larger proportion of long sleepers are needed to clarify just how long sleep can be before it is associated with an increased risk of neurodegeneration. Interestingly, in sensitivity analyses based on the NSF recommendations for adults aged 65 y and older (comparing sleep of < 7 h to that of 7 or 8 h of sleep),39 < 7 h sleep was not significantly associated with greater cortical thinning. However, cortical atrophy was not considered in the formation of these guidelines,39 and similarly, the AASM/SRS guidelines for younger adults were formed without reviewing neuroimaging studies.40 Thus, our findings do not contradict these recommendations, and it would be inappropriate at this time to recommend that older adults limit themselves to 7 h rather than 8 h of sleep to prevent brain atrophy. Further research in humans and animal models is required to investigate the effects of sleep duration, including possible nonlinear effects, on neuronal health and underlying mechanisms. Further, sleep-disordered breathing (SDB) and other sleep disorders can affect sleep duration, and may have contributed to the associations under study. In addition to being common among older adults,53 SDB has been linked to structural brain changes, including frontotemporal atrophy.54 Replication of findings is needed in a cohort with rigorous measures of SDB and other sleep disorders. Finally, BLSA participants tend to be highly educated and are required to be healthy on enrollment. It is unclear whether our results would generalize to a less-educated population, or one with greater medical morbidity.
In summary, we found that older adults reporting an average sleep duration of either less than or more than 7 h had more rapid cortical thinning in frontal and temporal brain regions than those reporting 7 h of sleep. Further studies are needed to replicate these findings and clarify the mechanisms underlying these associations and evaluate whether interventions that enhance the consistency of intermediate-duration sleep prevent brain atrophy and cognitive decline.
DISCLOSURE STATEMENT
This study was supported in part by the Intramural Research Program (IRP), National Institute on Aging (NIA), National Institutes of Health (NIH) and by Research and Development Contract HHSN-260-2004-00012C. Dr. Spira was supported in part by 1K01AG033195 and by 1R01AG050507 from the National Institute on Aging and has received funding from the William and Ella Owens Medical Research Foundation. Investigators from the NIH, NIA, and IRP were involved in all aspects of this manuscript, including the design and conduct of the study; collection, management, analysis, and interpretation of the data; and preparation, review, or approval of the manuscript; and decision to submit the manuscript for publication. Dr. Resnick has an immediate family member who has received grant/research support from Takeda, Roche, Pfizer, Lundbeck, Johnson & Johnson, Intracellular, GE Healthcare, DART Neuroscience, Avid/Lilly, and Piramal Imaging. The other authors report no conflicts of interest. Results from this study were presented at the 2015 Annual Meeting of the Gerontological Society of America.
REFERENCES
- 1.Spira AP, Gamaldo AA, An Y, et al. Self-reported sleep and beta-amyloid deposition in community-dwelling older adults. JAMA Neurol. 2013;70:1537–43. doi: 10.1001/jamaneurol.2013.4258. [DOI] [PMC free article] [PubMed] [Google Scholar]
- 2.Ju YE, McLeland JS, Toedebusch CD, et al. Sleep quality and preclinical Alzheimer disease. JAMA Neurol. 2013;70:587–93. doi: 10.1001/jamaneurol.2013.2334. [DOI] [PMC free article] [PubMed] [Google Scholar]
- 3.Ohayon MM, Vecchierini MF. Normative sleep data, cognitive function and daily living activities in older adults in the community. Sleep. 2005;28:981–9. [PubMed] [Google Scholar]
- 4.Keage HA, Banks S, Yang KL, Morgan K, Brayne C, Matthews FE. What sleep characteristics predict cognitive decline in the elderly? Sleep Med. 2012;13:886–92. doi: 10.1016/j.sleep.2012.02.003. [DOI] [PubMed] [Google Scholar]
- 5.Faubel R, Lopez-Garcia E, Guallar-Castillon P, Graciani A, Banegas JR, Rodriguez-Artalejo F. Usual sleep duration and cognitive function in older adults in Spain. J Sleep Res. 2009;18:427–35. doi: 10.1111/j.1365-2869.2009.00759.x. [DOI] [PubMed] [Google Scholar]
- 6.Blackwell T, Yaffe K, Ancoli-Israel S, et al. Association of sleep characteristics and cognition in older community-dwelling men: the MrOS sleep study. Sleep. 2011;34:1347–56. doi: 10.5665/SLEEP.1276. [DOI] [PMC free article] [PubMed] [Google Scholar]
- 7.Benito-Leon J, Louis ED, Bermejo-Pareja F. Cognitive decline in short and long sleepers: a prospective population-based study (NEDICES) J Psychiatr Res. 2013;47:1998–2003. doi: 10.1016/j.jpsychires.2013.09.007. [DOI] [PMC free article] [PubMed] [Google Scholar]
- 8.Tworoger SS, Lee S, Schernhammer ES, Grodstein F. The association of self-reported sleep duration, difficulty sleeping, and snoring with cognitive function in older women. Alzheimer Dis Assoc Disord. 2006;20:41–8. doi: 10.1097/01.wad.0000201850.52707.80. [DOI] [PubMed] [Google Scholar]
- 9.Devore EE, Grodstein F, Duffy JF, Stampfer MJ, Czeisler CA, Schernhammer ES. Sleep duration in midlife and later life in relation to cognition. J Am Geriatr Soc. 2014;62:1073–81. doi: 10.1111/jgs.12790. [DOI] [PMC free article] [PubMed] [Google Scholar]
- 10.Riemann D, Voderholzer U, Spiegelhalder K, et al. Chronic insomnia and MRI-measured hippocampal volumes: a pilot study. Sleep. 2007;30:955–8. doi: 10.1093/sleep/30.8.955. [DOI] [PMC free article] [PubMed] [Google Scholar]
- 11.Joo EY, Noh HJ, Kim JS, et al. Brain gray matter deficits in patients with chronic primary insomnia. Sleep. 2013;36:999–1007. doi: 10.5665/sleep.2796. [DOI] [PMC free article] [PubMed] [Google Scholar]
- 12.Noh HJ, Joo EY, Kim ST, et al. The relationship between hippocampal volume and cognition in patients with chronic primary insomnia. J Clin Neurol. 2012;8:130–8. doi: 10.3988/jcn.2012.8.2.130. [DOI] [PMC free article] [PubMed] [Google Scholar]
- 13.Winkelman JW, Benson KL, Buxton OM, et al. Lack of hippocampal volume differences in primary insomnia and good sleeper controls: an MRI volumetric study at 3 Tesla. Sleep Med. 2010;11:576–82. doi: 10.1016/j.sleep.2010.03.009. [DOI] [PubMed] [Google Scholar]
- 14.Spiegelhalder K, Regen W, Baglioni C, et al. Insomnia does not appear to be associated with substantial structural brain changes. Sleep. 2013;36:731–7. doi: 10.5665/sleep.2638. [DOI] [PMC free article] [PubMed] [Google Scholar]
- 15.Altena E, Vrenken H, Van Der Werf YD, van den Heuvel OA, Van Someren EJ. Reduced orbitofrontal and parietal gray matter in chronic insomnia: a voxel-based morphometric study. Biol Psychiatry. 2010;67:182–5. doi: 10.1016/j.biopsych.2009.08.003. [DOI] [PubMed] [Google Scholar]
- 16.Lo JC, Loh KK, Zheng H, Sim SKY, Chee MWL. Sleep duration and age-related changes in brain structure and cognitive performance. Sleep. 2014;37:1171–8. doi: 10.5665/sleep.3832. [DOI] [PMC free article] [PubMed] [Google Scholar]
- 17.Sexton CE, Storsve AB, Walhovd KB, Johansen-Berg H, Fjell AM. Poor sleep quality is associated with increased cortical atrophy in community-dwelling adults. Neurology. 2014;83:967–73. doi: 10.1212/WNL.0000000000000774. [DOI] [PMC free article] [PubMed] [Google Scholar]
- 18.Resnick SM, Goldszal AF, Davatzikos C, et al. One-year age changes in MRI brain volumes in older adults. Cereb Cortex. 2000;10:464–72. doi: 10.1093/cercor/10.5.464. [DOI] [PubMed] [Google Scholar]
- 19.Shock N, Greulich R, Andres R, et al. Washington, DC: National Institutes of Health; 1984. Normal human aging: the Baltimore Longitudinal Study of Aging. [Google Scholar]
- 20.Pacheco J, Goh JO, Kraut MA, Ferrucci L, Resnick SM. Greater cortical thinning in normal older adults predicts later cognitive impairment. Neurobiol Aging. 2015;36:903–8. doi: 10.1016/j.neurobiolaging.2014.08.031. [DOI] [PMC free article] [PubMed] [Google Scholar]
- 21.Segonne F, Dale AM, Busa E, et al. A hybrid approach to the skull stripping problem in MRI. Neuroimage. 2004;22:1060–75. doi: 10.1016/j.neuroimage.2004.03.032. [DOI] [PubMed] [Google Scholar]
- 22.Fischl B, Salat DH, Busa E, et al. Whole brain segmentation: automated labeling of neuroanatomical structures in the human brain. Neuron. 2002;33:341–55. doi: 10.1016/s0896-6273(02)00569-x. [DOI] [PubMed] [Google Scholar]
- 23.Fischl B, Salat DH, van der Kouwe AJ, et al. Sequence-independent segmentation of magnetic resonance images. Neuroimage. 2004;23(Suppl 1):S69–84. doi: 10.1016/j.neuroimage.2004.07.016. [DOI] [PubMed] [Google Scholar]
- 24.Sled JG, Zijdenbos AP, Evans AC. A nonparametric method for automatic correction of intensity nonuniformity in MRI data. IEEE Trans Med Imaging. 1998;17:87–97. doi: 10.1109/42.668698. [DOI] [PubMed] [Google Scholar]
- 25.Fischl B, Liu A, Dale AM. Automated manifold surgery: constructing geometrically accurate and topologically correct models of the human cerebral cortex. IEEE Trans Med Imaging. 2001;20:70–80. doi: 10.1109/42.906426. [DOI] [PubMed] [Google Scholar]
- 26.Segonne F, Pacheco J, Fischl B. Geometrically accurate topology-correction of cortical surfaces using nonseparating loops. IEEE Trans Med Imaging. 2007;26:518–29. doi: 10.1109/TMI.2006.887364. [DOI] [PubMed] [Google Scholar]
- 27.Dale AM, Fischl B, Sereno MI. Cortical surface-based analysis. I. Segmentation and surface reconstruction. Neuroimage. 1999;9:179–94. doi: 10.1006/nimg.1998.0395. [DOI] [PubMed] [Google Scholar]
- 28.Dale AM, Sereno MI. Improved localizadon of cortical activity by combining EEG and MEG with MRI cortical surface reconstruction: a linear approach. J Cogn Neurosci. 1993;5:162–76. doi: 10.1162/jocn.1993.5.2.162. [DOI] [PubMed] [Google Scholar]
- 29.Fischl B, Dale AM. Measuring the thickness of the human cerebral cortex from magnetic resonance images. Proc Natl Acad Sci U S A. 2000;97:11050–5. doi: 10.1073/pnas.200033797. [DOI] [PMC free article] [PubMed] [Google Scholar]
- 30.Reuter M, Schmansky NJ, Rosas HD, Fischl B. Within-subject template estimation for unbiased longitudinal image analysis. Neuroimage. 2012;61:1402–18. doi: 10.1016/j.neuroimage.2012.02.084. [DOI] [PMC free article] [PubMed] [Google Scholar]
- 31.Blessed G, Tomlinson BE, Roth M. The association between quantitative measures of dementia and of senile change in the cerebral grey matter of elderly subjects. Br J Psychiatry. 1968;114:797–811. doi: 10.1192/bjp.114.512.797. [DOI] [PubMed] [Google Scholar]
- 32.Morris JC. The Clinical Dementia Rating (CDR): current version and scoring rules. Neurology. 1993;43:2412–4. doi: 10.1212/wnl.43.11.2412-a. [DOI] [PubMed] [Google Scholar]
- 33.Petersen RC, Smith GE, Waring SC, Ivnik RJ, Tangalos EG, Kokmen E. Mild cognitive impairment: clinical characterization and outcome. Arch Neurol. 1999;56:303–8. doi: 10.1001/archneur.56.3.303. [DOI] [PubMed] [Google Scholar]
- 34.American Psychiatric Association. Washington, DC: American Psychiatric Association; 1987. Diagnostic and statistical manual of mental disorders, 3rd ed, revised. [Google Scholar]
- 35.McKhann G, Drachman D, Folstein M, Katzman R, Price D, Stadlan EM. Clinical diagnosis of Alzheimer's disease: report of the NINCDSADRDA Work Group under the auspices of Department of Health and Human Services Task Force on Alzheimer's Disease. Neurology. 1984;34:939–44. doi: 10.1212/wnl.34.7.939. [DOI] [PubMed] [Google Scholar]
- 36.Corder E, Saunders A, Strittmatter W, et al. Gene dose of apolipoprotein E type 4 allele and the risk of Alzheimer's disease in late onset families. Science. 1993;261:921–3. doi: 10.1126/science.8346443. [DOI] [PubMed] [Google Scholar]
- 37.Bernal-Rusiel JL, Greve DN, Reuter M, Fischl B, Sabuncu MR Alzheimer's Disease Neuroimaging Initiative. Statistical analysis of longitudinal neuroimage data with Linear Mixed Effects models. Neuroimage. 2013;66:249–60. doi: 10.1016/j.neuroimage.2012.10.065. [DOI] [PMC free article] [PubMed] [Google Scholar]
- 38.Bernal-Rusiel JL, Reuter M, Greve DN, Fischl B, Sabuncu MR Alzheimer's Disease Neuroimaging Initiative. Spatiotemporal linear mixed effects modeling for the mass-univariate analysis of longitudinal neuroimage data. Neuroimage. 2013;81:358–70. doi: 10.1016/j.neuroimage.2013.05.049. [DOI] [PMC free article] [PubMed] [Google Scholar]
- 39.Hirshkowitz M, Whiton K, Albert SM, et al. National Sleep Foundation's sleep time duration recommendations: methodology and results summary. Sleep Health. 2015;1:40–3. doi: 10.1016/j.sleh.2014.12.010. [DOI] [PubMed] [Google Scholar]
- 40.Watson NF, Badr MS, Belenky G, et al. Joint consensus statement of the American Academy of Sleep Medicine and Sleep Research Society on the recommended amount of sleep for a healthy adult: methodology and discussion. Sleep. 2015;38:1161–83. doi: 10.5665/sleep.4886. [DOI] [PMC free article] [PubMed] [Google Scholar]
- 41.Roh JH, Huang Y, Bero AW, et al. Disruption of the sleep-wake cycle and diurnal fluctuation of beta-amyloid in mice with Alzheimer's disease pathology. Sci Trans Med. 2012;4:150ra22. doi: 10.1126/scitranslmed.3004291. [DOI] [PMC free article] [PubMed] [Google Scholar]
- 42.Tabuchi M, Lone SR, Liu S, et al. Sleep interacts with abeta to modulate intrinsic neuronal excitability. Curr Biol. 2015;25:702–12. doi: 10.1016/j.cub.2015.01.016. [DOI] [PMC free article] [PubMed] [Google Scholar]
- 43.Kang JE, Lim MM, Bateman RJ, et al. Amyloid-beta dynamics are regulated by orexin and the sleep-wake cycle. Science. 2009;326:1005–7. doi: 10.1126/science.1180962. [DOI] [PMC free article] [PubMed] [Google Scholar]
- 44.Serrano-Pozo A, Frosch MP, Masliah E, Hyman BT. Neuropathological alterations in Alzheimer disease. Cold Spring Harb Perspect Med. 2011;1:a006189. doi: 10.1101/cshperspect.a006189. [DOI] [PMC free article] [PubMed] [Google Scholar]
- 45.Tononi G, Cirelli C. Sleep function and synaptic homeostasis. Sleep Med Rev. 2006;10:49–62. doi: 10.1016/j.smrv.2005.05.002. [DOI] [PubMed] [Google Scholar]
- 46.Muzur A, Pace-Schott EF, Hobson JA. The prefrontal cortex in sleep. Trend Cogn Sci. 2002;6:475–81. doi: 10.1016/s1364-6613(02)01992-7. [DOI] [PubMed] [Google Scholar]
- 47.Mander BA, Rao V, Lu B, et al. Prefrontal atrophy, disrupted NREM slow waves and impaired hippocampal-dependent memory in aging. Nat Neurosci. 2013;16:357–64. doi: 10.1038/nn.3324. [DOI] [PMC free article] [PubMed] [Google Scholar]
- 48.Dubé J, Lafortune M, Bedetti C, et al. Cortical thinning explains changes in sleep slow waves during adulthood. J Neurosci. 2015;35:7795–807. doi: 10.1523/JNEUROSCI.3956-14.2015. [DOI] [PMC free article] [PubMed] [Google Scholar]
- 49.Gelber RP, Redline S, Ross GW, et al. Associations of brain lesions at autopsy with polysomnography features before death. Neurology. 2015;84:296–303. doi: 10.1212/WNL.0000000000001163. [DOI] [PMC free article] [PubMed] [Google Scholar]
- 50.Wu JC, Gillin JC, Buchsbaum MS, et al. The effect of sleep deprivation on cerebral glucose metabolic rate in normal humans assessed with positron emission tomography. Sleep. 1991;14:155–62. [PubMed] [Google Scholar]
- 51.Wu JC, Gillin JC, Buchsbaum MS, et al. Frontal lobe metabolic decreases with sleep deprivation not totally reversed by recovery sleep. Neuropsychopharmacology. 2006;31:2783–92. doi: 10.1038/sj.npp.1301166. [DOI] [PubMed] [Google Scholar]
- 52.Goel N, Rao H, Durmer JS, Dinges DF. Neurocognitive consequences of sleep deprivation. Semin Neurol. 2009;29:320–39. doi: 10.1055/s-0029-1237117. [DOI] [PMC free article] [PubMed] [Google Scholar]
- 53.Ancoli-Israel S, Kripke DF, Klauber MR, Mason WJ, Fell R, Kaplan O. Sleep-disordered breathing in community-dwelling elderly. Sleep. 1991;14:486–95. doi: 10.1093/sleep/14.6.486. [DOI] [PMC free article] [PubMed] [Google Scholar]
- 54.Weng HH, Tsai YH, Chen CF, et al. Mapping gray matter reductions in obstructive sleep apnea: an activation likelihood estimation meta-analysis. Sleep. 2014;37:167–75. doi: 10.5665/sleep.3330. [DOI] [PMC free article] [PubMed] [Google Scholar]
Associated Data
This section collects any data citations, data availability statements, or supplementary materials included in this article.