

Abstract
Study Objectives:
To evaluate the effect of an employer-mandated obstructive sleep apnea (OSA) program on the risk of serious preventable truck crashes.
Methods:
Data are from the first large-scale, employer-mandated program to screen, diagnose, and monitor OSA treatment adherence in the US trucking industry. A retrospective analysis of cohorts was constructed: polysomnogram-diagnosed drivers (OSA positive n = 1,613, OSA negative n = 403) were matched to control drivers unlikely to have OSA (n = 2,016) on two factors affecting crash risk, experience-at-hire and length of job tenure; tenure was matched on the date of each diagnosed driver's polysomnogram. Auto-adjusting positive airway pressure (APAP) treatment was provided to all cases (i.e. OSA positive drivers); treatment adherence was objectively monitored. Cases were grouped by treatment adherence: “Full Adherence” (n = 682), “Partial Adherence” (n = 571), or “No Adherence” (n = 360). Preventable Department-of-Transportation-reportable crashes/100,000 miles were compared across study subgroups. Robustness was assessed.
Results:
After the matching date, “No Adherence” cases had a preventable Department of Transportation-reportable crash rate that was fivefold greater (incidence rate ratio = 4.97, 95% confidence interval: 2.09, 10.63) than that of matched controls (0.070 versus 0.014 per 100,000 miles). The crash rate of “Full Adherence” cases was statistically similar to controls (incidence rate ratio = 1.02, 95% confidence interval: 0.48, 2.04; 0.014 per 100,000 miles).
Conclusions:
Nontreatment-adherent OSA-positive drivers had a fivefold greater risk of serious preventable crashes, but were discharged or quit rapidly, being retained only one-third as long as other subjects. Thus, the mandated program removed risky nontreatment-adherent drivers and retained adherent drivers at the study firm. Current regulations allow nonadherent OSA cases to drive at another firm by keeping their diagnosis private.
Commentary:
A commentary on this article appears in this issue on page 961.
Citation:
Burks SV, Anderson JE, Bombyk M, Haider R, Ganzhorn D, Jiao X, Lewis C, Lexvold A, Liu H, Ning J, Toll A, Hickman JS, Mabry E, Berger M, Malhotra A, Czeisler CA, Kales SN. Nonadherence with employer-mandated sleep apnea treatment and increased risk of serious truck crashes. SLEEP 2016;39(5):967–975.
Keywords: APAP, commercial motor vehicle operator, CPAP, motor carrier, obstructive sleep apnea, OSA, preventable crash, PSG, screening, truckload
Significance.
Limited data from commercial drivers is a major reason for the US Federal Motor Carrier Safety Administration's failure to require screening for obstructive sleep apnea (OSA). We present the results of the first large-scale, employer program to screen, diagnose, and monitor OSA treatment adherence in the US trucking industry. Among drivers in whom OSA was diagnosed through the program, those adherent with employer-provided positive airway pressure treatment had crash risks similar to controls, whereas nonadherent drivers had a fivefold greater preventable crash risk after adjustment for miles driven and driving experience. Therefore, our results strongly support federal OSA regulations for commercial drivers. Future research should improve the calibration of criteria and thresholds for OSA treatment success.
INTRODUCTION
Experts estimate that between 7%1 and 20%2 of all large truck crashes are due to drowsy/fatigued driving. Therefore, in the United States, from 2004 to 2013, 3,133 to 8,952 deaths and 77,000 to 220,000 serious injuries (mostly among the traveling public) are likely attributable to fatigued/sleepy commercial motor vehicle (CMV) drivers.3,4 Obstructive sleep apnea (OSA) is the most common medical cause of excessive daytime sleepiness or fatigue5 and has been linked with specific neuro-cognitive deficits in attention/working memory, vigilance, and executive functioning.6–8 Untreated OSA increases the risk of motor vehicle crashes among noncommercial drivers by 1.2-to 4.9-fold,9,10 whereas effective treatment with positive airway pressure (PAP) significantly reduces this excess crash risk.11 Among the estimated 1.7 to 3.9 million active US commercial drivers,4,12 17% to 28% or 0.29–1.1 million are expected to have OSA based on prevalence studies conducted within the trucking industry.13–17 Most of these drivers are thought to be undiagnosed and untreated.13,18
Commercial vehicle operators undergo a biennial examination to determine their medical fitness to safely operate a vehicle. Although the possibility of OSA may be evaluated by the commercial driver medical examiner (CDME), the US Federal Motor Carrier Safety Administration (FMCSA) has not established any mandatory standard for OSA screening or diagnosis, in part due to the absence of large-scale studies evaluating the crash risk of commercial drivers in whom OSA has been diagnosed. A 2011 FMCSA medical evidence report observed that although OSA is a clear risk factor for non-CMV drivers, the evidence for this relationship in CMV drivers was “minimally acceptable” and concluded that the effect sizes could not be estimated, nor could disease-related risk factors be identified.19 Two more recent studies have mixed results and methodological limitations.20–22
Recent legislation prohibits the FMCSA from offering “regulatory guidance” (which identifies best clinical practices in the absence of a mandatory standard) on how carriers should address the potential existence of OSA among their drivers without a full, formal rulemaking.23,24 Some in the trucking industry have gone so far as to argue that CDMEs “are prohibited from requiring a sleep study for any driver.”25 The FMCSA has issued a recent advisory that, while still allowing for CDME clinical judgment, makes the absence of mandatory standards explicit. Thus, it is critical to discover whether a mandated OSA program can reduce crash risk.
Because treatment for OSA has been proven to be effective and substantial evidence already exists that untreated OSA increases the risk of crashes, a randomized prospective controlled trial of the degree of commercial driver crash risk associated with untreated OSA is neither ethically nor legally feasible. Therefore, this retrospective study analyzes preventable truck crashes experienced by commercial drivers in the context of an employer-mandated OSA program that includes screening, diagnosis, auto-adjusting positive airway pressure (APAP) treatment, and APAP treatment adherence monitoring.13,26 It is hypothesized that drivers with diagnosed OSA who are nontreatment adherent will have an elevated rate of serious preventable truck crashes and exit the firm faster than controls who screen at low likelihood of having OSA, whereas those with OSA who are treatment adherent will have similar crash and retention rates to controls.
METHODS
Study Firm Clinical Protocol
Screening and Diagnosis
The OSA screening, diagnosis, and treatment program was implemented by Schneider National, Inc., a major North American trucking firm.27 Following a small pilot in 2005, implementation rollout began in April 2006.13,26 The Somni-Sage screening questionnaire used assigns drivers to one of four classes ranging from one (“High Priority”) to four (“Low-Priority”), for receiving polysomnogram (PSG) diagnostic testing.26 Due to the startup process in the presence of turnover, about one-half (n = 17,098) of the drivers employed from 2006 onward were screened. The study firm chose who to refer from those screened as High Priority for overnight, multi-channel, laboratory, technician-attended PSGs (“Type 1” PSGs as defined by the American Academy of Sleep Medicine)28 at a national network of sleep laboratories. PSG records show 5 tests in 2005, 493 in 2006, 370 in 2007, 632 in 2008, and 662 in 2009. Referral was based on several factors, such as the driver's schedule, route, continuing employment, and sleep laboratory availability. Diagnosis and treatment were covered without co-pays as preventive medicine for drivers carrying the firm's voluntary medical insurance plan.
Disease Management
PSGs were interpreted immediately using standard criteria with diagnostic clinical evaluations the morning after the overnight tests.28 Drivers with an apnea-hypopnea index (AHI) ≥ 5 received a diagnosis of “positive” for OSA, and first-line treatment was given: an APAP machine, heated humidifier, and mask interface. This equipment operates with AC or DC power and is usable both in the truck sleeper berth while on the road and at home. For the first 14 to 90 days, and longer if necessary, drivers' adherence to APAP therapy and treatment efficacy was monitored using wireless data transmission to the disease management team from the drivers' PAP machines. During this initial treatment period, the disease management team intervened to assist drivers in becoming adherent, providing frequent phone and sometimes face-to-face contacts with each treated driver to assist with ongoing PAP troubleshooting, education, and adherence monitoring.
After initial APAP adherence was demonstrated, monitoring continued from periodic (quarterly) batch downloads from the APAP machine's internal adherence memory (“adherence chip”). Adherence troubleshooting, education, and monitoring using phone and face-to-face contacts continued as necessary. When medically indicated, formal titration studies and the option of a possible change to bilevel PAP therapy were available and used in order to improve drivers' tolerance of therapy and treatment adherence. Drivers with OSA who remained nonadherent as demonstrated by objective APAP adherence monitoring despite this multifaceted process of remediation were eventually terminated after the process of remediation failed.
Retrospective Cohort Approach With Case-Control Matching Determines Study Sub-groups
Methodology and the Study Context
Two contextual factors determine the methodology. First, the study firm engages in long distance for-hire trucking in which driver turnover rates are very high (typically ≥ 80% annually),27,29 whereas some drivers stay for considerable durations, and many join and depart from the firm in a continuous process.27,30 Turnover at the study firm ranged from 34% to 76% over the course of the study period. Crash rates, especially among new drivers, are strongly associated with driving experience and firm tenure31,32 due both to the improvement of driving skill with practice and to the discharge of those who accumulate unacceptable crash records (the latter is analogous to a “healthy worker survival effect”33). The safety selection effect is strong. During the study period the baseline hazard of being discharged in a given specific week was raised by approximately 30-fold if the driver had a preventable Department of Transportation (DOT)-reportable crash during the prior or current week. Second, the existence of a gold standard treatment for OSA (APAP) ethically precludes assigning drivers with OSA to receive no treatment (due to medical risk to the patient and potential crash risk for patients and the motoring public). Therefore, analysis of an actual employer-based OSA program with mandated screening, diagnosis, and treatment was performed using a retrospective cohort approach with case-control matching.
Cases were matched to controls on experience-at-hire and also, using the date of each case's PSG, on job tenure. This accounts for differences across subjects in crash risk due to the variations in past and current experience, and for variations in the length of exposure to the chance of safety selection, i.e. of having been discharged due to having a serious preventable crash (which would have prevented the subject from entering the study; further statistical details are provided in the supplemental material).
Study Subgroup Construction
Each OSA-diagnosed driver (n = 2,225), was matched to a randomly drawn control driver from those screened as Low Priority for a PSG (i.e. unlikely to have OSA; n = 3,732) who had the same level of experience (at hire) and job tenure (measured at the calendar week of the diagnosed driver's PSG, called the “matching date” for the control). This randomized matching process led to the following study subgroups.
Controls: drivers screened as Low Priority for a PSG (i.e. unlikely to have OSA; matched n = 2,016). Random selection (with replacement) was used when multiple low priority matches were available for a given OSA-diagnosed driver.
Negatives: drivers with an AHI < 5, diagnosed as “negative” for OSA (n = 403).
- Cases: OSA-diagnosed drivers whose PSG showed AHI ≥ 5 (matched n = 1,613), who were provided with APAP and instructed in its use, with the requirement of treatment adherence as a condition of employment. OSA Cases were further classified by their adherence with PAP treatment after diagnosis.
- Full Adherence: cases who always met or exceeded the consensus minimum standard of 4 h/night mean APAP use for ≥ 70% of nights34 (matched n = 682).
- Partial Adherence: cases whose recorded treatment, but who did not reach the standard for Full Adherence (matched n = 571).
- No Adherence: cases who never recorded any adherence with APAP (matched n = 360).
Crash Outcomes Assessment and Data Synthesis
Using relevant US DOT guidelines, firms in the trucking industry standardly categorize crashes in which driver behavior was a relevant causal factor as either “preventable,” which roughly means that the commercial driver could have and should have taken actions that would have prevented the crash (whatever the proximate cause of the crash may have been), or “not preventable,” if such actions were not possible under the circumstances.35 The study firm provided this characterization, and additionally among preventable crashes identified crashes that were serious insofar as they were required to be reported to the DOT. A crash is “DOT-reportable” if an involved vehicle must be towed from the crash scene, or someone involved requires medical attention away from the scene, or there is a fatality. Selecting “preventable DOT-reportable crashes” is a standard way of identifying crashes that are of managerial and public policy interest in commercial vehicle operations when such internal administrative records are available,27 so this is our primary outcome measure. As robustness checks, all DOT-reportable crashes (whether preventable or not) were also considered, as this more closely tracks what can be observed in governmental crash records.
Existing data from the study firm provided driver demographics, such as age, sex, racial or ethnic category, hiring date, experience level at hire, separation date, and type (if applicable). These were merged with week-by-week operational data that provided information on crashes and crash risk exposure (e.g. weekly miles, job type); then records from the sleep medicine services provider, including the results of the Somni-Sage screening questionnaire and, when applicable, PSG results and APAP adherence data were merged.
Statistical Analysis
To adjust for driving exposure, crashes/100,000 miles driven are reported as incidence rate ratios (IRR) for each study subgroup. The matched comparison approach also accounts for variation in initial crash risk (experience at hire), in learning through experience and the chance of safety selection (job tenure), by ensuring cases and controls are similar with regard to these characteristics. The subgroup comparisons focus on the period after the PSG/matching date, when all crash outcomes are contained in the data. This is because safety selection removed many drivers with a bad preventable crash record from the potential study population during the period before the PSG/ matching date, so comparisons during this period are missing many of the relevant crash events and the drivers who had them, who because of their discharges never became study subjects.
Because assignment to treatment adherence groups was self-assigned, there are likely to be differences across study subgroups in factors that may independently affect crash risk, and that are not directly captured in the case-control matching process. To account for this possibility a second analysis was performed on a panel version of the data (one observation per driver per week) with an Andersen-Gill multivariate model. This model is similar to the perhaps more familiar Cox proportional hazards model of patient survival, the primary difference being that it permits multiple “failure events” (i.e., crashes) per driver.36 The model included age, sex, job type, experience at hire, trip segments per week, miles per week, season (spring, summer, fall, winter), and year of observation as predictor variables; these are all items that potentially affect either crash risk directly, or crash risk indirectly through differences in exposure that not fully captured in miles driven. This analysis provides hazard ratio (HR) estimates in parallel to the IRRs obtained for each study subgroup.
Two additional robustness checks were created by running variations of the original Andersen-Gill multivariate model. First, the crash risk was compared across study subgroups utilizing the higher threshold of AHI ≥ 15 as the criterion for a positive OSA diagnosis (instead of the AHI ≥ 5 criterion actually used in the treatment protocol), in order to observe whether a more stringent definition of a positive diagnosis would change results. Second, crash risk was compared across study subgroups using the alternative crash definition of all DOT-reportable crashes as the dependent variable, instead of restricting attention to only preventable DOT-reportable crashes. This makes the analysis more directly comparable to studies that utilize government crash data, in which information on the contribution of driver behavior to a crash captured in the designation of a crash as “preventable” is not available.
The data synthesis and analysis were performed by the University of Minnesota, Morris Truckers & Turnover Project (S. Burks, Principal Investigator, J. Anderson, Co-Investigator). Retrospective analysis of individually identified protected health information was approved by the Institutional Review Board B of the University of Minnesota. Stata Version 12 software was utilized. (For the interested reader, additional details of the statistical methodology, robustness checks, and the like, are presented in the supplemental material.)
RESULTS
Driver Characteristics
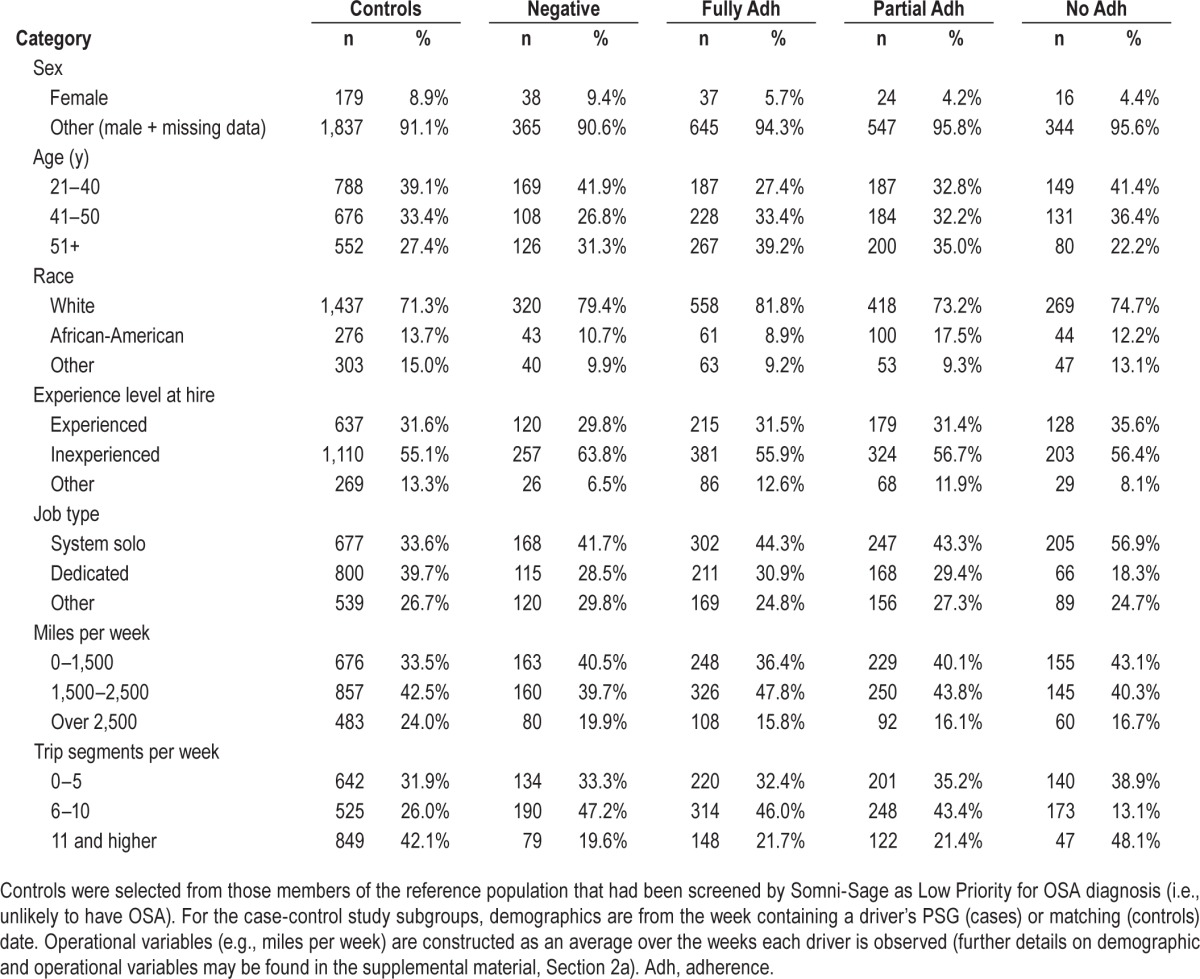
The demographic profile, experience levels, exposure, and job characteristics of the reference population, the matched cases, and controls are broadly similar, but not identical (Table 1). This suggests that, in addition to the primary case-control statistical comparisons across subgroups, robustness checks, such as those using the multivariate Andersen-Gill model, are appropriate to examine.
Table 1.
Demographic and job characteristics of study subgroups.
Primary Results: Crash Rates as a Function of PAP Adherence
After the matching dates, drivers nonadherent with PAP (“No Adherence” subgroup) had a crash rate for preventable DOT-reportable crashes of 0.070/100,000 miles, or nearly five-fold more (IRR of 4.97; 95% confidence interval [CI]: 2.09, 10.63; P < 0.001) than the 0.014/100,000 miles for matched controls. Crash rates for OSA-diagnosed drivers in the Full Adherence (0.014/100,000 miles) and Partial Adherence (0.021/100,000 miles) subgroups showed no statistical difference from matched controls (P = 0.92 and P = 0.19, respectively). See Figure 1A.
Figure 1.

Incidence rate ratios and hazard ratios by study subgroup. (A) Primary results, the rate of preventable crashes in each study subgroup per 100,000 miles driven compared to that of matched controls. (B) Results of the first of the three robustness tests, the hazard ratio for each study subgroup compared with that of matched controls in a multivariate Andersen-Gill time-to-event model on week-by-week data that controls for multiple factors affecting the risk of a crash such as miles per week, trips per week, and demographics. The interval covered is all weeks in which the subject is observed after the polysomnogram date (cases) or matching date (controls). Error bars are 95% confidence intervals. Significant differences between the control group and obstructive sleep apnea study subgroups are denoted as *P < 0.001.
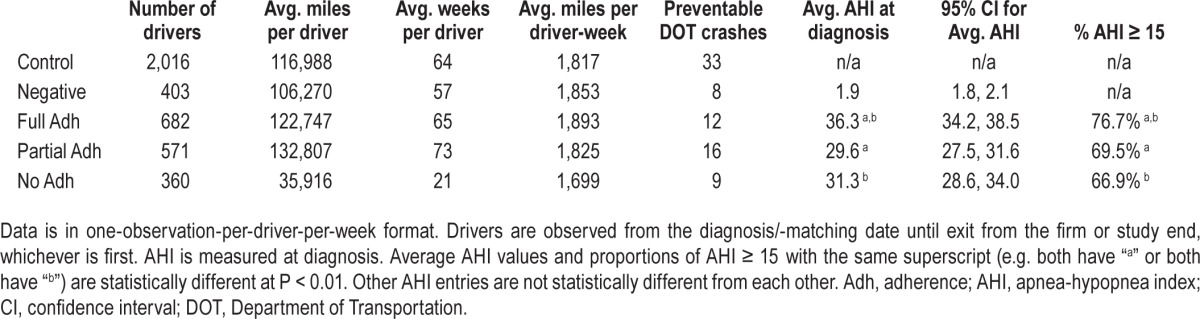
In addition, Table 2 exhibits exposure measures and mean AHI at diagnosis (for diagnosed drivers) by study subgroup. The mean AHI varies statistically across the study subgroups; Full Adherence drivers have the highest AHI (mean AHI = 36.3, 95% CI: 34.2, 38.5), No Adherence are lower (mean AHI = 31.3, 95% CI: 28.6, 34.0), and Partial Adherence are lowest (mean AHI = 29.6, 95% CI: 27.5, 31.6). The Partial and No Adherence groups are not statistically different in mean AHI, whereas both are lower that Full Adherence at a P < 0.01. However, all subgroups have mean AHI levels either at the top of the range associated with a diagnosis of moderate sleep apnea (from AHI = 15 to AHI = 30),37 or above this boundary and therefore in the “severe” sleep apnea range.
Table 2.
Measures of exposure to crash risk and the number of preventable Department of Transportation-reportable crashes after the polysomnogram/matching date, and apnea-hypopnea index characteristics at diagnosis, by study subgroup.
Robustness Checks
As described in the Methods section, three complementary checks of the robustness of these primary results were performed. First, variations across study subgroups in potentially confounding factors not captured in the case-control matching process were accounted for using a multivariate Andersen-Gill time-to-crash regression model. This produced qualitatively similar findings to the primary results (Figure 1B). Drivers in the “No Adherence” group had a nearly fourfold increased risk for preventable DOT-reportable crashes (HR of 3.79; 95% CI: 1.80, 8.00; P < 0.001), whereas crash risk for drivers in the Full Adherence and Partial Adherence subgroups were not statistically different from matched controls.
Second, a variation of the multivariate Andersen-Gill analysis was run that used “all DOT-reportable” crashes as the outcome instead of restricting attention to preventable crashes, to make the analysis more parallel to studies that utilize government crash data, in which information on preventability is not available. Adding crashes that were judged not to be preventable by the commercial driver doubled the crash count of No Adherence drivers from 9 to 20, but increased that of the controls by almost fivefold (63 to 163). Because exposure (miles) for both groups stayed the same, this increased the control group's crash rate more than that of the No Adherence drivers, and lowered the point estimate of their excess crash risk over that of controls by about 40% (HR = 2.21, 95% CI: 1.41–3.48).
Third, a final variation of the multivariate Andersen-Gill analysis was run using a criterion of AHI ≥ 15 as a higher threshold for a positive OSA diagnosis (the control group was not affected by this change). Despite the resulting decreases in the number of No Adherence drivers (from 360 to 241) and in their preventable DOT-reportable crashes (21 to 19), the point estimate of their excess risk compared to controls increased slightly from the initial Andersen-Gill result (HR = 4.54, 95% CI: 2.54–10.32), and moved closer to the primary result provided by the simple comparison of crash rates across study subgroups.
In all of these robustness checks the results follow a similar pattern across study subgroups. Figure 2 illustrates this consistent pattern of the differences in serious preventable crash risk across subgroups in the form of a predicted cumulative hazard of a preventable DOT-reportable crash over 2 years of job tenure. Figure 2 is generated from the first Andersen-Gill multivariate model previously mentioned, which accounts for potential confounding factors, uses AHI ≥ 5 as the criterion for a diagnosis of OSA and considers only preventable DOT-reportable crashes.
Figure 2.
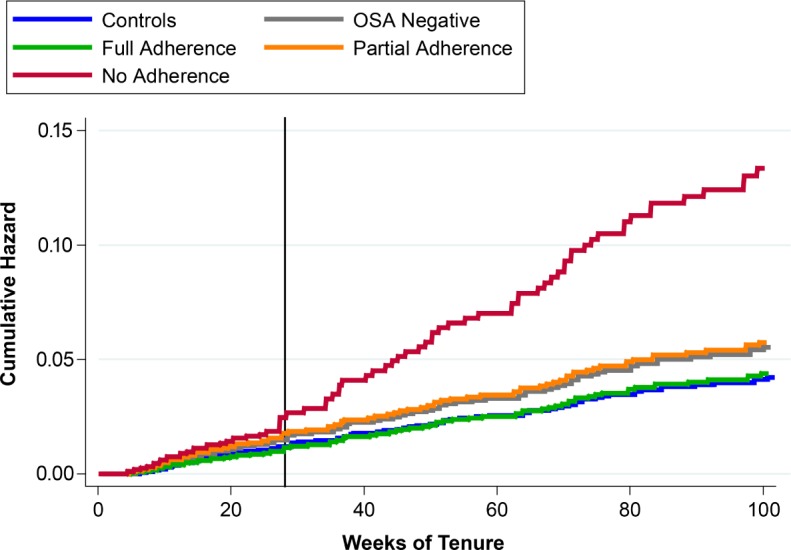
Predicted cumulative hazard of a preventable DOT-reportable crash by study sub-group. The predicted cumulative risk of having a preventable DOT-reportable crash as a function of job tenure. For drivers who were inexperienced-at-hire and had a PSG/ matching date at 26 weeks of tenure, broken out by treatment compliance sub-groups for cases. Predictions are from the first robustness test model, the multivariate Andersen-Gill time-to-crash model on driver-week data.
Effectiveness of the Employer's Program for Removing Nonadherent Drivers
Although study carrier policy required the discharge of drivers failing to adhere to treatment, the process of adherence evaluation and remediation took some time (in some cases several months). As a result, during the study period most No Adherence drivers (57.5%) quit before being discharged. At study end, 68.8% of controls were still employed, as were 73.6% of Full Adherence and 68.6% of Partial Adherence drivers. However, only 17.2% of No Adherence drivers were still employed (these were primarily drivers who received a diagnosis near the end of the study period, and whose remediation process had not been completed; see Figure 3). The proportion of No Adherence drivers retained is different from that of controls, Full Adherence, and Partial Adherence drivers, all at P < 0.001. (For the interested reader, full statistical details, including the complete specification of the multivariate models and the robustness checks employed, are presented in the supplemental material.)
Figure 3.
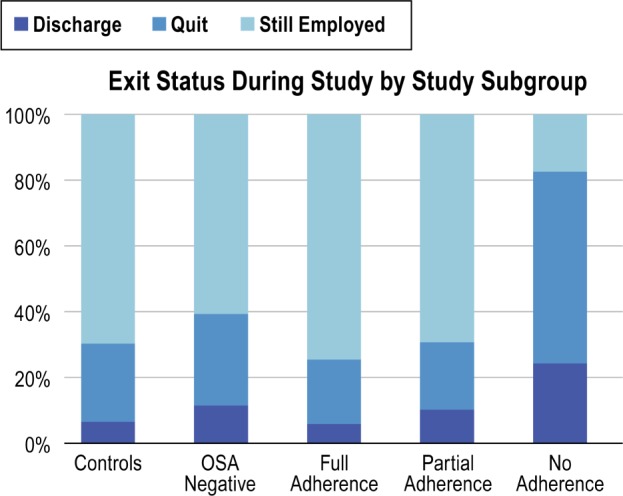
Exit status during study period by study subgroup. Percentage of each subgroup in each status. “Still Employed” drivers remained at work as of the study end date of December 31, 2009. No Adherence drivers who failed in remediation were subject to eventual discharge, but some who received a diagnosis near the end of the study remain employed at study end because their remediation process was still underway. A higher proportion of No Adherence drivers quit than did drivers in other study subgroups (P < 0.001).
DISCUSSION
The Primary Findings are Substantive and Robust
In the largest and most comprehensive study of crash risk and OSA among CMV drivers, drivers in whom OSA was diagnosed and who subsequently drove without PAP treatment due to nonadherence had a fivefold increase in the risk of preventable DOT-reportable heavy truck crashes compared to matched controls. Drivers with OSA who were fully or partially adherent with PAP treatment were statistically similar to controls. These findings for commercial drivers operating tractor-trailers are consistent with previous studies of noncommercial drivers showing a markedly increased crash risk for untreated OSA and crash rates approximating those of controls after successful treatment.9–11
The current study has several advantages over prior work. It is a retrospective analysis of the crash risk of tractor-trailer drivers at the industry's first large-scale mandatory employer-based program to screen and diagnose drivers for OSA, and to require treatment if indicated, covered with no out-of-pocket cost for drivers enrolled in the study firm's voluntary insurance program. OSA was defined using the gold-standard overnight PSG diagnostic procedure.30 Also in contrast to many previous studies, objective quantitative evidence of treatment adherence is used, and internal study firm operational data provides the ability to control for multiple covariates that affect crash risk in week-by-week observational data on driving performance. Moreover, the most policy-relevant type of crashes are analyzed: DOT-reportable crashes that are preventable, thus clearly involving driver behavior as a causal factor, as defined by the guidelines of the National Safety Council.35
The results are robust despite the fact that No Adherence drivers remain employed and under observation at the study firm one-third as long as other groups, which reduced the chance of finding statistically significant results. In three distinct robustness tests, No Adherence drivers have statistically different and substantially higher risk than controls, whereas Partial and Full Adherence drivers are always statistically similar to controls.
First, a multivariate analysis that controlled for differences in demographic and risk exposure characteristics across study groups found Partial and Full Adherence groups similar to controls, and a 3.8-fold increase in risk for the No Adherence group relative to controls. Second, a multivariate reanalysis that used a more stringent threshold of AHI ≥ 15 as the criterion for a diagnosis of OSA (compared to the actual protocol of AHI ≥ 5) found the same pattern, with a 4.7-fold increase in risk for the No Adherence group. Third, a final multivariate reanalysis that changed the outcome variable to “all DOT-reportable crashes” found a similar crash risk pattern across subgroups and controls.
The last result, using all DOT-reportable crashes, suggests the findings are not due to the fact that there are only a modest number of preventable DOT-reportable crashes. In addition, using all DOT-reportable crashes makes the analysis more comparable to studies using governmental crash data, in which all crashes must be included because information on the contribution of driver behavior to crash causation is not available. Thus, it should be noted that although this third reanalysis replicated the pattern of risk comparisons across study groups, it also reduced the estimated excess crash risk for No Adherence drivers by about two-fifths (to 2.2-fold). This is because control drivers experienced a much greater proportion of crashes they could not prevent than did No Adherence drivers, and adding these crashes raised the control driver crash rate used as the basis for the identification of excess risk by much more than it raised the crash rate of the No Adherence subgroup. The fact that the estimated excess crash risk for No Adherence drivers decreased when nonpreventable crashes were added suggests that studies using governmental crash data to compare a test group to controls when the test group has higher risk of preventable crashes may follow the same pattern and thus underestimate the excess crash risk.
Limitations of This Study
The limitations of the current study are different from those of prior work. The existence of a gold standard treatment ethically precludes a clinical trial in which drivers with OSA are randomly assigned to a no-treatment condition in order to study their crash risk (their medical condition and the highway safety of both the drivers and the motoring public would be at risk). In the current study, an actual employer's OSA program is examined using a retrospective cohort of cases and controls.
There may be a significant issue with data from an employer's OSA program in that drivers received a diagnosis only after attaining sufficient tenure. Thus, safety selection, due to the discharge of drivers who accumulated unacceptable preventable crash histories early in their tenure, prevented many of those with relevant crashes from ever being screened for or receiving a diagnosis of OSA. The construction of the retrospective cohort comparison through the randomized matching of each driver with OSA to a control unlikely to have OSA, but who had similar experience at hire and job tenure, makes cases and controls comparable in total experience level, which is important because driving safety performance improves with practice. It also makes them comparable in the degree of exposure to safety selection.
If there were no safety selection, but only the effect of experience on driving safety to be considered, the natural focus for a retrospective study of cases and controls matched on experience would be their crash risk before diagnosis (or matching). This approach would be similar in conception to a “waitlist control” design for the study of an untreated disease: controls without the disease would be compared to individuals with the disease who are observed in an untreated condition while they wait for treatment, which is unable to be provided immediately to all patients, to begin. However, because the firm's safety program does create a safety selection effect, the drivers who had preventable DOT-reportable crashes early in their tenure are missing from both the case and control groups, and thus the potential differences in crash risk across study groups in the period before the diagnosis/matching date have been eliminated. Therefore, our analysis focuses on crash risk in the interval after diagnosis.
The primary limitation of the study is the fact that under a mandated treatment regimen, the division into treatment adherence groups after a positive diagnosis was, of necessity, self-selected and not randomly assigned. Thus, although the known pathophysiologic effects of OSA, and past studies associating untreated OSA (before and after diagnosis) with an increased risk of vehicular accidents, all suggest that the increased crash risk in the after-PSG interval for drivers who do not comply with mandatory treatment may be due to the effects of untreated OSA,9–11 the current study cannot determine the relative contributions of untreated OSA versus factors such as a more general disregard of safety rules that leads to both nonadherence and unsafe driving habits.
Safety and Policy Implications
Although the study limitations preclude us from assigning untreated OSA as the sole cause of the excess crash risk of No Adherence drivers, they do not alter important policy conclusions. This is because the findings provide clear evidence of the effects on safety of the study firm's OSA program.
First, among the study firm's drivers in whom OSA was diagnosed, drivers with OSA who were treatment adherent and had risk comparable to controls were retained in employment at the same level as were controls, whereas nontreatment-adherent OSA-diagnosed drivers who had a fivefold greater serious preventable crash risk than controls were removed (through quitting or mandatory discharge; see Figure 3). Thus, the firm's program to screen and diagnose their drivers, and especially, mandate treatment adherence for drivers found to have OSA, lowered the crash risk in its work force.
Second, the risk differences found among study subgroups are meaningful in terms of managerial and public policy safety concerns. For a fleet of 1,000 drivers each operating 1 year (about 100,000 miles27), the observed crash rates translate to a difference between 70 preventable DOT-reportable crashes for No Adherence drivers and 14 such crashes for both Full Adherence and controls. Thus, No Adherence drivers are substantially more dangerous to themselves and the motoring public.
Third, in the absence of federally mandated procedures other than the currently required self-report during a biennial medical examination, drivers who have diagnosed OSA but are non-adherent with treatment can simply choose to quit working for a motor carrier that knows their diagnosis (as did nearly 60% of those in the current study). They can instead seek employment—without revealing their OSA diagnosis— with a different firm that does not have an OSA program.
The FMCSA has not yet acted on the recommendations of its own Medical Expert Panel (in 2007) and Medical Review Board (in 2008 and 2011), the Motor Carrier Safety Advisory Committee (in 2011), and that of the National Transportation Safety Board (in 2009), that safety regulations should require comprehensive OSA screening and diagnosis of commercial drivers,38,39 in part due to limited commercial driver data. In the context of this record a 2016 National Academies of Science report on commercial driver fatigue cited OSA as a serious safety concern and called for more research. The current study addresses this research need.40 Moreover, our statistical results clearly support specific public health policy-relevant findings: among commercial drivers in whom OSA was diagnosed, drivers with OSA who were treatment-adherent and had risk comparable to controls were more likely to be retained, whereas non-adherent OSA-diagnosed drivers had a fivefold greater preventable crash risk than controls were differentially removed (through quitting or mandatory discharge). Therefore, our results strongly support federal regulations that would mandate OSA screening, diagnosis, and monitoring drivers' treatment adherence for all commercial drivers.
DISCLOSURE STATEMENT
This was not an industry supported study. Dr. Berger is the President of Precision Pulmonary Diagnostics, LLC; PPD has received fees for providing sleep apnea-related services to the study firm, and royalty payments for the use of the Somni-Sage questionnaire. Dr. Czeisler has received consulting fees from or served as a paid member of scientific advisory boards for: Bose Corporation; Boston Red Sox; Cleveland Browns; Institute of Digital Media and Child Development; Merck Sharpe and Dohme; Purdue Pharma; Quest Diagnostics; Samsung Electronics; Teva Pharmaceutical Industries Ltd.; Koninklijke Philips Electronics, N.V.; Novartis; and Vanda Pharmaceuticals, Inc. Dr. Czeisler owns an equity interest in Somnus Therapeutics, Inc. and Vanda Pharmaceuticals, Inc. and received royalties from McGraw Hill, Penguin Press/Houghton Mifflin Harcourt, and from Philips Respironics, Inc. for the Actiwatch - 2 and Actiwatch - Spectrum devices; and has received research/education support from Mary Ann and Stanley Snider through Combined Jewish Philanthropies, National Football League Charities, Optum, ResMed, Philips Respironics and the San Francisco Bar Pilots, Simmons, Schneider, Inc., and Sysco. Dr. Czeisler's interests were reviewed and are managed by Brigham & Women's Hospital and Partners HealthCare in accordance with their conflict of interest policies. The Harvard Medical School Division of Sleep Medicine (HMS/DSM), which Dr. Czeisler directs, has received unrestricted research and educational gifts and endowment funds from: Boehringer Ingelheim Pharmaceuticals, Inc., Cephalon, Inc., GlaxoSmithKline, Jazz Pharmaceuticals, Merck & Co., Inc., Pfizer, ResMed, Philips Respironics, Inc., Sanofi-Aventis, Inc., Sealy, Inc., Sepracor, Inc., Simmons, Spring Aire, Takeda Pharmaceuticals, Tempur-Pedic, Walmart, Proctor and Gamble, Optum and has received Educational Grant funding from Apria Healthcare, Cephalon, Inc., Jazz Pharmaceuticals, Philips Respironics, Takeda Pharmaceuticals, ResMed Foundation, Sanofi-Aventis, Inc., Sepracor, Inc., Teva Pharmaceutical Industries Ltd and Wake Up Narcolepsy. Dr. Czeisler is the incumbent of an endowed professorship provided to Harvard University by Cephalon, Inc. and holds a number of process patents in the field of sleep/circadian rhythms (e.g., photic resetting of the human circadian pacemaker). Since 1985, Dr. Czeisler has also served as an expert witness on various legal cases related to sleep and/or circadian rhythms, including matters related to Bombardier, Citgo, HG Energy, Michael Jackson's mother and children, Purdue Pharma, Stric Lan LLC, Valero and matters related to commercial drivers employed by Celadon, Crete Carrier Corporation, FedEx, United Parcel Service, and other commercial carriers. Dr. Hickman has served as an expert witness on cases involving commercial drivers. Dr. Kales has served as a medicolegal consultant and expert witness on cases involving commercial drivers and has consulted with Circadies. Dr. Malhotra has relinquished all outside personal income since May 2012. The other authors have indicated no financial conflicts of interest.
ACKNOWLEDGMENTS
The authors gratefully acknowledge the assistance of the executives and staff of the study firm, Schneider National, Inc. (SNI) in acquiring operational and medical data utilized, as well as financial assistance to UMM's Truckers & Turnover Project from SNI, the Roadway Safety Institute (the USDOT Region 5 University Transportation Center, which is funded by the USDOT Office of the Assistant Secretary for Research and Technology), the MacArthur Foundation's Research Network on the Origins of Norms and Preferences, the Sloan Foundation, and the University of Minnesota, Morris. The research received support from Harvard Catalyst, The Harvard Clinical and Translational Science Center (NIH Award #UL1 RR 025758, financial contributions from Harvard University and its affiliated academic health care centers), and support from National Surface Transportation Safety Center for Excellence (Project# 12-UI-017). The content is solely the responsibility of the authors and does not necessarily represent the official views of any of the research sponsors.
REFERENCES
- 1.FMCSA & ICF. Regulatory Impact Analysis for Hours of Service Options. 2007 FMCSA-2004-19608-2529. [Google Scholar]
- 2.Akerstedt T. Consensus statement: fatigue and accidents in transport operations. J Sleep Res. 2000;9:395. doi: 10.1046/j.1365-2869.2000.00228.x. [DOI] [PubMed] [Google Scholar]
- 3.FMCSA. Washington, DC: Federal Motor Carrier Safety Administration; 2013. Commercial Motor Vehicle Facts - March 2013. [Google Scholar]
- 4.FMCSA. Washington, DC: Federal Motor Carrier Safety Administration; 2015. Apr, 2015 Pocket Guide to Large Truck and Bus Statistics. [Google Scholar]
- 5.Colten HR, Altevogt BM. Washington, DC: Institute of Medicine Committee on Sleep Medicine Research, National Academies Press; 2006. Sleep disorders and sleep deprivation: an unmet public health problem. [PubMed] [Google Scholar]
- 6.Lal C, Strange C, Bachman D. Neurocognitive impairment in obstructive sleep apnea. Chest. 2012;141:1601–10. doi: 10.1378/chest.11-2214. [DOI] [PubMed] [Google Scholar]
- 7.Naismith S, Winter V, Gotsopoulos H, Hickie I, Cistulli P. Neurobehavioral functioning in obstructive sleep apnea: differential effects of sleep quality, hypoxemia and subjective sleepiness. J Clin Exp Neuropsychol. 2004;26:43–54. doi: 10.1076/jcen.26.1.43.23929. [DOI] [PubMed] [Google Scholar]
- 8.Wong KK, Grunstein RR, Bartlett DJ, Gordon E. Brain function in obstructive sleep apnea: results from the Brain Resource International Database. J Integr Neurosci. 2006;5:111–21. doi: 10.1142/s0219635206001033. [DOI] [PubMed] [Google Scholar]
- 9.Ellen RL, Marshall SC, Palayew M, Molnar FJ, Wilson KG, Man-Son-Hing M. Systematic review of motor vehicle crash risk in persons with sleep apnea. J Clin Sleep Med. 2006;2:193–200. [PubMed] [Google Scholar]
- 10.Tregear S, Reston J, Schoelles K, Phillips B. Obstructive sleep apnea and risk of motor vehicle crash: systematic review and meta-analysis. J Clin Sleep Med. 2009;5:573–81. [PMC free article] [PubMed] [Google Scholar]
- 11.Tregear S, Reston J, Schoelles K, Phillips B. Continuous positive airway pressure reduces risk of motor vehicle crash among drivers with obstructive sleep apnea: systematic review and meta-analysis. Sleep. 2010;33:1373–80. doi: 10.1093/sleep/33.10.1373. [DOI] [PMC free article] [PubMed] [Google Scholar]
- 12.Bureau of Labor Statistics. Occupational Employment and Wages, May 2014: 53-3032 Heavy and Tractor-Trailer Truck Drivers. Occupational Employment Statistics May 2015. [Accessed September 14, 2015]. Available from: http://www.bls.gov/oes/current/oes533032.htm.
- 13.Berger M, Varvarigou V, Rielly A, Czeisler CA, Malhotra A, Kales SN. Employer-mandated sleep apnea screening and diagnosis in commercial drivers. J Occup Environ Med. 2012;54:1017–25. doi: 10.1097/JOM.0b013e3182572e16. [DOI] [PMC free article] [PubMed] [Google Scholar]
- 14.Gurubhagavatula I, Maislin G, Nkwuo JE, Pack AI. Occupational screening for obstructive sleep apnea in commercial drivers. Am J Respir Crit Care Med. 2004;170:371–6. doi: 10.1164/rccm.200307-968OC. [DOI] [PubMed] [Google Scholar]
- 15.Howard ME, Desai AV, Grunstein RR, et al. Sleepiness, sleep-disordered breathing, and accident risk factors in commercial vehicle drivers. Am J Respir Crit Care Med. 2004;170:1014–21. doi: 10.1164/rccm.200312-1782OC. [DOI] [PubMed] [Google Scholar]
- 16.Moreno CR, Carvalho FA, Lorenzi C, et al. High risk for obstructive sleep apnea in truck drivers estimated by the Berlin questionnaire: prevalence and associated factors. Chronobiol Int. 2004;21:871–9. doi: 10.1081/cbi-200036880. [DOI] [PubMed] [Google Scholar]
- 17.Talmage JB, Hudson TB, Hegmann KT, Thiese MS. Consensus criteria for screening commercial drivers for obstructive sleep apnea: evidence of efficacy. J Occup Environ Med. 2008;50:324–9. doi: 10.1097/JOM.0b013e3181617ab8. [DOI] [PubMed] [Google Scholar]
- 18.Parks P, Durand G, Tsismenakis AJ, Vela-Bueno A, Kales S. Screening for obstructive sleep apnea during commercial driver medical examinations. J Occup Environ Med. 2009;51:275–82. doi: 10.1097/jom.0b013e31819eaaa4. [DOI] [PubMed] [Google Scholar]
- 19.Williams JR, Amana A, Tregear S. Washington, DC: Federal Motor Carrier Safety Administration; 2011. Evidence report-obstructive sleep apnea and commercial motor vehicle driver safety: updated review. [Google Scholar]
- 20.Meuleners L, Fraser ML, Govorko MH, Stevenson MR. Obstructive sleep apnea, health-related factors, and long distance heavy vehicle crashes in Western australia: a case control study. J Clin Sleep Med. 2015;11:413–8. doi: 10.5664/jcsm.4594. [DOI] [PMC free article] [PubMed] [Google Scholar]
- 21.Phillips B, Stanton B. Commercial drivers with sleep apnea: it's still hit or miss. J Clin Sleep Med. 2015;11:409–10. doi: 10.5664/jcsm.4590. [DOI] [PMC free article] [PubMed] [Google Scholar]
- 22.Stevenson MR, Elkington J, Sharwood L, et al. The role of sleepiness, sleep disorders, and the work environment on heavy-vehicle crashes in 2 Australian states. Am J Epidemiol. 2014;179:594–601. doi: 10.1093/aje/kwt305. [DOI] [PubMed] [Google Scholar]
- 23. A bill to ensure that any new or revised requirement providing for the screening, testing, or treatment of individuals operating commercial motor vehicles for sleep disorders is adopted pursuant to a rulemaking proceeding. 49 USCA. 113th Congress of the United States of America, 1st Session, 2013.
- 24.Jaillet J. President signs bill forbidding FMCSA to use sleep apnea ‘guidance’. Commercial Carrier Journal - Fleet Management: CCJDigital. 2013 [Google Scholar]
- 25.Editorial Staff. Supplement on Sleep Disorders. ACOEM Commercial Driver Medical Examiner Review. 2014:1–8. [Google Scholar]
- 26.Mabry JE, Hickman J, Hanowski R. Blacksburg, VA: Virginia Tech Transportation Institute; 2012. Case Study on the Impact of Treating Sleep Apnea in Commercial Motor Vehicle Drivers--Sleep Apnea Programs from Two Leading U.S. Carriers and Focus Group Findings. [Google Scholar]
- 27.Burks SV, Belzer M, Kwan Q, Pratt S, Shackelford S. Transportation Research Circular Number E-C146. Washington, DC: Transportation Research Board; 2010. Trucking 101: an industry primer. [Google Scholar]
- 28.Epstein LJ, Kristo D, Strollo PJ, Jr., et al. Clinical guideline for the evaluation, management and long-term care of obstructive sleep apnea in adults. J Clin Sleep Med. 2009;5:263–76. [PMC free article] [PubMed] [Google Scholar]
- 29.Transport Topics. March 20, 2006: Driver Turnover Rate at Large Truckload Carriers Rises to 136% [Accesssed August 8, 2013]. Available from: http://www.ttnews.com/articles/basetemplate.aspx?storyid=15004.
- 30.Burks SV, Carpenter J, Götte L, Rustichini A. Cognitive skills affect economic preferences, social awareness, and job attachment. Proc Natl Acad Sci. 2009;106:7745–50. doi: 10.1073/pnas.0812360106. [DOI] [PMC free article] [PubMed] [Google Scholar]
- 31.Guest M, Boggess MM, Duke JM. Age related annual crash incidence rate ratios in professional drivers of heavy goods vehicles. Transportation Research: Part A: Policy and Practice. 2014;65:1–8. [Google Scholar]
- 32.Rodriguez DA, Targa F, Belzer MH. Pay incentives and truck driver safety: a case study. Industrial and Labor Relations Review. 2006;59:205–25. [Google Scholar]
- 33.Arrighi HM, Hertz-Picciotto I. The evolving concept of the healthy worker survivor effect. Epidemiology. 1994;5:189–96. doi: 10.1097/00001648-199403000-00009. [DOI] [PubMed] [Google Scholar]
- 34.Kribbs NB, Pack AI, Kline LR, et al. Objective measurement of patterns of nasal CPAP use by patients with obstructive sleep apnea. Am Rev Respir Dis. 1993;147:887–95. doi: 10.1164/ajrccm/147.4.887. [DOI] [PubMed] [Google Scholar]
- 35.NSC Staff, 2011. Itasca, IL: National Safety Council; Guide to Determine Motor Vehicle Collision Preventability. [Google Scholar]
- 36.Therneau TM, Grambsch PM. New York, NY: Springer; 2000. Modeling survival data: extending the cox model. [Google Scholar]
- 37.American Academy of Sleep Medicine. Fact Sheet: Obstructive Sleep Apnea. [Accessed January 10, 2016]. Available from: http://www.aasmnet.org/resources/factsheets/sleepapnea.pdf.
- 38.FMCSA. Summary-Federal Motor Carrier Safety Administration Medical Review Board Meeting. [Accessed February 24, 2010]. Available from: http://www.mrb.fmcsa.dot.gov/documents/Final_Meeting_Revised_Updated_93008.pdf.
- 39.Hersman DAP, Hart CA, Sumwalt RL. Washington, DC: National Transportation Safety Board; 2009. Safety Recommendations H-09-015 &-016 to the Federal Motor Carrier Safety Administration Regarding Obstructive Sleep Apnea in Commercial Drivers. [Google Scholar]
- 40.Panel on Research Methodologies and Statistical Approaches to Understanding Driver Fatigue Factors in Motor Carrier Safety and Driver Health. Washington, DC: National Academies Press; 2016. Commercial Motor Vehicle Driver Fatigue, Long-Term Health, and Highway Safety: Research Needs. [PubMed] [Google Scholar]
Associated Data
This section collects any data citations, data availability statements, or supplementary materials included in this article.