

Summary
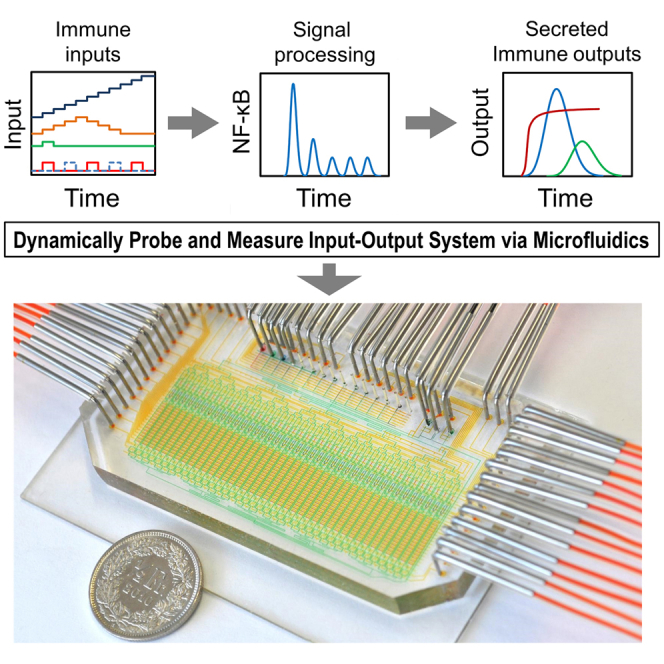
Cells receive time-varying signals from the environment and generate functional responses by secreting their own signaling molecules. Characterizing dynamic input-output relationships in single cells is crucial for understanding and modeling cellular systems. We developed an automated microfluidic system that delivers precisely defined dynamical inputs to individual living cells and simultaneously measures key immune parameters dynamically. Our system combines nanoliter immunoassays, microfluidic input generation, and time-lapse microscopy, enabling study of previously untestable aspects of immunity by measuring time-dependent cytokine secretion and transcription factor activity from single cells stimulated with dynamic inflammatory inputs. Employing this system to analyze macrophage signal processing under pathogen inputs, we found that the dynamics of TNF secretion are highly heterogeneous and surprisingly uncorrelated with the dynamics of NF-κB, the transcription factor controlling TNF production. Computational modeling of the LPS/TLR4 pathway shows that post-transcriptional regulation by TRIF is a key determinant of noisy and uncorrelated TNF secretion dynamics in single macrophages.
Keywords: single-cell analysis, dynamics, cytokine, NF-κB, microfluidic, input
Graphical Abstract
Highlights
-
•
Dynamic stimulation of single immune cells with a versatile microfluidic device
-
•
Coupled longitudinal measurements of NF-κB localization and TNF secretion on the same cell
-
•
Single-cell harvesting, staining, and mRNA quantification on the same device
-
•
High-content dataset, and modeling of TRIF-based noise in TNF secretion
Junkin et al. have developed a method to quantitatively probe single-cell input-output dynamics with an automated microfluidic system. They conduct coupled measurements of transcription factor and cytokine secretion dynamics from the same single cells to enable modeling, which uncovers dynamic and noise-based roles of TRIF in the NF-κB-TNF pathway.
Introduction
Immune cells must coordinate their activity at multiple timescales and mount a finely tuned protective response while avoiding tissue damage. A plethora of signaling molecules, regulatory pathways, and network motifs are employed to distinguish self from foreign and calculate intensity and duration of the immune response. Cells receive time-varying inputs such as changing local concentrations of pathogen or stress-related molecules, utilize pathway dynamics to process signals (Ashall et al., 2009, Batchelor et al., 2009, Nelson et al., 2004, Lahav et al., 2004, Tomida et al., 2012, Kellogg and Tay, 2015, Kellogg et al., 2015), and generate functional dynamic outputs by secreting their own signaling molecules. Dynamic environmental inputs can induce resonant transcriptional dynamics and synergize with intrinsic noise to amplify immune outputs (Kellogg and Tay, 2015). Characterizing such dynamic input-output relationships aids in understanding regulatory mechanisms underlying immunity, enables systems-level modeling to predict outcomes of complex physiological scenarios (Covert et al., 2005, Lipniacki et al., 2004, Lee et al., 2009, Cheong et al., 2006), and would significantly aid drug research and therapeutics (Behar et al., 2013, Cohen et al., 2008).
Understanding and modeling the immune system requires detailed multiparameter and quantitative analysis of its components. Major obstacles in this endeavor are the constantly changing nature of reactions (dynamics), broad timescales of processes from fast (milliseconds) to very slow (days), and ever-present biological noise (Tay et al., 2010, Lahav et al., 2004, Elowitz et al., 2002). Such dynamic variability makes time-dependent quantitative single-cell analysis crucial to understanding how biological systems operate. Measuring of multiple immune regulatory components is thus necessary to gain understanding of dynamic immune functions. Among these are transcription factor (TF) families such as NF-κB, IRFs, STATs, and SMADs that process inflammatory inputs to exercise global control on gene expression (Doupé and Perrimon, 2014, Batchelor et al., 2009, Nathan, 1987, Delgoffe et al., 2011). Live-cell fluorescent microscopy of TF dynamics has recently led to a paradigm change in the understanding of dynamic cell signaling, gene regulation (Nelson et al., 2004, Lee et al., 2009, Lahav et al., 2004, Spencer et al., 2009, Elowitz et al., 2002, Vedel et al., 2013, Lee and Covert, 2010), and contributions of noise (Kellogg and Tay, 2015) to signal processing. Signaling dynamics can influence transcriptional responses as seen with the activation dependence of the master immune regulatory NF-κB pathway upon input frequency (Ashall et al., 2009), or tolerize its response due to repeated pathway activation (Biswas and Lopez-Collazo, 2009). Single-cell NF-κB activation to an increasing cytokine input has also been found to be a digital process with a high degree of cell-to-cell variability (Tay et al., 2010). Dynamic observation at the single-cell level was the enabling factor to such findings, as bulk analysis would have implied uniform and graded responses, and hence false understanding of underlying regulatory processes.
Key output parameters in resulting immune responses include cytokines, whose temporal secretion patterns exercise vital roles to guide immunity. The inflammatory phenotype of macrophages, for example, depends on prior exposure to native cytokines (Schroder et al., 2006) and can switch based upon progression of local signals (Arnold et al., 2007). A complex local milieu of cytokine inputs contributes to ongoing pathogenesis in cancer (Franklin et al., 2014, Escobar et al., 2014), inflammatory bowel disease (Zhang and Mosser, 2008), arthritis (Kinne et al., 2000), and sepsis (Bosmann and Ward, 2013). In such misregulated cases, the subtle balance of protection versus damage is lost and the immune system induces injury. Accordingly, there is much interest in characterizing the role of cytokine dynamics for design of future therapies and to develop predictive models of the immune system (Hotchkiss et al., 2013). Traditional dish-and-pipette investigation of these regulatory components using techniques such as western blotting, intracellular staining, or enzyme-linked immunospot (ELISPOT) suffer from the drawbacks of being typically single time point (static) measurements and generating semiquantitative data at best. Cells are usually lost post-assay, preventing their further genetic analysis or expansion in culture, and signaling activity can furthermore not be monitored in real time. Additional limitations remain for single-cell analysis, which has mainly consisted of static, low-throughput, and semiquantitative methods due to the technical challenges in isolating, manipulating, and measuring individual cells. Despite recent developments in cytokine secretion assays (Han et al., 2012, Fan et al., 2008), significant technical advances in dynamic input generation, cell manipulation, automation, measurement precision, and multiparameter integration are needed for complete and careful characterization of immune dynamics at the single-cell level.
To enable a multi-functional quantitative single-cell analysis platform that overcomes these limitations, we have designed a microfluidic device that stimulates single live cells dynamically and simultaneously analyzes multiple dynamic immune parameters in a non-destructive manner. High-density integration of microfluidic membrane valves, multiplexing, and computerized control allow the generation of precisely defined and highly complex biochemical inputs, controlling the type, dose, and time course of signaling input molecules delivered to single cells cultured in isolation. Using thousands of on-chip nanoliter immunoassays, this system measures the concentrations of single-cell secreted cytokines at different times, allowing absolute quantification of the rate and time course of cytokine secretion under time-varying inputs. Furthermore, the internal signaling state of the same cells is simultaneously interrogated by measurements of transcription factors via time-lapse microscopy or on-chip staining, and live cells can be retrieved from our system for further gene expression analysis or clonal expansion. These devices and associated protocols are fully automated, allowing for precisely defined long-term and complex time courses of stimulations and measurements on single cells (Gómez-Sjöberg et al., 2007, Junkin and Tay, 2014, Mehling and Tay, 2014, Bao et al., 2010, Lecault et al., 2011).
Such joint measurements of single-cell transcription factor dynamics and cytokine secretion in the same cells under complex immune inputs were not possible prior to this work. Using our system, we analyzed single-macrophage signal processing under dynamic pathogen inputs and found that TNF secretion is highly heterogeneous and surprisingly uncorrelated with the dynamics of NF-κB, the transcription factor controlling TNF production. Computational analysis of the LPS/TLR4 signaling pathway showed that post-transcriptional regulation by TRIF underlies the noisy and uncorrelated TNF secretion dynamics. As demonstrated with this study, the methods developed here will open up experimentation of heretofore intractable cellular dynamics of cellular systems at the single-cell level and thus lead to increased understanding and modeling of dynamic immune input-output relationships.
Results
Microfluidic Device for Dynamic Cytokine Measurements under Complex Inputs
A two-layer polydimethylsiloxane (PDMS) microfluidic chip (Melin and Quake, 2007, Kellogg et al., 2014) was designed (Figures 1 and S1), which cultures single cells inside 40 isolated 1.35-nl chambers under the control of an automated culture and measurement system. The device utilizes thousands of PDMS membrane valves to trap and maintain single live cells inside completely isolated chambers while providing dynamic stimulations and non-destructively measuring parameters including transcription factor activation, cytokine secretion, position, and morphology. The microfluidic device is mounted on an automated stage of an inverted epifluorescence microscope placed inside an enclosure, which controls temperature, humidity, and gas composition for mammalian cell culture (Figure 1B).
Figure 1.

Automated Microfluidic System for Multiparameter Analysis of Single-Cell Immune Dynamics
(A) Top left: microfluidic device with functional areas indicated. The scale bar represents 5 mm. Middle right: close-up of a single functional column. The arrows show medium movement during sampling (solid) and circulation for mixing during binding (dashed). Right: close-ups showing a cell captured inside a culture chamber (red), a binding chamber (blue) with a retained bead, and beads inside storage chambers (red). Bottom left: fluorescent imaging of NF-κB activation (top row). The arrow shows the activated cell (RelA in nucleus), and the scale bar represents 20 μm. Middle row: phase contrast images. Bottom row: brightfield-fluorescence merged images of beads. The red spot in the third panel indicates fluorescent sandwich immune assay detection of secreted protein.
(B) Setup of microfluidic device mounted on automated microscope inside atmospheric enclosure and image of control software interface.
(C) Operation of secretion assay. Beads are initially loaded into storage chambers and then moved by direction of control software to binding chamber. There they are exposed to medium coming from cells through peristaltic pumping. Once analyte is mixed and bound, beads are rinsed and moved back to original storage chambers. This process is repeated with a new bead for different time points so that each row corresponds to a specific time point.
See also Figure S1.
Capture and Culture of Isolated Single Cells
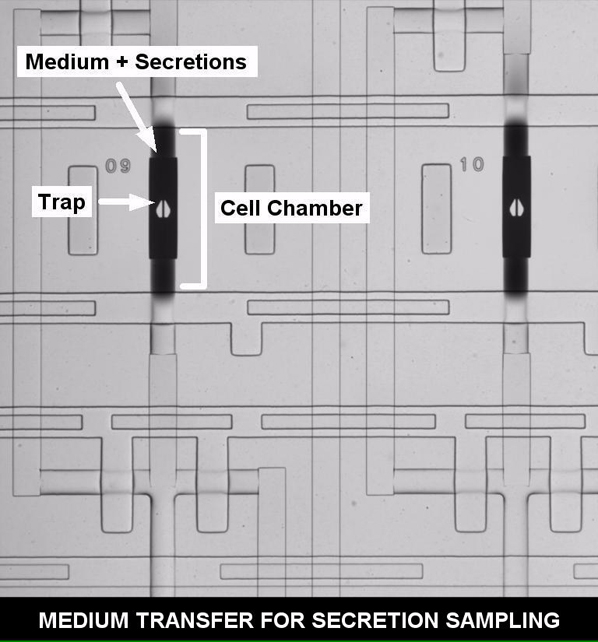
Cells in suspension are introduced into the chip through inlets and directed to cell capture chambers using a binary mutliplexer controlled by membrane valves. PDMS traps for both suspension and adherent cells were developed to select single cells that had a high efficiency and were compact enough to fit inside a small nanoliter-sized chamber (Figure 1A; Movie S1). The design for adherent cells is based on a narrow (4 μm) slit upon which cells impinge when driven by fluid flow. The trap has sloping sides to deflect additional cells, ensuring only single cells remain trapped. By selecting for appropriate loading densities (typically 105 cells ml−1), isolation efficiencies of 80%–100% single cells per chamber are achieved. The trap is placed in the center of an isolated culture chamber that was previously coated with fibronectin, which induces the trapped cell to adhere. Post-attachment cells can be washed, fed, and stimulated at later times without cell loss (Figure S2). The design for non-adherent cells consists of a weir type trap with slits that blocks particles without a bypass (Figure S2). This allows suspended cells to be likewise washed (Movie S7), stimulated, and have medium harvested for subsequent assays while retaining cells (Figure S3). This type of trap is also amenable for isolation of rare cell samples as it can capture low numbers of cells without allowing cell loss by trap bypass. Importantly, the individual cell chambers are entirely isolated from one another, preventing contamination from neighboring cells (Figure 1). Long-term culture of single cells isolated inside the device required stricter control of several system parameters, compared to non-single-cell microfluidic culture. Principle among these is maintenance of a sufficiently high humidity level to which isolated single cells were observed to be more sensitive (Figure S4). Additionally, extensive rinsing of the anti-adhesive (Pluronic F-127, Invitrogen) used to prevent undesired adhesion of assay components away from cell chambers was necessary. Once seeded, the cells were sealed in the PDMS chamber by membrane valves and were then intermittently fed by pumping fresh culture medium inside the chamber. These improved protocols and careful control of the environment allowed reliable culture of single isolated mammalian cells in the 1.35-nl PDMS chambers for up to several days without loss of cell viability (Figure S4).
Automated Generation of Dynamic and Complex Signaling Inputs
By use of 16 reagent inlets controlled by automated membrane valves, coupled with the on-chip peristaltic pump and binary multiplexer, combinations of the inputs can be injected into any cell chamber at a desired time. This allows stimulation of cells with precise doses of combinatorial and time-varying signal input profiles. Temporally, input signals to cells can be switched within ∼5 s (Movie S2), allowing rapidly increasing or decreasing concentrations of signaling molecules to be generated, as well as transient (single-pulse) signals or pulse trains. Furthermore, the delivery of multiple signals with precise control allows intricate signal histories comprised of pro- and anti-inflammatory inputs and pathogenic molecules normally present during an immune reaction to be explored (Figure S5). This input generation capability enables creation of physiologically relevant dynamic signaling environments with a wide array of possible parameters.
Single-Cell Cytokine Secretion Measurements under Complex Inputs
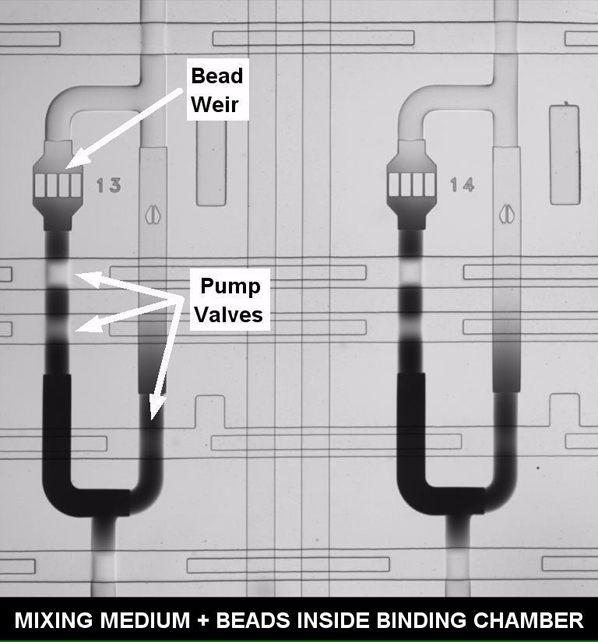
Measurement of single-cell secreted molecules is achieved by conducting on-chip bead-based fluorescent sandwich immunoassays upon the medium surrounding a cell. Prior to experiments, antibody functionalized beads are loaded into a series of storage chambers located in the lower half of the chip (Figure 1). Beads are retained during loading by 4-μm PDMS slits (Movie S3). When needed, they are moved via an on-chip peristaltic pump into a binding chamber (Figure 1C; Figure S1; Movie S3). During a measurement, the medium surrounding a cell is pumped into the binding chamber (Movie S4). The medium and beads are then sealed in the chamber to prevent loss of secreted molecules and are mixed by circular pumping that moves the secreted molecules over bead surfaces for efficient capture (Movies S5 and S6). After sufficient mixing for binding (Figure 2A), the chamber and beads are then rinsed and the beads are moved back to their holding areas. On-chip rinsing was critical in obtaining reproducible cytokine concentration measurements as it removes possible interfering molecules and excess antibodies between assay steps. Once all time point measurements have been conducted, detection antibodies for the sandwich assay are provided (Figure S1). When the entire assay is complete, beads are imaged and their fluorescent intensity is correlated to a calibration curve to calculate the number of cytokines released by a cell (Figure 2B). Calibrations are conducted on the chip, under identical conditions of temperature, humidity, and surface functionalization to account for factors such as affinity and cytokine diffusion present during measurements. Additionally, when multiple cytokine-specific beads are used together in a given chamber, multiplexed detection of cytokines from a single cell is possible (Figure 3A). This automated system allowed a 2-hr resolution for quantifying the concentration of single-cell secreted cytokines after stimulation with time-varying inflammatory molecules. The chip can additionally be reloaded with new beads after initial measurements to extend the measurement period if necessary.
Figure 2.

On-Chip Bead Assay for Cytokine Secretion Measurement
(A) Determination of needed mixing time. The capture of TNF on the bead surface with mixing inside a binding chamber is depicted. TNF was incubated with beads while undergoing mixing for different times before rinsing and completion of sandwich assay. Steady state is reached only after 2 hr of mixing.
(B) On-chip calibration curve of TNF capture with bead-based sandwich assay. The detection limit was taken as three times the SD of negative control measurements (LOD ∼60,000 TNF molecules). Error bars are the standard error of the means.
(C) Modeling the effect of mixing on assay performance. Random walk model simulated proportion of cytokines bound to bead surface after 1.5 hr inside a 2D channel. Curves show the effect of varying the diffusion coefficient, D, for TNF and for mixing.
(D) Images from model depicting the benefit of mixing inside a 1000 × 100 μm chamber. Top images show a chamber where only diffusion is present. The area adjacent to the bead becomes depleted of cytokines (black dots) as they bind to the bead (red dot) over 1.5 hr, resulting in low capture efficiency. The lower images depict the channel when mixing is present. The rapid mixing achieved when medium is circularly pumped inside the binding chamber enables faster binding. Numbers in brackets indicate percentages of cytokine bound to bead.
See also the Supplemental Experimental Procedures (“Random walk model for protein diffusion and capture”).
Figure 3.

Multiplexed Endpoint Measurements of Single Cells
(A) Multiplexed detection of cytokine release. Measuring 2 hr of secretion of the indicated cytokines in response to continuous exposure to 500 ng ml−1 LPS is shown. The Inset shows the multiple bead types loaded into the binding chamber, The scale bar represents 50 μm.
(B) On-chip staining. Single 3T3 cells were isolated inside chambers, cultured, then fixed and stained on the chip for actin (red). Cells additionally possessed a nuclear marker (H2B-GFP). The scale bar represents 50 μm.
(C) Single-cell harvesting from chip and clonal expansion. Images show initial single-cell harvesting into a 96-well plate on (day 1) and subsequent expansion (day 10) of a 3T3 fibroblast previously isolated and cultured inside the microfluidic device.
(D) Single-cell gene expression for cells isolated, cultured on, and harvested from the microfluidic device. The data are the absolute copy number of Gapdh for KL-25 hybridoma cells (left) and CD147 for Jurkat cells (right), measured with digital PCR. Bulk measurements are shown as round dots. Error bars are the SD of bulk measurements. Lower figures show binned data and fits to gamma distributions.
See also Supplemental Information.
Development of this specific assay method took into account the diffusion time, binding, and geometric properties of the bead-channel-antibody system. When medium is sampled, it travels from the cell chamber into a larger chamber so that no fluid is lost during transfer. A random walk model of cytokine mass transport and capture was developed to characterize this configuration and to maximize both the throughput and ability to capture soluble molecules onto beads (Supplemental Information). The simulation emphasized the necessity of active mixing, which greatly reduces the time needed to bind the cytokines present inside the mixing chamber and reach steady state (Figures 2C and 2D). The presence of active mixing allowed for increased capture and reduced incubation time (Movie S5).
Endpoint Measurements of Single Cells: On-Chip Immunostaining, Harvesting for Clonal Expansion, and Gene Expression
Endpoint measurements can be also undertaken with the device to complement the non-destructive dynamic analysis and further increase available measurement space. Single cells may be stained on the chip for key proteins in an automated manner (Figure 3B) or be harvested via flowing out of the chip. Single-cell harvesting either allows for expansion of these cells (Figure 3C), which enables a number of uses such as enriching for certain populations, or allows for directly analyzing gene expression of single cells (Figure 3D). These capabilities allow coupling single-cell transcription factor activation and protein secretion with diverse endpoint analyses in conjunction with a known, well-defined signaling environment. This facilitates understanding immune input-output relationships in true multiple parameter and interconnected contexts.
Automated Live Cell Culture and Microscopy
The system monitors single cells by periodic observation of multiple readouts of immune reactions (imaging resolution ∼6 min). Brightfield or phase mode imaging monitors migration, cell size, and morphology and is simultaneously coupled with imaging in multiple fluorescent channels. Fluorescent detection entails imaging fusion proteins introduced into the cells that, for current experiments, reported on activation of the master immune transcription factor NF-κB as well as a nuclear tag (Wall et al., 2009). Imaging and positioning are under control of microscope software (Nikon), while fluidic control of the microfluidic system is directed by way of custom GUI-based MATLAB code (Gómez-Sjöberg et al., 2007, Kellogg et al., 2014) (Figure 1B). This software guides all chip-level functions involved in single-cell stimulation and cytokine measurements by opening and closing PDMS membrane valves to supply components to cell and measurement chambers (Unger et al., 2000). Fully programmable control of fluidic flow enables multiday administration of well-defined, complex temporal inputs, such as short pulses, pulse trains, sinusoidal inputs, monotonically increasing or decreasing concentrations, or alternating signaling molecules with a pre-determined sequence creating a broad input space, and significantly reduces manual labor and the possibility of human error. The diverse input space together with the dynamic and non-destructive measurements when guided by automation provide a capable system with functional properties relevant to explore single-cell immune dynamics under complex signaling inputs (Figure S6).
Quantification of Single Macrophages under Dynamic Inputs Reveals Highly Variable TNF Secretion Dynamics
Quantification of the macrophage input-output system was undertaken by supplying cells with a series of dynamic immune stimulatory scenarios. Beads custom functionalized to capture TNF molecules were loaded into the chip, and single mouse macrophages (RAW 264.7) were then seeded into the 40 cell chambers as described. Prior to stimulation, baseline measurements of TNF secretion were conducted by supplying medium without any stimulant to provide insight to the cell state before stimulus. Cells were then stimulated with various dynamic inputs, and every 2 hr the surrounding medium was transferred to binding chambers and mixed with beads for the first part of the sandwich assay. Cells were not serum starved before or during stimulations. The dynamical single-cell data gathered are shown in Figure 4A, including recording of single-cell TNF secretion, transcription factor activity (nuclear localization of NF-κB), morphology, and cell migration.
Figure 4.

High-Content Profiling of Single-Cell Responses to Dynamic Immune Inputs
(A) Top: fluorescence and brightfield image series of a single cell over the course of LPS stimulation experiment. The scale bar represents 20 μm. Bottom: corresponding data from this cell for NF-κB (RelA) activity, TNF secretion, morphology, and migration responses are shown. LPS stimulation depicted by the tan bar was 500 ng ml−1 for 2 hr.
(B) RelA translocation and TNF secretion for distinct LPS input dynamics. The single 2-hr pulse of LPS (left), continuous LPS exposure (center), and 8-min pulses of LPS every 2 hr (right) are shown. The bars above heatmaps depict stimulation profiles, and scale bars depict normalized nuclear RelA and molecules of TNF. Continuous stimulation leads to significantly increased cell-to-cell variability and oscillatory dynamics in TNF secretion compared to transient or pulsed stimulation. RelA is normalized to initial nuclear fluorescence intensity of each cell prior to stimulation.
The temporal interactions of signal dynamics with macrophage cellular process dynamics were explored by supplying a range of signal exposures while single-cell transcription factor activity and secretion were measured. Signals consisted of bacterial lipopolysaccharide (LPS, 500 ng ml−1) provided to RAW macrophages in exposures including a single pulse, repeated pulses (a pulse-train), and continuous exposure, over the course of 20 hr. These inputs were designed to simulate brief, repeated, and chronic exposure to bacteria, respectively. NF-κB (RelA) and TNF (Parameswaran and Patial, 2010) secretion data for these experiments are shown in Figure 4B.
Multiparameter Analysis of Single Immune Cells Reveals Poorly Correlated NF-κB and TNF Secretion Dynamics
Single-cell responses (NF-κB translocation, TNF secretion, migration, cell morphology) in all LPS exposure experiments were heterogeneous, and certain subsets of reaction phenotypes could be identified. Figure 5A shows the NF-κB (RelA) response of cells exposed to a 2-hr pulse of LPS. At least four distinct sub-populations were observed in this scenario: those possessing a single NF-κB peak, a single peak followed by a later rise, a single peak and subsequent oscillations, and those that did not respond or only minimally responded to the LPS. TNF secretion could likewise be grouped into subsets with different temporal characteristics in response to LPS (Figure 5B). These consisted of cells that released a single, temporally limited pulse of TNF (within 2 hr), those that released TNF for an extended period (within 4 hr), those that released TNF with other types of profiles such as multi-peak secretion, and those cells that did not release TNF in response to LPS. These subsets were similarly observed when LPS was preceded by 2 hr of IL-10 (20 ng ml−1) (Millipore, IL020) (Figure S7), and similar secretion subsets are observed with other LPS input dynamics. The amount of total TNF produced over 14 hr in response to a 2-hr LPS input is shown in Figure 5C. This followed a skewed distribution with a mean of 4.9 × 10⁶ TNF molecules released, but several cells secreted much higher amounts. These results are typical of the types of dynamic responses exhibited by macrophages and taken in the context of the range of temporal inputs supplied to macrophages shows the dynamic signal processing functionalities of these single cells.
Figure 5.

Heterogeneity in Single-Cell Immune Dynamics
(A and B) NF-κB (RelA) (A) and TNF secretion (B) in response to 2 hr of LPS (500 ng ml−1). The graphs depict whole population and subpopulation responses from top to bottom, respectively.
(C) Total secretion over the course of the entire experiment (14 hr). The line is log-normal fit to data. Data in (B) and (C) are combined from two repeat experiments.
The subsets of cell migration types detected showed that movement remained at a constant low level, was high independent of stimulation, or changed from a low level to a high level post-exposure to LPS (Figure S7). This was mirrored in the length and area data as well where certain portions of cells also displayed an increase in their length or area due to the LPS stimulation (Figure S7).
Examination of single-cell NF-κB and TNF secretion dynamics together, a measurement not possible prior to the current work, showed a lack of correlation between the relative amplitude of the two (see below), although NF-κB is known to be a key transcription factor responsible for TNF expression (Sung et al., 2014). This suggests the importance of other cell processes present in macrophages, which operate heterogeneously in response to LPS exposure.
Computational Modeling of the LPS-TLR4 Pathway Reveals a Key Role for TRIF in Controlling TNF Secretion Dynamics and Variability
The observed TNF release by single cells displays a heterogeneous and dynamic immune secretory response to pathogenic input. Although NF-κB activation and TNF secretion were qualitatively correlated (Figure 6A), considering their amplitudes quantitatively revealed no correlation (Pearson correlation r = −0.06; Figure 6B). To understand mechanisms of the observed TNF release profiles and understand why NF-κB activation and TNF secretion showed so little correlation, we undertook computational modeling of the kinetic interplay of mechanisms controlling not only TNF mRNA synthesis but also mRNA processing and half-life control, translation to TNF pro-protein, protein maturation, and secretion (Caldwell et al., 2014, Cheng et al., 2015, Werner et al., 2005).
Figure 6.

Relationship between NF-κB and TNF Secretion Recapitulated by a Mathematical Model of the Mechanisms Governing NF-κB Activation and TNF Production
(A) A table cross-correlating, qualitatively, nuclear NF-κB activation and TNF secretion. Cells with a NF-κB peak during LPS stimulation greater than baseline NF-κB level by 2 SDs are categorized as NF-κB+. Other cells are categorized as NF-κB−. Cells with a measured TNF peak larger than 5% of maximum measured TNF in the whole population are defined as TNF+; others are categorized as TNF−.
(B) Quantitative cross-correlation (by Pearson coefficient) between the magnitude of observed NF-κB peak values with observed TNF release peaks.
(C) The modified Caldwell et al. (2014) model to simulate LPS pulse induced TNF secretion at the single-cell level. Extrinsic noise was added by sampling key kinetic parameters from gamma distributions as in Cheng et al. (2015).
(D) Model predictions of active TRIF, nuclear NF-κB, and secreted TNF dynamics in 500 single cells, with red lines showing mean behavior. Simulated secretion profiles agree well with the measured single-cell TNF secretion time courses.
(E) The model simulations indicate that, qualitatively, NF-κB positivity (NF-κB+) correlates better to TNF positivity (TNF+) than TRIF positivity (TRIF+). Many cells categorized as TRIF− may produce TNF above the detectable level.
(F) The model simulations indicate that TNF peak magnitude is not quantitatively correlated (by Pearson coefficient) to nuclear NF-κB peak magnitude but is quantitatively correlated to peak TRIF values.
To this end we modified the established and iteratively refined mathematical model (Figure 6C) (Caldwell et al., 2014, Werner et al., 2005, Cheng et al., 2015). We modeled cell-to-cell variability by introducing extrinsic noise using distributions of key kinetic parameters as in Cheng et al. (2015) (see Supplemental Information), which then renders it capable to study dynamics of NF-κB and TNF secretion at a single-cell level. We focused simulations on the 2-hr pulse condition (mimicking brief pathogen exposure) and ran 500 single-cell simulations (Figure 6D) with this formulation. The result shows highly variable NF-κB, TRIF activity, and TNF secretion between individual cells (Figure 6D). In these simulations, we found that considering cells merely qualitatively as being either NF-κB or TNF positive or negative shows that NF-κB positivity is indeed a good predictor of TNF positivity (Figure 6E). However, evaluating the relative amplitudes quantitatively, we found that the simulations also show no correlation between NF-κB activity level and the amount of secreted TNF (Figure 6F), matching experimental observations. Moreover, our model suggested a strong correlation of TRIF activity with the TNF secretion (Figure 6F). TRIF was shown to play key roles in post-transcriptional regulation of TNF expression, such as mRNA half-life control, regulation of translation, pro-protein processing, and secretion, whereas Myd88 is responsible for the early phase of TNF transcription. Our work provides a mechanistic understanding of the mechanisms underlying cell-to-cell variable TNF production as well as the underlying noise sources and suggests means to both modulate noise and verify drivers of the observed TNF signaling due to dynamic inputs.
Discussion
Cells exist in dynamic environments whose complex signals result in heterogeneous, time-varying responses (Kellogg and Tay, 2015, Kellogg et al., 2015). The single-cell microfluidic analysis system we developed addresses these crucial aspects in several ways. First, the system exerts dynamic control over the signaling environment of a single cell, with an input time resolution as fast as a few seconds while also supplying these inputs over a long enough timeframe of several days, to allow the observation of the full course of the single-cell response. Key to this function is system automation, which allows otherwise complicated input and measurement profiles to be specified. This enables the creation of inputs with timescales, compositions, and durations not possible with conventional manual control that is limited by speed, reliability, and even feasibility over continuous multiday experimentation. Second, single-cell measurements were conducted dynamically with multiple readouts. This provided time-dependent data on interacting cellular subsystems whose interrelations govern immune reactions. Moreover, time course measurements were non-destructive, which preserved the signaling history of each cell. Signaling history is a major driver of heterogeneity and cell fate decisions during immunity. Maintaining live cells also allowed for more thorough characterization by measuring baseline functions prior to initiating an immune response and detecting functions post-stimulation and to repeated stimuli. Lastly, temporal data gathering could be coupled with specific endpoint measurements in the form of staining and single-cell gene expression like digital PCR that further expand possible analysis from the integrated platform.
This system was employed to gather multiparameter data from single macrophages under dynamically modulated LPS stimulation as a means to explore input-output functioning of innate immune sensing. This provided measurements of NF-κB activation in fully isolated single cells where all interactions with neighboring cells were excluded, and it comprises a unique set of coupled cytokine and NF-κB dynamics on the same single cells. These combined dynamic measurements demonstrated several interesting observations at the single-cell level. Distinct sub-populations were observed for NF-κB and TNF secretion dynamics in all scenarios. These demonstrated the heterogeneity simultaneously present across multiple cell subsystems and displayed the need for single-cell observation and analysis to fully characterize and understand system regulation. A computational model fitted with our data helped interpret the observed lack of correlation between TNF secretion and its master regulator NF-κB and highlighted the role of the adaptor TRIF in creating uncorrelated and highly variable TNF output at the single-cell level. Interpreting such system behavior from pooled (population averaged) data would have obfuscated behavioral subsets present in the population. Taken together, these observations point to the inherent simultaneous presence of dynamically modulated heterogeneity across multiple cell pathways. The presence of heterogeneity or noise and its roles are still largely unknown in many mammalian cell systems, especially within dynamic signaling contexts. Previous efforts in this area have similarly seen dynamic signaling noise and identified an increase in transcriptional control under a dynamic input (Kellogg and Tay, 2015, Kellogg et al., 2015) as well as a modification of noise over time via soluble signaling (Patil et al., 2015). These observations highlight that the presence of noise itself in conjunction with a dynamic environment must be accounted for when attempting to understand how a system regulates its responses.
The approach described herein is broadly amenable for understanding signaling relationships including roles of noise and dynamics of a wide range of cellular systems as it is capable of measuring any number of secreted molecules and fusion proteins non-destructively from single cells without a need for system modification. It can furthermore incorporate other endpoint assays such as digital PCR or sequencing, as single cells can be harvested from our microfluidic devices. The demonstrated increase in parameter space and measurement accuracy is beneficial for providing parameters upon which to base computational models (Tay et al., 2010). Additionally relevant is that the system can measure an input parameter space that is orders of magnitude larger than typical single-cell assays. The system can provide multiple stimulation components, supplied at different doses of arbitrary pulse lengths, and frequencies to create a high number of possible input variations to effectively address the little explored dynamic multiparameter components of cellular signaling and signal processing. Finally the system is amenable to use with a diverse range of cell types from adherent cell lines to non-adherent cells, giving it broad potential to study a wide variety of immune questions. The combined capabilities developed for the present system are, crucially, not present together in existing microfluidic methods for investigating signaling at the single-cell level. While temporal multiparameter outputs can be measured by well-based assays (Love et al., 2006, Fitzgerald et al., 2015), dynamic multiparameter inputs cannot be supplied to temporally investigate input space. Similarly, output measurement is limited to a single time point in other methods (Fan et al., 2008, Chokkalingam et al., 2013, Wu et al., 2012) or relies on fixation of multiple different cell populations (Blazek et al., 2015, Ng et al., 2015), thereby hindering investigating output dynamics and history on the same cells over time. Several current methods are also destructive, which further precludes the possibility of cell retrieval post assay. Many methods by their nature are not amenable to detecting internal cellular parameters with high-resolution imaging and so cannot couple the governing internal process to observed signaling outputs. Still other methods lack absolute quantification of secreted molecules, challenging interpretation and modeling (Chokkalingam et al., 2013, Raphael et al., 2013, Shirasaki et al., 2014). Thus, the current system presents a uniquely integrated platform that will provide the necessary, comprehensive, and multiplexed information to enable characterizing input-output functions to realize predictive models of biological systems within noisy and dynamic contexts. This detailed understanding will aid in exploring new areas to gain both basic insights into cell regulation mechanisms and to uncover important therapeutic potentials related to input dynamics and heterogeneity.
Experimental Procedures
Single-Cell Cytokine Assays
To conduct on-chip assays, microfluidic chips are first prepared by coating all internal chip surfaces except cell chambers with Pluronic F-127 (Life Technologies, P6867) dissolved in deionized water at 2 mg ml−1 to reduce protein absorption and adherence of cells and beads. The chips are then extensively rinsed overnight with PBS via a control script, before cell chambers are coated with fibronectin (Millipore, FC010) dissolved at 200 μg ml−1 in PBS for at least 5 hr to promote cell attachment. Chips are then rinsed with CO2 equilibrated medium, and bead storage chambers are loaded with one bead each per individual cytokine to be assayed. Cells are then detached from T75 culture dishes with versene (Life Technologies, 15040-033), filtered through a 20-μm filter (CellTrics, 04-004-2325) to remove clumps, and suspended at 1 × 10⁵– 3.5 × 10⁵ cells ml−1 for introduction into the chips. Cells are individually flowed into cell chambers until visual confirmation of cell capture. Loading of all cell traps is usually achieved in less than 10 min. Once loaded with cells, the complete operation of fluidic control and imaging is automatic and does not require operator input. MATLAB control scripts are available upon request.
Components for Cytokine Detection via Immunosandwich Assays
TNF is detected using 10.3-μm diameter streptavidin functionalized beads obtained from Spherotech (SVP-100-4). A biotinylated antibody (United States Biological, T9160-14) was attached to the surface of these beads in PBS adjusted to pH 5.5. TNF for calibrations was obtained from Life Technologies (PMC3014) and aliquoted in PBS containing 1 mg ml−1 BSA. These aliquots were dissolved in normal macrophage medium for calibrations. The detection antibody was obtained from genwaybio (GWB-489500) and was used at a concentration of 3.19 μg ml−1. The fluorescent secondary antibody was obtained from United States Biological (I1903-12H) and was used at a concentration of 3.3 μg ml−1. Between assay steps, beads were washed with PBS-Tween (0.563 mg ml−1). TNF binding to beads took place over 90 min with mixing by on-chip pumps, whereas rinsing and antibody steps each took place over 30 min with mixing. Sandwich assays with commercial bead kits (BD Biosciences, 552364, 560232, and 558345) used during multiplexed cytokine detection relied on the provided PE tagged secondary antibodies and manufacturer protocols. Detailed protocols are available upon request.
Assay Components for Cellular Stimulation
Components for cellular stimulations included LPS obtained from Sigma Aldrich (L4524), IL-6 obtained from Sigma Aldrich (I9646), IL-10 from Millipore (IL020), IL-1β from Life Technologies (PMC0814), IFN-γ from Ebioscience (14-8311-63), Pam3CSK4 from Invivogen (tlrl-pms), and flagellin obtained from Invivogen (tlrl-pstfla).
Imaging and Environmental Control
Microfluidic devices are mounted on an automated stage of an inverted microscope (Nikon Eclipse Ti) placed inside an enclosure (Life Imaging Services) that is temperature, humidity, and gas composition controlled for mammalian cell culture (Figure 1B). Temperature is maintained for the whole microscope while inlet gas flow rate, CO2 percentage, and humidity are under active control inside a small stage top incubator fitted directly over the microfluidic device. The parameters for this stage cover that were found to be optimal for culturing of single cells were a CO2 level of 5%, a flow rate of 25–30 l/hr, and a relative humidity level set to 100%. Imaging of the microfluidic chip during operation is accomplished via the supplied microscope software (NIS-Elements AR 4.20.01) that spatially moves and images the chip in multiple color channels and is completely separate from that of the fluidic and environmental control systems. Code and scripts for fluidic control are available upon request.
Single-Cell mRNA Measurement
Single cells were harvested from microfluidic chips by automatically timing the fluidic flow directed to each chamber in series to yield 3.95 μl of sample. Collected volumes were either harvested via tubing or pipetted upon exit from a cut made in the chip. Harvesting buffer consisted of 5 nM K2HPO4 (Sigma P3786) to which was added 5 nM KH2PO4 (Sigma-Aldrich P0662) until a pH of 7.2 was reached. Samples were placed inside RNase-free Eppendorf tubes containing 1 μl lysis buffer before freezing on dry ice and storage at −80°C until further processing. Lysis buffer consisted of (by volume) 10% TM buffer (Biochain K3011010-1), 5% RNase OUT (Life Technologies 10777-019), 2% protease inhibitor (Biochain K3011010-2), and 83% cell resuspension buffer (Life Technologies 4405377). Once thawed, 1 μl random primer solution was added to the tubes (Promega C118B) and they were incubated for 5 min at 70°C. 4.05 μl reverse transcriptase solution was then added and samples were thermocycled for reverse transcription (5 min 25°C, 60 min 42°C, 15 min 70°C, hold at 4°C). All RT components were from the Promega GoScript Reverse Transcription System (A5001) kit and the RT solution consisted of (by volume) 44.4% GoScript 5X Reaction Buffer, 11.1% GoScript Reverse Transcriptase, 11.1% PCR Nucleotide Mix, 5.6% Recombinant RNasin Ribonuclease Inhibitor, and 27.8% MgCl2. Upon completion of RT, 10 μl PCR master mix (Bio-Rad 2x ddPCR Supper Mix 290-10420) and 1 μl TaqMan probes (Life Technologies Mm99999915_g1 for Gapdh and Hs00174305_m1 for CD147) were added before samples were formed into droplets using Bio-Rad droplet generation oil (186-3005) and a Bio-Rad QX100 Droplet Generator. After PCR thermocycling (10 min 95°C, 40 cycles of 30 s 94°C, and 1 min 60°C, then 10 min 98°C and a final hold at 4°C) droplets were read via a (QX100 Bio-Rad Droplet Reader) and analyzed with the corresponding QuantaSoft program. Bulk RNA extractions were conducted with QIAGEN RNeasy Mini Kit (74104) per instructions from the manufacturer and processed in the same manner as single-cell samples.
Author Contributions
M.J. fabricated the devices and performed the simulations, experiments, and analysis. A.J.K. assisted with experimentation and data analysis. Z.C. and A.H. performed modeling and analysis. C.J. and C.A. assisted with mRNA analysis. S.T. supervised the study. All authors contributed to the writing of the manuscript.
Acknowledgments
The authors would like to thank Dr. Thomas Horn at the ETH Zürich Single Cell Facility for assistance with microscopy. This work is supported by an ERC Starting Grant (SingleCellDynamics), Schweizerischer Nationalfonds, and a SystemsX research grant to S.T.
Published: March 31, 2016
Footnotes
Supplemental Information includes Supplemental Experimental Procedures, seven figures, and seven movies and can be found with this article online at http://dx.doi.org/10.1016/j.celrep.2016.03.033.
Supplemental Information
References
- Arnold L., Henry A., Poron F., Baba-Amer Y., van Rooijen N., Plonquet A., Gherardi R.K., Chazaud B. Inflammatory monocytes recruited after skeletal muscle injury switch into antiinflammatory macrophages to support myogenesis. J. Exp. Med. 2007;204:1057–1069. doi: 10.1084/jem.20070075. [DOI] [PMC free article] [PubMed] [Google Scholar]
- Ashall L., Horton C.A., Nelson D.E., Paszek P., Harper C.V., Sillitoe K., Ryan S., Spiller D.G., Unitt J.F., Broomhead D.S. Pulsatile stimulation determines timing and specificity of NF-kappaB-dependent transcription. Science. 2009;324:242–246. doi: 10.1126/science.1164860. [DOI] [PMC free article] [PubMed] [Google Scholar]
- Bao X.R., Fraser I.D.C., Wall E.A., Quake S.R., Simon M.I. Variability in G-protein-coupled signaling studied with microfluidic devices. Biophys. J. 2010;99:2414–2422. doi: 10.1016/j.bpj.2010.08.043. [DOI] [PMC free article] [PubMed] [Google Scholar]
- Batchelor E., Loewer A., Lahav G. The ups and downs of p53: understanding protein dynamics in single cells. Nat. Rev. Cancer. 2009;9:371–377. doi: 10.1038/nrc2604. [DOI] [PMC free article] [PubMed] [Google Scholar]
- Behar M., Barken D., Werner S.L., Hoffmann A. The dynamics of signaling as a pharmacological target. Cell. 2013;155:448–461. doi: 10.1016/j.cell.2013.09.018. [DOI] [PMC free article] [PubMed] [Google Scholar]
- Biswas S.K., Lopez-Collazo E. Endotoxin tolerance: new mechanisms, molecules and clinical significance. Trends Immunol. 2009;30:475–487. doi: 10.1016/j.it.2009.07.009. [DOI] [PubMed] [Google Scholar]
- Blazek M., Santisteban T.S., Zengerle R., Meier M. Analysis of fast protein phosphorylation kinetics in single cells on a microfluidic chip. Lab Chip. 2015;15:726–734. doi: 10.1039/c4lc00797b. [DOI] [PubMed] [Google Scholar]
- Bosmann M., Ward P.A. The inflammatory response in sepsis. Trends Immunol. 2013;34:129–136. doi: 10.1016/j.it.2012.09.004. [DOI] [PMC free article] [PubMed] [Google Scholar]
- Caldwell A.B., Cheng Z., Vargas J.D., Birnbaum H.A., Hoffmann A. Network dynamics determine the autocrine and paracrine signaling functions of TNF. Genes Dev. 2014;28:2120–2133. doi: 10.1101/gad.244749.114. [DOI] [PMC free article] [PubMed] [Google Scholar]
- Cheng Z., Taylor B., Ourthiague D.R., Hoffmann A. Distinct single-cell signaling characteristics are conferred by the MyD88 and TRIF pathways during TLR4 activation. Sci. Signal. 2015;8:ra69. doi: 10.1126/scisignal.aaa5208. [DOI] [PMC free article] [PubMed] [Google Scholar]
- Cheong R., Bergmann A., Werner S.L., Regal J., Hoffmann A., Levchenko A. Transient IkappaB kinase activity mediates temporal NF-kappaB dynamics in response to a wide range of tumor necrosis factor-α doses. J. Biol. Chem. 2006;281:2945–2950. doi: 10.1074/jbc.M510085200. [DOI] [PubMed] [Google Scholar]
- Chokkalingam V., Tel J., Wimmers F., Liu X., Semenov S., Thiele J., Figdor C.G., Huck W.T.S. Probing cellular heterogeneity in cytokine-secreting immune cells using droplet-based microfluidics. Lab Chip. 2013;13:4740–4744. doi: 10.1039/c3lc50945a. [DOI] [PubMed] [Google Scholar]
- Cohen A.A., Geva-Zatorsky N., Eden E., Frenkel-Morgenstern M., Issaeva I., Sigal A., Milo R., Cohen-Saidon C., Liron Y., Kam Z. Dynamic proteomics of individual cancer cells in response to a drug. Science. 2008;322:1511–1516. doi: 10.1126/science.1160165. [DOI] [PubMed] [Google Scholar]
- Covert M.W., Leung T.H., Gaston J.E., Baltimore D. Achieving stability of lipopolysaccharide-induced NF-kappaB activation. Science. 2005;309:1854–1857. doi: 10.1126/science.1112304. [DOI] [PubMed] [Google Scholar]
- Delgoffe G.M., Murray P.J., Vignali D.A.A. Interpreting mixed signals: the cell’s cytokine conundrum. Curr. Opin. Immunol. 2011;23:632–638. doi: 10.1016/j.coi.2011.07.013. [DOI] [PMC free article] [PubMed] [Google Scholar]
- Doupé D.P., Perrimon N. Visualizing and manipulating temporal signaling dynamics with fluorescence-based tools. Sci. Signal. 2014;7:re1. doi: 10.1126/scisignal.2005077. [DOI] [PMC free article] [PubMed] [Google Scholar]
- Elowitz M.B., Levine A.J., Siggia E.D., Swain P.S. Stochastic gene expression in a single cell. Science. 2002;297:1183–1186. doi: 10.1126/science.1070919. [DOI] [PubMed] [Google Scholar]
- Escobar G., Moi D., Ranghetti A., Ozkal-Baydin P., Squadrito M.L., Kajaste-Rudnitski A., Bondanza A., Gentner B., De Palma M., Mazzieri R., Naldini L. Genetic engineering of hematopoiesis for targeted IFN-α delivery inhibits breast cancer progression. Sci. Transl. Med. 2014;6:217ra3. doi: 10.1126/scitranslmed.3006353. [DOI] [PubMed] [Google Scholar]
- Fan R., Vermesh O., Srivastava A., Yen B.K.H., Qin L., Ahmad H., Kwong G.A., Liu C.-C., Gould J., Hood L., Heath J.R. Integrated barcode chips for rapid, multiplexed analysis of proteins in microliter quantities of blood. Nat. Biotechnol. 2008;26:1373–1378. doi: 10.1038/nbt.1507. [DOI] [PMC free article] [PubMed] [Google Scholar]
- Fitzgerald V., Manning B., O’Donnell B., O’Reilly B., O’Sullivan D., O’Kennedy R., Leonard P. Exploiting highly ordered subnanoliter volume microcapillaries as microtools for the analysis of antibody producing cells. Anal. Chem. 2015;87:997–1003. doi: 10.1021/ac503547j. [DOI] [PubMed] [Google Scholar]
- Franklin R.A., Liao W., Sarkar A., Kim M.V., Bivona M.R., Liu K., Pamer E.G., Li M.O. The cellular and molecular origin of tumor-associated macrophages. Science. 2014;344:921–925. doi: 10.1126/science.1252510. [DOI] [PMC free article] [PubMed] [Google Scholar]
- Gómez-Sjöberg R., Leyrat A.A., Pirone D.M., Chen C.S., Quake S.R. Versatile, fully automated, microfluidic cell culture system. Anal. Chem. 2007;79:8557–8563. doi: 10.1021/ac071311w. [DOI] [PubMed] [Google Scholar]
- Han Q., Bagheri N., Bradshaw E.M., Hafler D.A., Lauffenburger D.A., Love J.C. Polyfunctional responses by human T cells result from sequential release of cytokines. Proc. Natl. Acad. Sci. USA. 2012;109:1607–1612. doi: 10.1073/pnas.1117194109. [DOI] [PMC free article] [PubMed] [Google Scholar]
- Hotchkiss R.S., Monneret G., Payen D. Sepsis-induced immunosuppression: from cellular dysfunctions to immunotherapy. Nat. Rev. Immunol. 2013;13:862–874. doi: 10.1038/nri3552. [DOI] [PMC free article] [PubMed] [Google Scholar]
- Junkin M., Tay S. Microfluidic single-cell analysis for systems immunology. Lab Chip. 2014;14:1246–1260. doi: 10.1039/c3lc51182k. [DOI] [PubMed] [Google Scholar]
- Kellogg R.A., Tay S. Noise facilitates transcriptional control under dynamic inputs. Cell. 2015;160:381–392. doi: 10.1016/j.cell.2015.01.013. [DOI] [PubMed] [Google Scholar]
- Kellogg R.A., Gómez-Sjöberg R., Leyrat A.A., Tay S. High-throughput microfluidic single-cell analysis pipeline for studies of signaling dynamics. Nat. Protoc. 2014;9:1713–1726. doi: 10.1038/nprot.2014.120. [DOI] [PubMed] [Google Scholar]
- Kellogg R.A., Tian C., Lipniacki T., Quake S.R., Tay S. Digital signaling decouples activation probability and population heterogeneity. eLife. 2015;4:e08931. doi: 10.7554/eLife.08931. [DOI] [PMC free article] [PubMed] [Google Scholar]
- Kinne R.W., Bräuer R., Stuhlmüller B., Palombo-Kinne E., Burmester G.-R. Macrophages in rheumatoid arthritis. Arthritis Res. 2000;2:189–202. doi: 10.1186/ar86. [DOI] [PMC free article] [PubMed] [Google Scholar]
- Lahav G., Rosenfeld N., Sigal A., Geva-Zatorsky N., Levine A.J., Elowitz M.B., Alon U. Dynamics of the p53-Mdm2 feedback loop in individual cells. Nat. Genet. 2004;36:147–150. doi: 10.1038/ng1293. [DOI] [PubMed] [Google Scholar]
- Lecault V., Vaninsberghe M., Sekulovic S., Knapp D.J.H.F., Wohrer S., Bowden W., Viel F., McLaughlin T., Jarandehei A., Miller M. High-throughput analysis of single hematopoietic stem cell proliferation in microfluidic cell culture arrays. Nat. Methods. 2011;8:581–586. doi: 10.1038/nmeth.1614. [DOI] [PubMed] [Google Scholar]
- Lee T.K., Covert M.W. High-throughput, single-cell NF-κB dynamics. Curr. Opin. Genet. Dev. 2010;20:677–683. doi: 10.1016/j.gde.2010.08.005. [DOI] [PMC free article] [PubMed] [Google Scholar]
- Lee T.K., Denny E.M., Sanghvi J.C., Gaston J.E., Maynard N.D., Hughey J.J., Covert M.W. A noisy paracrine signal determines the cellular NF-kappaB response to lipopolysaccharide. Sci. Signal. 2009;2:ra65. doi: 10.1126/scisignal.2000599. [DOI] [PMC free article] [PubMed] [Google Scholar]
- Lipniacki T., Paszek P., Brasier A.R., Luxon B., Kimmel M. Mathematical model of NF-kappaB regulatory module. J. Theor. Biol. 2004;228:195–215. doi: 10.1016/j.jtbi.2004.01.001. [DOI] [PubMed] [Google Scholar]
- Love J.C., Ronan J.L., Grotenbreg G.M., van der Veen A.G., Ploegh H.L. A microengraving method for rapid selection of single cells producing antigen-specific antibodies. Nat. Biotechnol. 2006;24:703–707. doi: 10.1038/nbt1210. [DOI] [PubMed] [Google Scholar]
- Mehling M., Tay S. Microfluidic cell culture. Curr. Opin. Biotechnol. 2014;25:95–102. doi: 10.1016/j.copbio.2013.10.005. [DOI] [PubMed] [Google Scholar]
- Melin J., Quake S.R. Microfluidic large-scale integration: the evolution of design rules for biological automation. Annu. Rev. Biophys. Biomol. Struct. 2007;36:213–231. doi: 10.1146/annurev.biophys.36.040306.132646. [DOI] [PubMed] [Google Scholar]
- Nathan C.F. Secretory products of macrophages. J. Clin. Invest. 1987;79:319–326. doi: 10.1172/JCI112815. [DOI] [PMC free article] [PubMed] [Google Scholar]
- Nelson D.E., Ihekwaba A.E.C., Elliott M., Johnson J.R., Gibney C.A., Foreman B.E., Nelson G., See V., Horton C.A., Spiller D.G. Oscillations in NF-kappaB signaling control the dynamics of gene expression. Science. 2004;306:704–708. doi: 10.1126/science.1099962. [DOI] [PubMed] [Google Scholar]
- Ng A.H.C., Dean Chamberlain M., Situ H., Lee V., Wheeler A.R. Digital microfluidic immunocytochemistry in single cells. Nat. Commun. 2015;6:7513. doi: 10.1038/ncomms8513. [DOI] [PMC free article] [PubMed] [Google Scholar]
- Parameswaran N., Patial S. Tumor necrosis factor-α signaling in macrophages. Crit. Rev. Eukaryot. Gene Expr. 2010;20:87–103. doi: 10.1615/critreveukargeneexpr.v20.i2.10. [DOI] [PMC free article] [PubMed] [Google Scholar]
- Patil S., Fribourg M., Ge Y., Batish M., Tyagi S., Hayot F., Sealfon S.C. Single-cell analysis shows that paracrine signaling by first responder cells shapes the interferon-β response to viral infection. Sci. Signal. 2015;8:ra16. doi: 10.1126/scisignal.2005728. [DOI] [PubMed] [Google Scholar]
- Raphael M.P., Christodoulides J.A., Delehanty J.B., Long J.P., Byers J.M. Quantitative imaging of protein secretions from single cells in real time. Biophys. J. 2013;105:602–608. doi: 10.1016/j.bpj.2013.06.022. [DOI] [PMC free article] [PubMed] [Google Scholar]
- Schroder K., Sweet M.J., Hume D.A. Signal integration between IFNgamma and TLR signalling pathways in macrophages. Immunobiology. 2006;211:511–524. doi: 10.1016/j.imbio.2006.05.007. [DOI] [PubMed] [Google Scholar]
- Shirasaki Y., Yamagishi M., Suzuki N., Izawa K., Nakahara A., Mizuno J., Shoji S., Heike T., Harada Y., Nishikomori R., Ohara O. Real-time single-cell imaging of protein secretion. Sci. Rep. 2014;4:4736. doi: 10.1038/srep04736. [DOI] [PMC free article] [PubMed] [Google Scholar]
- Spencer S.L., Gaudet S., Albeck J.G., Burke J.M., Sorger P.K. Non-genetic origins of cell-to-cell variability in TRAIL-induced apoptosis. Nature. 2009;459:428–432. doi: 10.1038/nature08012. [DOI] [PMC free article] [PubMed] [Google Scholar]
- Sung M.-H., Li N., Lao Q., Gottschalk R.A., Hager G.L., Fraser I.D. Switching of the relative dominance between feedback mechanisms in lipopolysaccharide-induced NF-κB signaling. Sci. Signal. 2014;7:ra6. doi: 10.1126/scisignal.2004764. [DOI] [PMC free article] [PubMed] [Google Scholar]
- Tay S., Hughey J.J., Lee T.K., Lipniacki T., Quake S.R., Covert M.W. Single-cell NF-kappaB dynamics reveal digital activation and analogue information processing. Nature. 2010;466:267–271. doi: 10.1038/nature09145. [DOI] [PMC free article] [PubMed] [Google Scholar]
- Tomida T., Oda S., Takekawa M., Iino Y., Saito H. The temporal pattern of stimulation determines the extent and duration of MAPK activation in a Caenorhabditis elegans sensory neuron. Sci. Signal. 2012;5:ra76. doi: 10.1126/scisignal.2002983. [DOI] [PubMed] [Google Scholar]
- Unger M.A., Chou H.-P., Thorsen T., Scherer A., Quake S.R. Monolithic microfabricated valves and pumps by multilayer soft lithography. Science. 2000;288:113–116. doi: 10.1126/science.288.5463.113. [DOI] [PubMed] [Google Scholar]
- Vedel S., Tay S., Johnston D.M., Bruus H., Quake S.R. Migration of cells in a social context. Proc. Natl. Acad. Sci. USA. 2013;110:129–134. doi: 10.1073/pnas.1204291110. [DOI] [PMC free article] [PubMed] [Google Scholar]
- Wall E.A., Zavzavadjian J.R., Chang M.S., Randhawa B., Zhu X., Hsueh R.C., Liu J., Driver A., Bao X.R., Sternweis P.C. Suppression of LPS-induced TNF-alpha production in macrophages by cAMP is mediated by PKA-AKAP95-p105. Sci. Signal. 2009;2:ra28. doi: 10.1126/scisignal.2000202. [DOI] [PMC free article] [PubMed] [Google Scholar]
- Werner S.L., Barken D., Hoffmann A. Stimulus specificity of gene expression programs determined by temporal control of IKK activity. Science. 2005;309:1857–1861. doi: 10.1126/science.1113319. [DOI] [PubMed] [Google Scholar]
- Wu M., Perroud T.D., Srivastava N., Branda C.S., Sale K.L., Carson B.D., Patel K.D., Branda S.S., Singh A.K. Microfluidically-unified cell culture, sample preparation, imaging and flow cytometry for measurement of cell signaling pathways with single cell resolution. Lab Chip. 2012;12:2823–2831. doi: 10.1039/c2lc40344g. [DOI] [PubMed] [Google Scholar]
- Zhang X., Mosser D.M. Macrophage activation by endogenous danger signals. J. Pathol. 2008;214:161–178. doi: 10.1002/path.2284. [DOI] [PMC free article] [PubMed] [Google Scholar]
Associated Data
This section collects any data citations, data availability statements, or supplementary materials included in this article.