Abstract
Introduction
Higher AHA cardiovascular health score (CVHS) predicts lower incidence of cardiovascular disease (CVD). However, the relationship of CVHS attainment through mid- to late-life with CVD prevalence and cardiovascular structure and function in late life is not well described.
Methods and Results
The following six ideal CV health metrics were assessed in Atherosclerosis Risk in Communities (ARIC) study participants at five examination visits between 1987 and 2013: nonsmoking, body mass index <25 kg/m2, untreated total cholesterol <200 mg/dL, untreated blood pressure <120/<80 mmHg, fasting blood glucose <100 mg/dL, and ideal physical activity. Attainment over time was assessed as the percent of maximum possible CVHS metrics achieved at Visits 1 though 5, the slope of change in CVHS per decade of follow-up, and CVHS trajectory through follow-up. At Visit 5, participant groups were characterized with respect to CVD prevalence (n = 6,520) and echo measures of cardiac structure and function (n= 5,903 free of CV disease). CVHS was low at baseline and declined with age. Both greater CVHS attainment, and improvement in CVHS during follow-up, were associated with a lower prevalence of CVD and better LV structure, systolic and diastolic function at Visit 5.
Conclusions
Greater attainment of, and improvements in, ideal CV health through mid- to late-life are associated with lower CVD prevalence and better cardiovascular structure and function when elderly. These findings highlight the importance of consistent primordial and primary prevention efforts throughout mid- to late-life as a potential intervention to decrease the burden of CVD among the elderly.
Keywords: echocardiography, epidemiology, aging, risk factors, cardiovascular diseases
Introduction
Modifiable risk factors over the life course are powerful contributors to the population burden of cardiovascular disease. In 2010, the American Heart Association Strategic Planning Task Force and Statistics Committee identified seven metrics of ideal cardiovascular health, including four health behaviors (nonsmoking, body mass index <25 kg/m2, physical activity, and ideal diet) and three health factors (untreated total cholesterol <200 mg/dL, untreated blood pressure <120/<80 mmHg, and fasting blood glucose <100 mg/dL), to target for the primary prevention of cardiovascular disease.1 The attainment of these ideal CV health metrics is associated with a reduced incidence of cardiovascular disease.2 Attainment of ideal CV health metrics is also associated with a lower incidence of subsequent HF, which is common, morbid, and predominantly affects the elderly.3,4 Epidemiologic studies suggest that these risk factors account for over three-fourths of heart failure cases (population attributable fraction 77-89%).5 HF risk factors also are known to influence cardiac structure, systolic function, diastolic function, and arterial stiffness. However, little data exists regarding the impact of attaining ideal CV health metrics through mid-life (approximately 45 to 65 years of age) and late-life (older than 65 years of age) on cardiovascular structure and function in the elderly. Furthermore, whether changes in the status of ideal CV health metrics through mid- to late-life impact cardiovascular structure and function in the elderly is not known but may have important implications for preventive care in the elderly.
Based on the American Heart Association goals, we created a cardiovascular health score (CVHS) at each of the five ARIC visits, and used this score to test the hypothesis that the greater attainment of ideal cardiovascular health metrics through mid- to late-life is associated with better cardiovascular health in late-life, reflected in measures of cardiac structure, LV systolic and diastolic function, arterial stiffness, and soluble biomarkers of myocardial stress and injury. Furthermore, we hypothesized that improvement in CVHS through mid- to late-life will be associated with better cardiovascular structure and function when elderly. To address these questions, we used data on cardiovascular risk factors, phenotype, and outcomes collected over more than 25 years in the largely biracial community dwelling Atherosclerosis Risk in Communities (ARIC) cohort study.
Methods
Study Population
ARIC is a prospective epidemiologic cohort study whose design and methods have been previous described.6 Between 1987 and 1989, 15,792 individuals aged 45-64 years were enrolled in 4 communities in the United States: Forsyth County, NC, Jackson, MS, suburban Minneapolis, MN, and Washington County, MD. Cohort participants underwent four exam visits between 1987 and 1998. Between 2011 and 2013, 6,538 participants (now aged 67-91 years) returned for a fifth study visit which included standardized anthropometrics, interviewer-administered questionnaires, and laboratory testing including fasting lipid panel, blood glucose, and cardiac biomarker assessment, comprehensive echocardiography, and vascular assessment by carotid-femoral pulse wave velocity and ankle-brachial index. The study protocol was approved by institutional review boards at each field center, and all participants provided written informed consent.
Definition of Ideal CV Health Metrics
Measurements of physical activity, body mass index, smoking, total cholesterol, seated blood pressure after a 5 minute rest, and fasting glucose were assessed at study visits 1 through 5 and classified as ideal, intermediate, or poor as detailed in Table 1.2 All missing values were imputed to be “intermediate” status, except in the event in which status was known at both the visits immediately before and after the visit in question. If “poor” status was observed at both neighboring visits, then “poor” status was imputed at the missing visit. Similarly, if “ideal” status was observed at both neighboring visits, then “ideal” status was imputed at the missing visit. Physical activity was only assessed at Visits 1, 3, and 5. Status of the physical activity metric at Visits 2 and 4 was assigned the lowest value from the two shouldering measurements. Healthy diet, which is one of the proposed ideal CV health metrics, was not included in the CVHS due to lack of adequate serial data on diet. Similar to prior reports,5 ideal CV health attainment was quantified as the percent of ideal health obtained, which was derived by generating a score with each metric assigned 0, 1, or 2 points for poor, intermediate, or ideal health status respectively. This was done for health metrics at Visits 1 through 5 and these points were summed. The percent of ideal health score attained was calculated as the summed points divided by the maximum number of possible points. To characterize the change in CVHS over time, we also determined the slope of change in CVHS per decade of follow-up for each study participant.
Table 1.
Definition of Ideal CV Health Metrics.
| Metric | Status | Definition |
|---|---|---|
| Smoking | Ideal | Never or quit >12 months |
| Intermediate | Former ≤12 months | |
| Poor | Current | |
| Body mass index | Ideal | <25 kg/m2 |
| Intermediate | 25-29.9 kg/m2 | |
| Poor | ≥30 kg/m2 | |
| Physical Activity | Ideal | ≥150 min/week moderate, or ≥75 min/week vigorous, or ≥150 min/week moderate+vigorous |
| Intermediate | 1-149 min/week moderate, or 1-74 min/week vigorous, or 1-149 min/week moderate+vigorous | |
| Poor | None | |
| Total Cholesterol | Ideal | <200 mg/dl without medications |
| Intermediate | 200-239 or treated to <200 mg/dl | |
| Poor | ≥240 mg/dl | |
| Blood pressure | Ideal | <120/<80 mmHg without medications |
| Intermediate | SBP 120-139 or DBP 80-89 or treated to <120/<80 mmHg | |
| Poor | SBP ≥140 or DBP ≥90 mmHg | |
| Fasting serum glucose | Ideal | <100 mg/dl without medication |
| Intermediate | 100-125 mg/dl or treated to <100 mg/dl | |
| Poor | ≥126 mg/dl |
Adapted from Folsom et al2
Clinical Events
ARIC participants undergo surveillance for incident coronary heart disease (CHD) events (fatal CHD, definite or probable MI, or coronary revascularization) and all-cause mortality as previously described in detail.7 Surveillance for HF was based on hospitalization ICD codes prior to 20058 with additional central adjudication since 2005 as previously described,9 and was also assessed by self-report at Visits 3-5 and on annual follow-up phone calls. In this analysis, prevalent HF at Visit 5 was defined as (1) an adjudicated HF hospitalization since 2005 (2) hospitalization with a HF ICD code prior to 2005, and (3) among those without a prior hospitalization, self-report of HF or treatment for HF with at least one of the following: (a) subsequent confirmation of self-report by treating physician or the participant, or (b) an NT-proBNP at Visit 4 or 5 of at least 125 pg/ml. Atrial fibrillation was ascertained based on ECGs at 5 study visits, hospital discharge records, and death certificates as previously described.10
Echocardiography
Design and methods of echocardiography in ARIC Visit 5 have been previously described in detail.11 Briefly, studies were acquired in participants attending Visit 5 at all four field centers by certified study sonographers using uniform imaging equipment and image acquisition protocol and quantitative measures were performed by blinded analysts at a dedicated core laboratory.
Pulse Wave Velocity
Electrocardiogram, bilateral brachial and ankle blood pressures, and carotid and femoral arterial pulse waves were simultaneously measured with a vascular testing device (VP-1000plus, Omron Healthcare).12 Carotid-femoral PWV was estimated as the distance between two arterial recording sites divided by transit time. Distance for carotid-femoral PWV was measured with a segmometer for PWV measurements (Rosscraft, Surray, Canada), and calculated as the distance between the suprasternal notch to carotid minus the carotid to femoral distance.
Cardiac Biomarker Assessment
Blood samples for cardiac biomarker measurement were taken at the time of the fifth ARIC visit and plasma was stored centrally at −80°C. Hs-TnT was measured using a highly sensitive assay (Elecsys Troponin T, Roche diagnostics, Indianapolis, IN). NT-proBNP was measured using electrochemiluminescent immunoassay (Roche Diagnostics) with a lower detection limit of ≤5 ng/mL.
Statistical Methods
The prevalence of CHD, MI, stroke, HF, and atrial fibrillation at Visit 5 was determined in each category of ideal CV health attainment. Among participants without prevalent cardiovascular events at Visit 5, echocardiographic, arterial stiffness, and biomarker data are described based on the category of ideal CV health attainment. Adjusted mean values with 95% confidence intervals and trend tests were performed using multivariable modeling (linear or logistic regression as appropriate) to test for trend across categories after adjusting for age, gender, race, and study field center. Analysis was performed in the study population overall and stratified by gender and race. Analyses of the slope of change in CVHS per decade of follow-up also used multivariable logistic and linear regression models with disease status and measures of cardiac structure and function as outcome variables, slope of change in CVHS category as the primary predictor variable and adjusted for age, gender, race, study field center and CVHS at Visit 1, as the baseline CVHS (at Visit 1) differed between change groups. To characterize the trajectories of ideal CV health attainment, we employed trajectory analysis13,14 using the STATA macro TRAJ with no adjustment for covariates. We used the Bayesian information criterion to decide the number of trajectories (two to five trajectories assessed). Continuous variables are presented as medians and 25th and 75th percentiles unless otherwise specified. Two-sided P-values of less than 0.05 were considered significant.
To adjust for potential bias due to selective attrition due to Visit 5 non-attendance, we performed a sensitivity analysis using inverse probability of attrition weighting.15,16 Visit 5 non-attendance was modeled among participants alive at the initiation of Visit 5 using the following covariates from Visit 1: age, gender, race, study center, systolic and diastolic blood pressure, heart rate, body mass index, smoking and drinking status, diabetes, hypertension, and chronic kidney disease. The resulting calculated weights were incorporated into multivariable models for CVD prevalence estimates and for each measure of cardiovascular structure and function with either the percent cumulative attained CVHS or the slope of change in CVHS per decade as the primary predictor variable.
Results
Of the 15,792 participants enrolled in the ARIC cohort at study inception, 10,742 (68%) were alive at the initiation of Visit 5. 6,538 participants (62% of those alive) attended the fifth visit and underwent echocardiographic, vascular, and biomarker assessments necessary to determine cardiovascular health. After excluding participants of non-white, non-black race (n=18), 6,520 participants were included in this analysis (Figure 1). Clinical characteristics at Visits 1 and 5 are presented in Table 2. Prevalent CVD was present at Visit 5 in 2,222 (34%) and of the remaining 4,298 participants without prevalent CVD, echocardiographic data was available in 4,107 (96%), hs-TnT in 4,246 (99%), NT-pro-BNP in 4,128 (96%), and vascular stiffness measures in 3,541 (82%).
Figure 1.
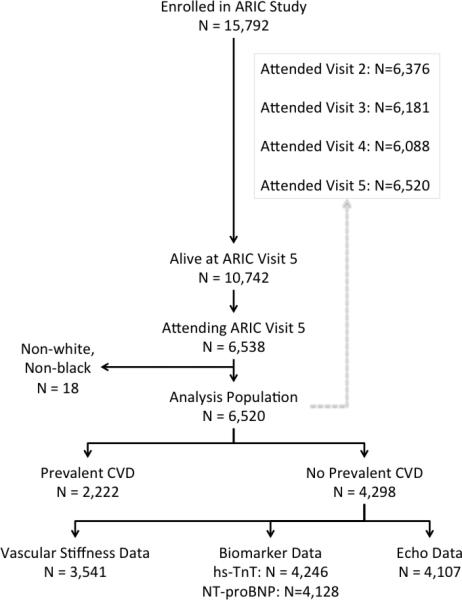
Consort diagram of study population.
Table 2.
Characteristics (mean ± SD or N (%) of the Visit 5 study population (N=6,520) at study inception (Visit 1) and end of follow-up (Visit 5), ARIC.
| Visit 1 | Visit 5 | ||
|---|---|---|---|
| Age (years) | 52.1 ± 5.2 | 76.3 ± 5.3 | |
| Age range (years) | 44 - 66 | 67 - 91 | |
| Male | 41% | ||
| Black | 24% | ||
| Field Center | |||
| Forsyth County | 1428 (22%) | ||
| Jackson | 1416 (22%) | ||
| Minneapolis | 1910 (29%) | ||
| Washington County | 1766 (27%) | ||
| Co-morbidities | |||
| Hypertension | 25% | 84% | |
| Smoking (ever) | 51% | 61% | |
| Smoking (current) | 18% | 6% | |
| Diabetes | 6% | 38% | |
| Coronary disease | 2% | 17% | |
| Prior MI | 2% | 8% | |
| Stroke | 0.7% | 4% | |
| Heart Failure | 3% | 14% | |
| Atrial fibrillation | 0.1% | 10% | |
| Medication Use | |||
| Aspirin | 26% | 58% | |
| Cholesterol Lowering | 2% | 56% | |
| Statin | 0.4% | 52% | |
| Anti-hypertensive | 23% | 76% | |
| ACE inhibitor or ARB | 2% | 34% | |
| Beta-blocker | 7% | 34% | |
| Diabetes medication | 2% | 22% | |
| Insulin | 0.7% | 6% | |
| Physical Exam Findings | |||
| BMI (kg/m2) | 27.2 ± 5.0 | 28.8 ± 5.8 | |
| SBP (mmHg) | 117 ± 16 | 131 ± 19 | |
| DBP (mmHg) | 73 ± 10 | 67 ± 11 | |
| Heart rate (bpm) | 66 ± 10 | 63 ± 10 | |
| Laboratory Values | |||
| Glucose (mg/dl) | 102 ± 25 | 113 ± 28 | |
| Creatinine (mg/dl) | 0.71 ± 0.18 | 1.00 ± 0.45 | |
| LDL (mg/dl) | 134.3 ± 38.1 | 104.2 ± 34.8 | |
| HDL (mg/dl) | 53.2 ± 17.0 | 52.1 ± 14.0 |
Ideal CV Health Attainment through Mid- and Late-Life
Overall, the number of ideal health metrics (range 0 to 6) attained declined at each visit (Figure 2). No significant heterogeneity was noted by gender (Figure 2A), with similar health metric attainment and rates of decline in both men and women. Blacks demonstrated significantly lower ideal health metric attainment at every visit compared to whites, with a similar rate of decline over the study visits (Figure 2B). We also examined the pattern of change for individual health factors and behaviors. From Visit 1 to Visit 5, the prevalence of ideal health indicators decreased for each of the three health factors assessed, cholesterol, blood pressure, and glucose (Supplemental Figure 1). For each health factor, the most prominent decline in prevalence was noted between Visit 4 and Visit 5, which had the longest interval between visits. In contrast, no significant decline was noted over the study visits in the prevalence of ideal for two of the three health behaviors assessed, physical activity and smoking. Ideal BMI did demonstrate a stepwise decline between Visits 1 through 4, but was essentially stable between Visits 4 and 5.
Figure 2.
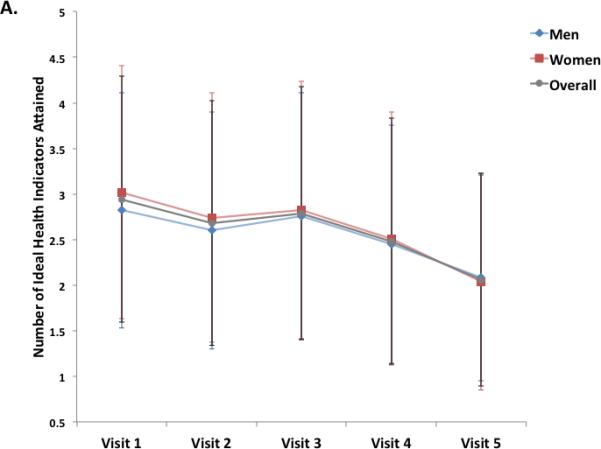
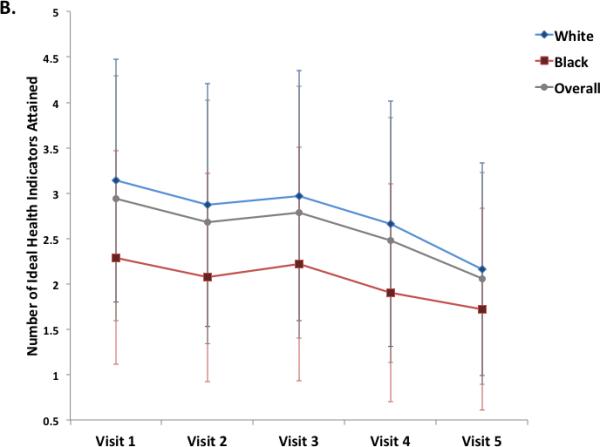
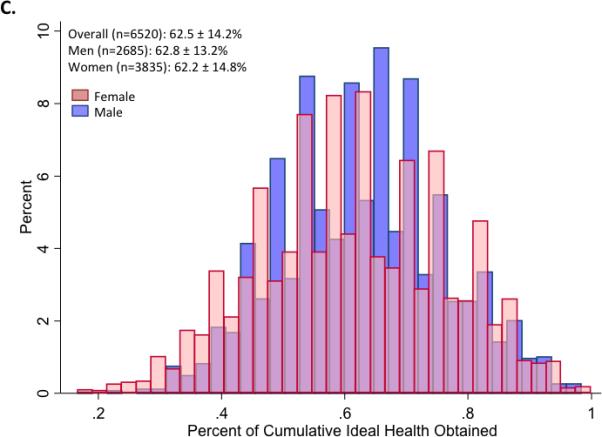
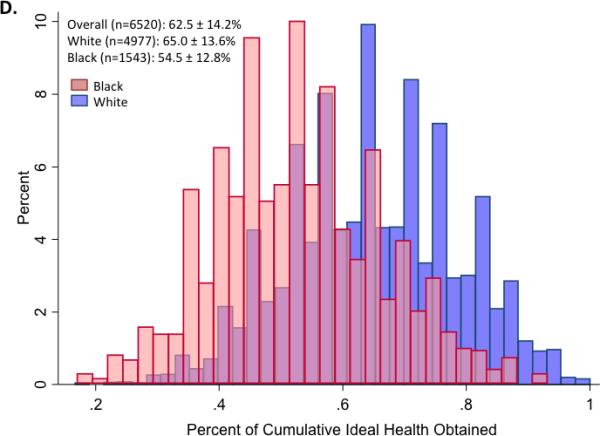
Panels A and B illustrate the mean (±S.D.) number of ideal cardiovascular health indicators attained at each of 5 ARIC visits between 1987 and 2013, in the study cohort overall and stratified by gender (Panel A) and race (Panel B). Panels C and D show the distribution of percent ideal cardiovascular health score (CVHS) attained by gender (Panel C) and by race (Panel D). P value for men versus women was 0.11. P value for whites versus black participants was <0.001.
Ideal CV Health Attainment through Adulthood and Cardiovascular Function in Late-Life
Over the course of the 5 study visits, the mean percent CVHS attained was 63±14% (Figure 2). No significant difference was noted by gender (Figure 2C). Significant differences were observed by race, with black participants demonstrating appreciably lower cumulative CVHS attainment then white participants (p<0.001; Figure 2D).
At the fifth ARIC visit, the prevalence of CAD was 17% with a prior history of MI in 8%; stroke was prevalent in 4%, HF in 14%, and atrial fibrillation in 10%. The prevalence of each cardiovascular outcome declined in a step-wise fashion with increasing category of percent cumulative CVHS attained (Figure 3A). Although men had a higher prevalence of each CV outcome than women, no consistent differences were noted in the relationship between disease prevalence and ideal health attainment by gender or race (Supplemental Tables 1 and 2).
Figure 3.
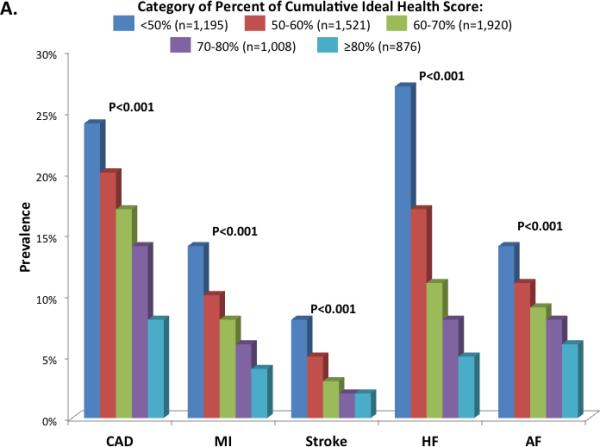
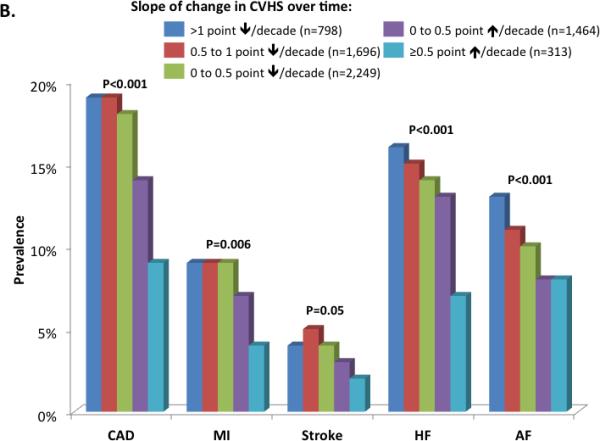
Prevalence of cardiovascular diseases by categories of percent cardiovascular health score (CVHS) attained through mid-life and late-life (Panel A) and by categories of change in CVHS per decade follow-up (Panel B). Prevalence estimates and P values are adjusted for age, gender, race, and Field Center.
Among participants without prevalent CVD at the fifth ARIC visit, greater percent CVHS attainment was significantly associated with better measures of LV structure and diastolic function (Table 3). In addition, although no differences were noted in LVEF, LV longitudinal strain – a more sensitive measure systolic deformation – was better among categories of greater attained CVHS, as were measures of arterial function, including lumped arterial load (arterial elastance) and arterial stiffness (carotid-femoral pulse wave velocity). Finally, soluble biomarkers of myocardial stress (NT-proBNP) and injury (hsTn-T) were lower among participants with the greatest percent CVHS achieved.
Table 3.
Measures of cardiovascular structure and function at Visit 5 by the percent CVHS attained between Visits 1 and 5.
| N | Category of percent CVHS attained | Adj P value | |||||
|---|---|---|---|---|---|---|---|
| <50% N=612 | 50-60% N=945 | 60-70% N=1,303 | 70-80% N=742 | ≥80% N=696 | |||
| LV Structure | |||||||
| LVEDV (ml) | 3,999 | 83.3 [81.8,84.9] | 80.7 [79.5,81.9] | 79.5 [78.5,80.5] | 77.2 [75.8,78.5] | 77.1 [75.7,78.5] | <0.001 |
| LV MWT (cm) | 4,088 | 1.03 [1.02,1.04] | 1.00 [0.99,1.01] | 0.97 [0.96,0.98] | 0.94 [0.93,0.95] | 0.92 [0.91,0.93] | <0.001 |
| LV mass (g) | 4,078 | 160 [157,163] | 150 [147,152] | 142 [140,143] | 132 [129,134] | 126 [123,128] | <0.001 |
| LVH (%) | 4,078 | 13.9 [11.6,16.2] | 10.1 [8.3,11.8] | 7.2 [5.8,8.7] | 5.7 [3.7,7.6] | 3.0 [1.0,5.0] | <0.001 |
| LV Systolic Function | |||||||
| LVEF (%) | 4,107 | 66 [65.5,66.4] | 66.2 [65.9,66.6] | 66.0 [65.7,66.3] | 66.2 [65.8,66.6] | 66.2 [65.8,66.6] | 0.68 |
| Longitudinal strain (%) | 3,867 | −18.0 [−18.2,−17.8] | −18.2 [−18.3,−18] | −18.2 [−18.4,−18.1] | −18.5 [−18.6,−18.3] | −18.7 [−18.8,−18.5] | <0.001 |
| LV Diastolic Function | |||||||
| TDI e' (cm/s) | 4,100 | 5.49 [5.37,5.61] | 5.64 [5.55,5.73] | 5.66 [5.59,5.74] | 5.85 [5.75,5.96] | 6.07 [5.97,6.18] | <0.001 |
| E/e' ratio | 4,095 | 13.0 [12.7,13.3] | 12.6 [12.4,12.9] | 11.8 [11.6,12] | 11.5 [11.2,11.7] | 10.9 [10.6,11.2] | <0.001 |
| LA volume (ml) | 4,073 | 50.0 [48.8,51.2] | 47.3 [46.3,48.2] | 45.3 [44.5,46.1] | 42.8 [41.7,43.8] | 42.2 [41.2,43.3] | <0.001 |
| RV Function & Pulmonary Pressure | |||||||
| RVFAC (%) | 3,782 | 52.5 [51.9,53.2] | 52.3 [51.7,52.8] | 52.4 [51.9,52.8] | 53.2 [52.6,53.7] | 54 [53.4,54.5] | <0.001 |
| TR velocity (m/s) | 2,345 | 2.46 [2.43,2.49] | 2.41 [2.38,2.43] | 2.36 [2.34,2.38] | 2.33 [2.3,2.35] | 2.31 [2.29,2.34] | <0.001 |
| Arterial Structure & Function | |||||||
| Aortic root diameter (cm) | 4,092 | 3.24 [3.21,3.27] | 3.22 [3.2,3.24] | 3.17 [3.16,3.19] | 3.14 [3.11,3.16] | 3.14 [3.11,3.16] | <0.001 |
| Ea (mmHg/ml) | 4,076 | 1.80 [1.76,1.84] | 1.79 [1.76,1.82] | 1.85 [1.82,1.87] | 1.90 [1.86,1.93] | 1.83 [1.80,1.87] | 0.002 |
| MAP (mmHg) | 4,287 | 90 [89,91] | 89 [88,89] | 89 [88,89] | 88 [88,89] | 86 [85,86] | <0.001 |
| PWV (cm/s) | 3,401 | 1265 [1228,1302] | 1199 [1171,1226] | 1151 [1129,1173] | 1132 [1103,1161] | 1100 [1070,1129] | <0.001 |
| Biomarkers of Myocardial Stress & Injury | |||||||
| NT-proBNP (ng/l) | 4,128 | 136 [124,148] | 120 [111,128] | 117 [110,124] | 109 [100,119] | 111 [99,122] | <0.001 |
| hsTn-T (ng/l) | 4,246 | 12.2 [11.6,12.8] | 10.7 [10.3,11.1] | 9.7 [9.4,10.0] | 8.7 [8.3, 9.2] | 9.0 [8.5, 9.6] | <0.001 |
Values are adjusted for age, gender, race, and field center. P value is P for trend. Values are multivariable adjusted means and 95% confidence intervals. Percent CVHS attained was calculated as the sum of the CVHS at Visits 1 through 5 divided by the maximum number of possible points.
Although greater percent CVHS attained was associated with better cardiac structure and function among both men and women, the association with measures of cardiac structure (LV size, wall thickness, and mass) was stronger among women compared to men (Supplemental Table 3). No significant effect modification of race on the relationship between percent CVHS attained and measures of cardiac structure and function was observed (Supplemental Table 4).
Change in Ideal CV Health Attainment through Mid- to Late-Life and Cardiovascular Function in Late-Life
Over the 26 years of follow-up, average CVHS decreased by 0.4 (95% CI 0 to 0.76) per decade, although values ranged from a decrease of 2.8 per decade to an increase of 1.9 per decade. After adjusting for the Visit 1 CVHS, women demonstrated a steeper decline than men (−0.42 [−0.44, −0.40] versus −0.34 [−0.37, −0.32] per decade respectively, p<0.001) while no significant difference in rate of decline was noted between blacks and whites (−0.42 [−0.45,−0.39] versus −0.38 [−0.40, −0.37] per decade respectively, p=0.08). The prevalence of all cardiovascular events was lower among participants with greater average improvement in CVHS during follow-up (Figure 3B). No consistent differences in relationship between change in CVHS and CVD prevalence were noted by gender or race (Supplemental Tables 5 and 6), although the magnitude of reduction in CAD prevalence per unit change in CVHS appeared greater in women compared to men.
Among participants without prevalent CVD at Visit 5, adjusting for CVHS at Visit 1, participants with a more positive slope of change in CVHS (i.e. improvement in CVHS over time) demonstrated lower LV wall thickness and mass, better diastolic indices, and better LV longitudinal systolic function, in addition to smaller aortic root size (Table 4). These associations of improvement in CVHS with better cardiac structure and function did not differ significantly by gender (Supplemental Table 7) or race (Supplemental Table 8).
Table 4.
Measures of cardiovascular structure and function at Visit 5 by category of slope of change in CVHS per decade from Visit 1 through Visit 5.
| Slope of Change in CVHS per decade of follow-up |
Adj P for trend | |||||
|---|---|---|---|---|---|---|
| >1 point /decade decrease N=583 | 0.5 – 1 point/decade decrease N=1,139 | 0 – 0.5 point/decade decrease N=1,446 | 0 – 0.5 point/decade increase N=922 | ≥0.5 point/decade increase N=208 | ||
| LV Structure | ||||||
| LVEDV (ml) | 79.3 [77.6,80.9] | 79.2 [78.0,80.3] | 79.7 [78.7,80.6] | 79.7 [78.5,81.0] | 78.4 [75.8,81.0] | 0.85 |
| LV MWT (cm) | 1.00 [0.99,1.01] | 0.98 [0.97,0.99] | 0.97 [0.96,0.97] | 0.95 [0.94,0.96] | 0.93 [0.91,0.94] | <0.001 |
| LV mass (g) | 151 [147,154] | 144 [142,146] | 141 [140,143] | 135 [133,138] | 129 [124,133] | <0.001 |
| LVH (%) | 9.2 [6.8,11.6] | 8.7 [7.1,10.3] | 8.4 [7.0,9.8] | 5.2 [3.4,7.0] | 5.7 [1.9,9.5] | 0.008 |
| LV Systolic Function | ||||||
| LVEF (%) | 66.1 [65.6,66.6] | 66.2 [65.9,66.6] | 66.0 [65.7,66.3] | 66.2 [65.8,66.5] | 66.2 [65.5,67] | 0.94 |
| Longitudinal strain (%) | −18.1 [−18.4,−17.9] | −18.2 [−18.3,−18.1] | −18.3 [−18.4,−18.1] | −18.5 [−18.7,−18.3] | −18.8 [−19.2,−18.5] | <0.001 |
| LV Diastolic Function | ||||||
| TDI e' (cm/s) | 5.5 [5.4,5.7] | 5.6 [5.5,5.7] | 5.8 [5.7,5.9] | 5.9 [5.8,6.0] | 5.9 [5.7,6.1] | <0.001 |
| E/e' ratio | 12.3 [11.9,12.6] | 12.2 [12.0,12.4] | 11.9 [11.7,12.1] | 11.6 [11.3,11.8] | 11.5 [11.0,12] | <0.001 |
| LA volume (ml) | 46.2 [44.9,47.5] | 45.9 [45.1,46.8] | 45.1 [44.3,45.8] | 45.1 [44.2,46.1] | 43.8 [41.7,45.8] | 0.04 |
| RV Function & Pulmonary Pressure | ||||||
| RVFAC (%) | 52.3 [51.7,53] | 52.6 [52.2,53.1] | 52.8 [52.4,53.2] | 53.2 [52.7,53.7] | 52.9 [51.8,54] | 0.09 |
| TR velocity (m/s) | 2.41 [2.38,2.44] | 2.4 [2.37,2.42] | 2.36 [2.34,2.37] | 2.35 [2.32,2.37] | 2.24 [2.19,2.29] | <0.001 |
| Arterial Structure & Function | ||||||
| Aortic root diameter (cm) | 3.21 [3.18-3.24] | 3.18 [3.16-3.20] | 3.17 [3.16-3.19] | 3.16 [3.14-3.18] | 3.20 [3.15-3.24] | 0.09 |
| Ea (mmHg/ml) | 1.85 [1.81,1.89] | 1.82 [1.79,1.85] | 1.86 [1.83,1.88] | 1.82 [1.79,1.85] | 1.81 [1.74,1.87] | 0.53 |
| MAP (mmHg) | 91 [90,92] | 89 [88,89] | 88 [88,89] | 87 [86,88] | 85 [84,87] | <0.001 |
| PWV (cm/s) | 1193 [1154,1230] | 1161 [1136,1186] | 1156 [1135,1177] | 1167 [1139,1194] | 1099 [1043,1156] | 0.11 |
| Biomarkers of Myocardial Stress & Injury | ||||||
| NT-proBNP (ng/l) | 118 [107,130] | 117 [110,125] | 112 [105,118] | 122 [114,131] | 137 [119,154] | 0.26 |
| hsTn-T (ng/l) | 10.3 [9.8-10.9] | 10.0 [9.6,10.4] | 10.1 [9.8,10.4] | 9.7 [9.3,10.1] | 8.9 [8.0, 9.8] | <0.001 |
Values are adjusted for CVHS at Visit 1, age, gender, race, and field center. P value is P for trend. Values are multivariable adjusted means and 95% confidence intervals.
Trajectories of Ideal CV Health Attainment in the Community from Mid- to Late-Life
We identified five trajectories of ideal CV health attainment (CVHS) during the follow-up period (Figure 4A). Trajectories 1 through 4 represented decreasing CVHS at baseline with similar rates of decline in CVHS during follow-up. In contrast, trajectory 5, the smallest group of only 7% of the study population, began Visit 1 at a low CVHS but demonstrated improvement in CVHS during follow-up. This improvement in CVHS during follow-up was related to progressive improvements in both health behaviors (smoking, physical activity, and BMI) in addition to health factors (cholesterol and glucose; data not shown). Worse CVHS trajectory was associated with younger age, male gender, black race, and a higher prevalence of cardiovascular co-morbidities at both Visits 1 and 5 (Supplemental Table 9). Participants in trajectory 5 most closely resembled those in trajectory 3 in demographics and clinical characteristics at Visits 1 and 5. Similarly, the prevalence of CVD at Visit 5 was lowest in trajectory 1 and highest in trajectory 4 (Figure 4B). However, in contrast to the clinical characteristics, participants in trajectory 5 demonstrated a lower prevalence of CVD than trajectory 3 participants and more closely resembled trajectory 2 participants. Among participants without prevalent CVD at Visit 5, the expected gradient was noted between trajectories 1 and 4 in measures of LV structure, systolic function, and diastolic function. Among participants in trajectory 5, measures of LV structure and systolic function were similar to trajectory 2 participants, while diastolic measures more closely approximated trajectory 3 participants (Figure 5; Supplemental Table 10).
Figure 4.
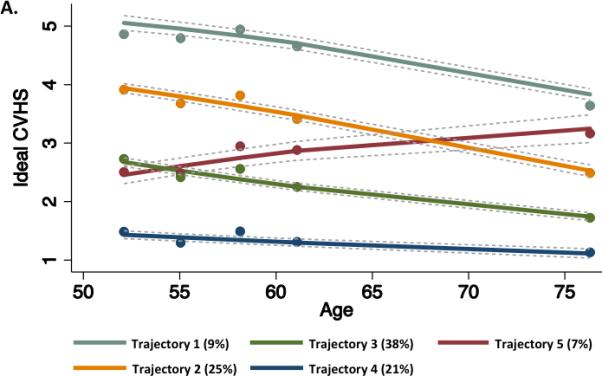
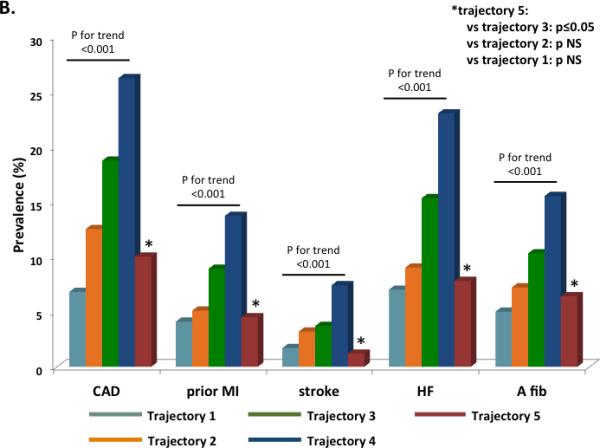
(A) Trajectories of CVHS over the 25 year period of the ARIC study. Percentages in the figure legend refer to population prevalence. (B) Prevalence of cardiovascular diseases by trajectory of CVHS. Prevalence estimates and P values are adjusted for age, gender, race, and Field Center.
Figure 5.
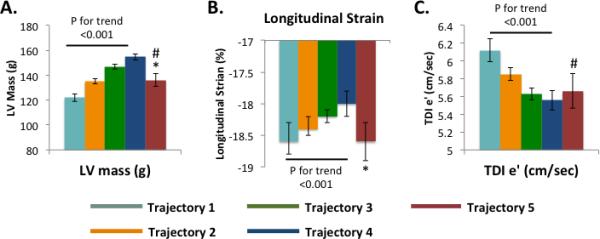
Mean and SEM of echocardiographic measures at Visit 5 of (A) LV structure [mass], (B) LV systolic function [longitudinal strain], and (C) LV diastolic function [TDI e’] by CVHS trajectory. Values and P values are adjusted for age, gender, race, and Field Center. * - trajectory 5 vs 3 p <0.05 and 5 vs 2 p NS. # - trajectory 5 vs 1 p <0.5.
Discussion
Our analysis of over 6,000 ARIC participants with CV health metrics evaluated serially over 25 years has three major novel findings. First, using data from serial assessments in the same individuals we confirm prior cross-sectional observations that the attainment of ideal health tends to decline through adulthood, with the most prominent decreases in health attainment noted for the three health factors (blood pressure, glucose, and cholesterol). Black participants demonstrated significantly worse health attainment at all time points, with a similar rate of decline over time as whites. Second, greater health attainment through mid-life and late-life was not only associated with less prevalent CVD when elderly but, among those without prevalent CVD, was also associated with better measures of cardiovascular structure and function when elderly. Finally, improvement in health indicator attainment from mid-life to late-life was also associated with lower CVD prevalence and significantly better cardiovascular structure and function in the elderly, compared to no improvement or deterioration in CV health metrics. Since the articulation of the ideal cardiovascular health construct by the American Heart Association in 2010, several studies have documented the low prevalence of ideal health indicator status in the population overall,2,17,18 and among black Americans in particular.2,19 Similarly, several cross-sectional studies have noted declining health indicator attainment from early to middle to late adulthood.17,20 However, our analysis is one of the first – to our knowledge – to assess CV health indicator attainment serially through mid- to late-life. Importantly, declining CVHS with age was driven primarily by age-related decreases in optimal attainment for the three health factors (blood pressure, glucose, cholesterol) and BMI, highlighting the importance of primordial prevention throughout adulthood to prevent the occurrence of hypertension, diabetes, and hyperlipidemia.
Our findings regarding the relationship between CVHS attainment through mid- to late-life and the prevalence of CVD is late life is consistent with previous studies demonstrating an association between CVHS and incident coronary disease, MI, stroke, and CV death among ethnically diverse populations including whites, blacks,2,17,18 Hispanics,21 and Chinese.22 Importantly, higher CVHS attainment has also been associated with a lower incidence of HF,5 a growing public health problem that disproportionately affects the elderly. Indeed, the prevalence of HF in our elderly cohort at Visit 5 was 5-fold lower among participants whose percent CVHS attainment was ≥80% compared to those in whom it was <50% (27% vs 5% HF prevalence respectively). To date, there has been limited data regarding the factors linking greater CVHS to lower HF risk. CVHS has been associated with risk of retinopathy,23 possibly suggesting microvascular disease as an etiology – a mechanism that would be concordant with our findings of an association between CVHS and hsTn-T level.
While low CVHS has been associated with subclinical markers of atherosclerosis such as greater carotid intimal medial thickness, little data exists regarding associated cardiac abnormalities. Our study provides extensive novel data regarding subclinical impairments in cardiac structure and function associated with low CVHS that may underlie the association with clinical HF. Consistent with one prior study,24 lower percent CVHS attained was associated with higher LV mass, with a four-fold lower prevalence of LVH among participants with a percent CVHS attained of ≥80 versus <50% (3 versus 14% LVH prevalence respectively). These differences in LV mass were related to both lower LV wall thickness and chamber size among those with greater CVHS, and these individuals also demonstrated less concentric remodeling reflected in the relative wall thickness. Although CVHS was not associated with LVEF in this population with predominantly preserved LVEF, higher attained CVHS was associated with better LV longitudinal strain, a more sensitive measure of LV systolic performance than LVEF. We also noted better LV diastolic performance – both myocardial relaxation (e’) and LV filling pressure (E/e’) – among those with higher attained CVHS. Importantly, these echo measures – LVH, diastolic function, and strain – are prognostic of incident HF.25,26,27 Additionally, greater percent CVHS attainment was associated with a lower prevalence of atrial fibrillation, a frequent risk factor for HF in the elderly,28 and with lower left atrial size, an important risk factor for HF and incident atrial fibrillation.29
The factors and behaviors captured in the CVHS account for a considerable proportion of the population attributable risk for CV mortality, ischemic heart disease mortality,18 and incident HF.5 Therefore, improving CVHS in mid-life may provide an opportunity to significantly impact health in late-life, although few studies have quantified the implications of change in CVHS during mid- to late-life. In the CARDIA study, improvement in CV health attainment from young adulthood to middle-age was associated with less subclinical atherosclerosis reflected in the carotid intimal medial thickness and coronary artery calcification.30 We demonstrate that improvement in CVHS through mid- to late-life is associated with a lower prevalence of CVD in late life. These findings are concordant with results of randomized clinical trials of antihypertensive and lipid lowering therapies for primary prevention of cardiovascular disease.31,32,33,34 Improvement in CVHS was also associated with better cardiac structure and function among those without prevalent CVD. Similar to prior reports,2,17 black participants demonstrated lower CVHS than white participants at all time points, although no prominent differences were noted in the slope of change in CVHS by race or in the relationship between attained CVHS and prevalence of CVD. Importantly, the favorable association of cardiac structure and function with improvement in CVHS during follow-up was similar between blacks and whites – highlighting the large opportunity for health improvement with interventions to optimize health factors and behaviors in mid- to late-life, particularly among African Americans.
Our exploratory analysis of CVHS trajectories was concordant with our other analyses and provides further support for efforts to improve CHVS among those in mid- to late-life. Of the five CVHS trajectories identified, the majority of participants followed trajectories of low to moderate CVHS with a steady decline during follow-up (Figure 5, trajectories 2-4). The lowest prevalence of CVD and best cardiac structure and function was observed in those participants with the greatest consistent CVHS (trajectories 1 and 2). Importantly, however, the small proportion of participants with low CVHS as baseline who improved during follow-up (trajectory 5) had a prevalence of CVD at Visit 5 similar to those who started at a higher CVHS (trajectory 2). Echocardiographic findings in this group were more modest, although both LV structure and systolic function more closely approximated values in trajectory 2 and were clearly better than those who started at a similarly low CVHS but declined further during follow-up (trajectory 3).
Several limitations of this analysis warrant consideration. While the CVHS is based on seven metrics of ideal cardiovascular health, data for serial assessment of ideal diet was not available in our study. Survival bias and selection bias due visit non-attendance may influence our prevalence estimates. This was particularly an issue at Visit 5, when 32% of the original study cohort had died and 38% of those alive chose not to attend. However, sensitivity analyses using inverse probability attrition weighting (Supplemental Figures 2 and 3; Supplemental Tables 11 and 12) demonstrated consistent findings with the primary analysis, suggesting that the influence of such bias on our findings was minimal. In addition, with respect to prevalent CVD at visit 5, our findings are consistent with previous studies of the association of CVHS with incident CVD.2,5 This was an observational study and not an interventional trial, and therefore we can not draw conclusions regarding causality. Our finding that improvement in CVHS is associated with less CVD could be subject to confounding. In addition, we cannot exclude the possibility that some of the improvement in CVHS observed in Trajectory 5 participants during follow-up was related to regression to the mean. However, our observations are consistent with the results of multiple randomized controlled trials aimed at optimizing components of the CVHS for primary prevention. The magnitude of average between group differences in some measures of cardiac structure and function was relatively modest. Despite this, our data suggest a robust association between CVHS attainment and cardiac and vascular health, evidenced by the consistent and highly significant association of multiple CVHS measures across multiple parameters of cardiovascular structure and function. Finally, measurement error exists in our assessment of risk factors, however, examination across multiple visits helps reduce the impact of measurement error on our findings.
Conclusions
Attainment of ideal CV health typically declines with age. The percent of ideal CV health attained in mid- to late-life is associated with a lower prevalence of CVD and better cardiovascular structure and function in late-life. Improvement in the attainment of ideal CV health through mid- to late-life is similarly associated with a lower prevalence of CVD and better cardiac structure and function in late life. These findings highlight importance of consistent primordial and primary prevention efforts throughout mid- to late-life as a potential intervention to decrease the burden of CVD, and HF in particular, among the elderly.
Supplementary Material
Acknowledgments
The authors wish to thank the staff and participants of the ARIC study for their important contributions.
Funding Sources: The Atherosclerosis Risk in Communities Study is carried out as a collaborative study supported by National Heart, Lung, and Blood Institute contracts (HHSN268201100005C, HHSN268201100006C, HHSN268201100007C, HHSN268201100008C, HHSN268201100009C, HHSN268201100010C, HHSN268201100011C, and HHSN268201100012C). The work for this manuscript was also supported by NHLBI grant 1K08HL116792-01A1 (A.M.S.) and AHA grant 14CRP20380422 (A.M.S.).
Footnotes
Disclosures: Dr Shah reports receiving research support from Novartis, Gilead, and Actelion.
References
- 1.Lloyd-Jones DM, Hong Y, Labarthe D, Mozaffarian D, Appel LJ, Van Horn L, Greenlund K, Daniels S, Nichol G, Tomaselli GF, Arnett DK, Fonarow GC, Ho PM, Lauer MS, Masoudi FA, Robertson RM, Roger V, Schwamm LH, Sorlie P, Yancy CW, Rosamond WD. Defining and setting national goals for cardiovascular health promotion and disease reduction: The American Heart Association's strategic impact goal through 2020 and beyond. Circulation. 2010;121:586–613. doi: 10.1161/CIRCULATIONAHA.109.192703. [DOI] [PubMed] [Google Scholar]
- 2.Folsom AR, Yatsuya H, Nettleton JA, Lutsey PL, Cushman M, Rosamond WD. Community prevalence of ideal cardiovascular health, by the American Heart Association definition, and relationship with cardiovascular disease incidence. J Am Coll Cardiol. 2011;57:1690–6. doi: 10.1016/j.jacc.2010.11.041. [DOI] [PMC free article] [PubMed] [Google Scholar]
- 3.American Heart Association . Heart disease and stroke statistics – 2009 update. American Heart Association; Dallas, Texas: 2009. [Google Scholar]
- 4.Hunt SA, Abraham WT, Chin MH, Feldman AM Francis GS, Ganiant TG, Jessup M, Konstam MA, Mancini DM, Michl K, Oates JA, Rahko PS, Silver MA, Stevenson LW, Yancy CW. 2009 focus update incorporated into the ACC/AHA 2005 guidelines for the diagnosis and management of heart failure in adults. J Am Coll Cardiol. 2009;53:e1–90. doi: 10.1016/j.jacc.2008.11.013. [DOI] [PubMed] [Google Scholar]
- 5.Folsom AR, Yamagishi K, Hozawa A, Chambless LE. Absolute and attributable risks of heart failure incidence in relation to optimal risk factors. Circ Heart Fail. 2009;2:11–7. doi: 10.1161/CIRCHEARTFAILURE.108.794933. [DOI] [PMC free article] [PubMed] [Google Scholar]
- 6.The ARIC Investigators The Atherosclerosis Risk in Communities (ARIC) study: design and objectives. Am J Epidemiol. 1989;129:687–702. [PubMed] [Google Scholar]
- 7.White A, Folsom A, Chambless L, Sharret R, Yang K, Conwill D, Higgins M, Dale Williams O. Tyroler HA and the ARIC Investigators. ScienceDirect - Journal of Clinical Epidemiology : Community surveillance of coronary heart disease in the Atherosclerosis Risk in Communities (ARIC) Study: Methods and initial two years' experience. J Clin Epidemiol. 1996;49:223–233. doi: 10.1016/0895-4356(95)00041-0. [DOI] [PubMed] [Google Scholar]
- 8.Loehr LR, Rosamond WD, Chang PP, Folsom AR, Chambless LE. Heart failure incidence and survival (from the Atherosclerosis Risk in Communities study). Am J Cardiol. 2008;101:1016–1022. doi: 10.1016/j.amjcard.2007.11.061. [DOI] [PubMed] [Google Scholar]
- 9.Rosamond WD, Chang PP, Baggett C, Johnson A, Bertoni AG, Shahar E, Dewsal A, Heiss G, Chambless LE. Classification of heart failure in the Atherosclerosis Risk in Communities (ARIC) study: A comparison of diagnostic criteria. Circ Heart Fail. 2012:152–9. doi: 10.1161/CIRCHEARTFAILURE.111.963199. [DOI] [PMC free article] [PubMed] [Google Scholar]
- 10.Alonso A, Agarwal S, Soliman EZ, Ambrose M, Chamberlain AM, Prineas RJ, Folsom AR. Incidence of atrial fibrillation in whites and African-Americans: the Atherosclerosis Risk in Communities (ARIC) study. Am Heart J. 2009;158:111–7. doi: 10.1016/j.ahj.2009.05.010. [DOI] [PMC free article] [PubMed] [Google Scholar]
- 11.Shah AM, Cheng S, Skali H, Wu J, Mangion JR, Kitzman D, Matsushita K, Konety S, Butler KR, Fox ER, Cook N, Ni H, Coresh J, Mosley TH, Heiss G, Folsom AR, Solomon SD. Rationale and Design of a Multicenter Echocardiographic Study to Assess the Relationship between Cardiac Structure and Function and Heart Failure Risk in a Biracial Cohort of Community Dwelling Elderly Persons: The Atherosclerosis Risk in Communities (ARIC) Study. Circ Cardiovasc Imaging. 2014;7:173–81. doi: 10.1161/CIRCIMAGING.113.000736. [DOI] [PMC free article] [PubMed] [Google Scholar]
- 12.Cortez-Cooper MY, Supak JA, Tanaka H. A new device for automatic measurements of arterial stiffness and ankle-brachial index. Am J Cardiol. 2003;91:1519–1522. doi: 10.1016/s0002-9149(03)00416-8. [DOI] [PubMed] [Google Scholar]
- 13.Allen NB, Siddique J, Wilkins J, Shay C, Lewis CE, Goff DC, Jacobs DR, Liu K, Lloyd- Jones D. Blood pressure trajectories in early adulthood and subclinical atherosclerosis in middle age. JAMA. 2014;311:490–7. doi: 10.1001/jama.2013.285122. [DOI] [PMC free article] [PubMed] [Google Scholar]
- 14.Gill TM, Murphy TE, Gahbauer EA, Allore HG. The course of disability before and after a serious fall injury. JAMA Intern Med. 2013;173:1780–6. doi: 10.1001/jamainternmed.2013.9063. [DOI] [PMC free article] [PubMed] [Google Scholar]
- 15.Weuve J, Tchetgen Tchetgen EJ, Glymour MM, Beck TL, Aggarwal NT, Wilson RS, Evans DA, Mendes de Leon CF. Accounting for bias due to selective attrition: the example of smoking and cognitive decline. Epidemiology. 2012;23:119–0128. doi: 10.1097/EDE.0b013e318230e861. [DOI] [PMC free article] [PubMed] [Google Scholar]
- 16.Gottesman RF, Rawlings AM, Sharrett AR, Albert M, Alonso A, Bandeen-Roche K, Coker LH, Coresh J, Couper DJ, Griswold ME, Heiss G, Knopman DS, Patel MD, Penman AD, Power MC, Seines OA, Schneider AL, Wagenknecht LE, Windham BG, Wruck LM, Mosley TH. Impact of differential attrition on the association of education with cognitive change over 20 years of follow-up: the ARIC neurocognitive study. Am J Epidemiol. 2014;179:956–966. doi: 10.1093/aje/kwu020. [DOI] [PMC free article] [PubMed] [Google Scholar]
- 17.Berry JD, Dyer A, Cai X, Garside DB, Ning H, Thomas A, Greenland P, Van Horn L, Tracey RP, Lloyd-Jones DM. Lifetime risks of cardiovascular disease. N Engl J Med. 2012;66:321–9. doi: 10.1056/NEJMoa1012848. [DOI] [PMC free article] [PubMed] [Google Scholar]
- 18.Yang Q, Cogswell ME, Flanders WD, Hong Y, Zhang Z, Loustalot F, Gillespie C, Merritt R, Hu FB. Trends in cardiovascular health metrics and associations with all-cause and CVD mortality among US adults. JAMA. 2012;307:1273–83. doi: 10.1001/jama.2012.339. [DOI] [PMC free article] [PubMed] [Google Scholar]
- 19.Bambs C, Kip KE, Dinga A, Mulukutla SR, Aiyer AN, Reis SE. Low prevalence of “Ideal Cardiovascular Health” in a community-based population: Heart Strategies Concentrating on Risk Evaluation (Heart SCORE) study. Circulation. 2011;123:850–7. doi: 10.1161/CIRCULATIONAHA.110.980151. [DOI] [PMC free article] [PubMed] [Google Scholar]
- 20.Shay CM, Ning H, Allen NB, Carnethon MR, Chiuve SE, Greenlund KJ, Daviglus ML, Lloyd-Jones DM. Status of cardiovascular health in UD adults: Prevalence estimates for the National Health and Nutrition Examination Surveys (NHANES) 2003-2008. Circulation. 2012;125:45–56. doi: 10.1161/CIRCULATIONAHA.111.035733. [DOI] [PMC free article] [PubMed] [Google Scholar]
- 21.Dong C, Rundek T, Wright CB, Anwar Z, Elkind MSV, Sacco RL. Ideal cardiovascular health predicts lower risks of myocardial infarction, stroke, and vascular death across whites, blacks, and Hispanics: the Northern Manhattan Study. Circulation. 2012;125:2975–84. doi: 10.1161/CIRCULATIONAHA.111.081083. [DOI] [PMC free article] [PubMed] [Google Scholar]
- 22.Wu S, Huang Z, Yang X, Zhou Y, Wang A, Chen L, Zhao H, Ruan C, Wu Y, Xin A, Li K, Jin C, Cai J. Prevalence of ideal cardiovascular health and its relationship with the 4-year cardiovascular events in a northern Chinese industrial city. Circ Cardiovasc Qual Outcomes. 2012;5:487–93. doi: 10.1161/CIRCOUTCOMES.111.963694. [DOI] [PubMed] [Google Scholar]
- 23.Ogagarue ER, Lutsey PL, Klein R, Klein BE, Folsom AR. Association of ideal cardiovascular health metrics and retinal microsvascular findings: the Atherosclerosis Risk in Communities Study. J Am Heart Assoc. 2013;2:e000430. doi: 10.1161/JAHA.113.000430. [DOI] [PMC free article] [PubMed] [Google Scholar]
- 24.Xanthakis V, Enserro DM, Murabito JM, Polak JF, Wollert KC, Januzzi JL, Wang TJ, Tofler G, Vasan RS. Ideal cardiovascular health: associations with biomarkers and subclinical disease and impact on incidence of cardiovascular disease in the Framingham Offspring Study. Circulation. 2014;130:1676–83. doi: 10.1161/CIRCULATIONAHA.114.009273. [DOI] [PubMed] [Google Scholar]
- 25.Bluemke DA, Kronmal RA, Lima JAC, Liu K, Olson J, Burke GL, Folsom AR. The relationship of left ventricular mass and geometry to incident cardiovascular events: the MESA (Multi-Ethnic Study of Atherosclerosis) study. J Am Coll Cardiol. 2008;52:2148–55. doi: 10.1016/j.jacc.2008.09.014. [DOI] [PMC free article] [PubMed] [Google Scholar]
- 26.Kane GC, Karon BL, Mahoney DW, Redfield MM, Roger VL, Burnett JC, Jacobsen SJ, Rodeheffer RJ. Progression of left ventricular diastolic dysfunction and risk of heart failure. JAMA. 2011;306:856–63. doi: 10.1001/jama.2011.1201. [DOI] [PMC free article] [PubMed] [Google Scholar]
- 27.Choi EY, Rosen BD, Fernandes VRS, Yan RT, Yoneyama K, Donekal S, Opdahl A, Almeida ALC, Wu CO, Gomes AS, Bluemke DA, Lima JAC. Prognostic value of myocardial circumferential strain for incident heart failure and cardiovascular events in asymptomatic individuals: the Multi-Ethnic Study of Atherosclerosis. Eur Heart J. 2013;34:2354–61. doi: 10.1093/eurheartj/eht133. [DOI] [PMC free article] [PubMed] [Google Scholar]
- 28.Zakeri R, Chamberlain AM, Roger VL, Redfield MM. Temporal relationship and prognostic significance of atrial fibrillation in heart failure patients with preserved ejection fraction: a community-based study. Circulation. 2013;128:1085–93. doi: 10.1161/CIRCULATIONAHA.113.001475. [DOI] [PMC free article] [PubMed] [Google Scholar]
- 29.Psaty BM, Manollo TA, Kuller LH, Kronmal RA, Cushman M, Fried LP, White R, Furberg CD, Rautaharju PM. Incidence of and risk factors for atrial fibrillation in older adults. Circulation. 1997;96:2455–61. doi: 10.1161/01.cir.96.7.2455. [DOI] [PubMed] [Google Scholar]
- 30.Spring B, Moller AC, Colangelo LA, Siddique J, Roehrig M, Daviglus ML, Polak JF, Reis JP, Sidney S, Liu K. Healthy lifestyle change and subclinical atherosclerosis in young adults: Coronary Artery Risk Development in Young Adults (CARDIA) study. Circulation. 2014;130:10–17. doi: 10.1161/CIRCULATIONAHA.113.005445. [DOI] [PMC free article] [PubMed] [Google Scholar]
- 31.Hypertension Detection and Follow-up Program Cooperative Group Five year findings of the hypertension detection and follow-up program: Reduction in mortality of persons with high blood pressure, including mild hypertension. JAMA. 1979;242:2562–71. [PubMed] [Google Scholar]
- 32.Hypertension Detection and Follow-up Program Cooperative Group Five year findings of the hypertension detection and follow-up program: Reduction in stroke incidence among persons with high blood pressure. JAMA. 1982;247:633–8. [PubMed] [Google Scholar]
- 33.Shepherd J, Cobbe S, Ford I, Isles CG, Lorimer R, Macfarlane PW, McKillop JH, Packard CJ. Prevention of coronary heart disease with pravastatin in men with hypercholesterolemia. N Engl J Med. 1995;333:1301–8. doi: 10.1056/NEJM199511163332001. [DOI] [PubMed] [Google Scholar]
- 34.Downs JR, Clearfield M, Weis S, Whitney E, Shapiro DR, Beere PA, Langendorfer A, Stein EA, Kruyer W, Gotto AM. Primary prevention of acute coronary events with lovastatin in men and women with average cholesterol levels: Results of AFCAPS/TexCAPS. JAMA. 1998;279:1615–22. doi: 10.1001/jama.279.20.1615. [DOI] [PubMed] [Google Scholar]
Associated Data
This section collects any data citations, data availability statements, or supplementary materials included in this article.


