
Figure 2.
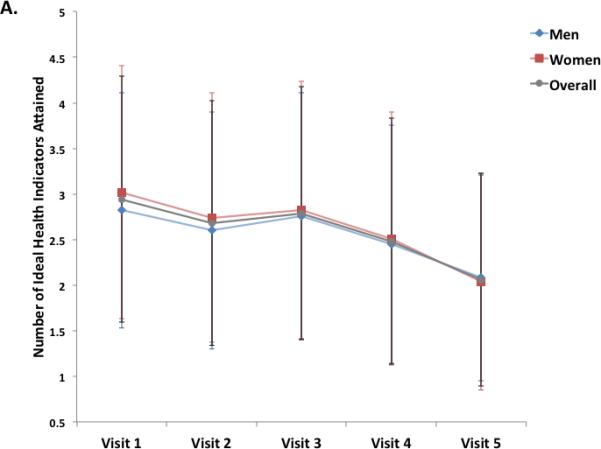
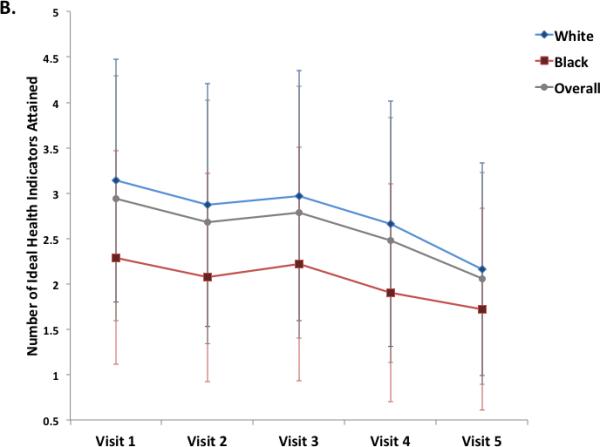
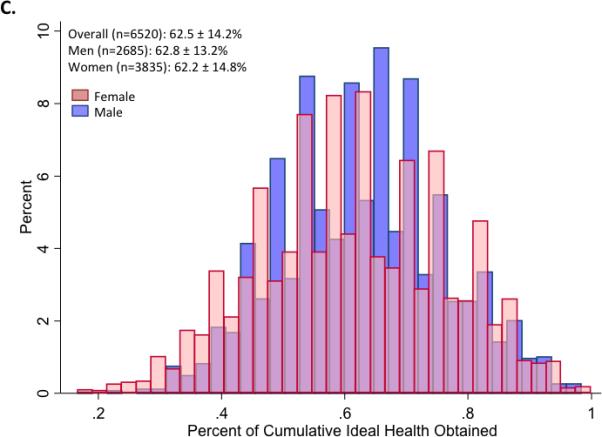
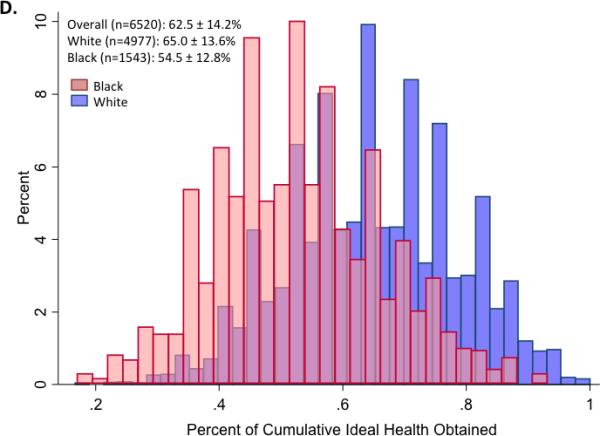
Panels A and B illustrate the mean (±S.D.) number of ideal cardiovascular health indicators attained at each of 5 ARIC visits between 1987 and 2013, in the study cohort overall and stratified by gender (Panel A) and race (Panel B). Panels C and D show the distribution of percent ideal cardiovascular health score (CVHS) attained by gender (Panel C) and by race (Panel D). P value for men versus women was 0.11. P value for whites versus black participants was <0.001.