

Physiological changes have been observed during sojourns in space and at altitude. With future space habitats expected to have atmospheres with reduced Po2, this study extends limited existing data on the combined effect of moderate hypoxia and musculoskeletal unloading on metabolic parameters. Hypoxia reduced fasting total cholesterol but compounded the negative effect of bed rest on HDL. Moreover, hypoxia did not alter bed rest-induced reductions in insulin sensitivity and glucose tolerance but increased insulin clearance.
Keywords: normobaric hypoxia, simulated microgravity, insulin sensitivity, cholesterol
Abstract
PlanHab is a planetary habitat simulation study. The atmosphere within future space habitats is anticipated to have reduced Po2, but information is scarce as to how physiological systems may respond to combined exposure to moderate hypoxia and reduced gravity. This study investigated, using a randomized-crossover design, how insulin sensitivity, glucose tolerance, and circulating lipids were affected by 16 days of horizontal bed rest in normobaric normoxia [NBR: FiO2 = 0.209; PiO2 = 133.1 (0.3) mmHg], horizontal bed rest in normobaric hypoxia [HBR: FiO2 = 0.141 (0.004); PiO2 = 90.0 (0.4) mmHg], and confinement in normobaric hypoxia combined with daily moderate intensity exercise (HAMB). A mixed-meal tolerance test, with arterialized-venous blood sampling, was performed in 11 healthy, nonobese men (25-45 yr) before (V1) and on the morning of day 17 of each intervention (V2). Postprandial glucose and c-peptide response were increased at V2 of both bed rest interventions (P < 0.05 in each case), with c-peptide:insulin ratio higher at V2 in HAMB and HBR, both in the fed and fasted state (P < 0.005 in each case). Fasting total cholesterol was reduced at V2 in HAMB [−0.47 (0.36) mmol/l; P < 0.005] and HBR [−0.55 (0.41) mmol/l; P < 0.005]. Fasting HDL was lower at V2 in all interventions, with the reduction observed in HBR [−0.30 (0.21) mmol/l] greater than that measured in HAMB [−0.13 (0.14) mmol/l; P < 0.005] and NBR [−0.17 (0.15) mmol/l; P < 0.05]. Hypoxia did not alter the adverse effects of bed rest on insulin sensitivity and glucose tolerance but appeared to increase insulin clearance. The negative effect of bed rest on HDL was compounded in hypoxia, which may have implications for long-term health of those living in future space habitats.
NEW & NOTEWORTHY
Physiological changes have been observed during sojourns in space and at altitude. With future space habitats expected to have atmospheres with reduced Po2, this study extends limited existing data on the combined effect of moderate hypoxia and musculoskeletal unloading on metabolic parameters. Hypoxia reduced fasting total cholesterol but compounded the negative effect of bed rest on HDL. Moreover, hypoxia did not alter bed rest-induced reductions in insulin sensitivity and glucose tolerance but increased insulin clearance.
preparations for future space missions, including an interplanetary mission to Mars, have heightened interest in the adverse health effects of prolonged exposure to weightlessness and the development of countermeasures to minimize or eliminate these negative outcomes. Earth-based research has used a bed rest experimental model during which individuals maintain a horizontal or slightly head-down position for extended periods, and the musculoskeletal and cardiovascular deconditioning that arises during these studies mimics those experienced by astronauts during sojourns in space of the same duration (11, 19). Many of the adverse effects of musculoskeletal unloading observed in microgravity, such as muscle wasting, reduced insulin sensitivity, and dyslipidemia, are also seen in sedentary and aging populations on Earth.
To help mitigate the risk of decompression sickness during extravehicular activities, future human habitats at the surface of the moon or Mars are expected to have low operating atmospheric pressure (3, 14). However, to avoid any detrimental effects of the resultant hypoxia among crewmembers, the fraction of oxygen in the habitat atmosphere would need to be increased (3). The consequence of restoring the oxygen partial pressure to normoxic levels would be an increase in the flammability of the gas mixture. Therefore, it is expected that the atmosphere within future space habitats would have a reduced partial pressure of oxygen. Even though it is well known that humans can acclimatize to moderate levels of hypoxia (39), information is scarce as to how different physiological systems may respond to combined chronic exposure to hypoxia and low gravity, and several interactions are envisaged. For example, short-term exposure to hypobaric hypoxia, microgravity sojourns, and inactivity have all been shown independently to reduce the sensitivity of metabolizing tissues to the action of insulin (4, 5, 25, 37), resulting in decreased insulin-stimulated glucose uptake, perhaps attributable to lower abundance of cell surface glucose transporter 4 (GLUT4) receptors (4). However, in vitro studies suggest that insulin-independent glucose uptake is increased in hypoxia (42), with a corresponding elevation in glycolysis to address the hypoxia-inducible factor 1 (HIF-1)-mediated reduction in oxidative phosphorylation (33). Indeed, high-altitude natives tend to display lower blood glucose compared with sea-level residents (8). As such, chronic hypoxic exposure may ameliorate the impaired glucose tolerance that arises from bed rest-induced insulin resistance. Similarly, bed rest and microgravity exposure have given rise to adverse changes to the blood lipid profile, namely increased total cholesterol and decreased HDL and HDL:LDL ratio, which may have long-term implications for the health of those living in future space habitats (27, 32). In comparison, reduction in total and LDL cholesterol has been reported in response to periods at altitude (18, 36), and lower cardiovascular risk has been noted in high-altitude residents (28). It could therefore be hypothesized that hypoxia may blunt the negative effects of bed rest-induced unloading on lipid profile. The present study investigated how insulin sensitivity, glucose tolerance, and circulating lipids were affected by 16 days of exposure to moderate hypoxia and horizontal bed rest in healthy men.
METHODS
This study was part of a larger research program, executed at the Olympic Centre in Planica, Slovenia (located 940 m above sea level), investigating the physiological and psychological effects of simulated planetary habitation on healthy humans (PlanHab: planetary habitat simulation study). Details of the PlanHab protocol have been described previously (16), but, in summary, a randomized, crossover design was employed, with a wash-out period of >4 mo between three interventions, each of 21-day duration; horizontal bed rest in normobaric normoxia [NBR; FiO2 = 0.209; PiO2 = 133.1 (0.3) mmHg] to assess the physiological effects of postural muscle unloading; confinement in normobaric hypoxia combined with daily moderate intensity exercise, to assess the effect of hypoxia and moderate activity [HAMB; FiO2 = 0.141 (0.004); PiO2 = 90.0 (0.4) mmHg; equivalent altitude ∼4,000 m]; horizontal bed rest in a normobaric hypoxic atmosphere to assess any modifying effects of hypoxia on physiological changes induced by inactivity [HBR; FiO2 = 0.141 (0.004); PiO2 = 90.0 (0.4) mmHg]. The present paper describes a protocol executed before confinement (V1) and on the morning of day 17 of each intervention (V2) to investigate the effect of the three conditions on markers of insulin sensitivity (fasting and postprandial) and fasting lipid concentration. The specific environmental and postural requirements for each of the conditions were maintained throughout, and, following completion of V2, participants spent a further 4 days in the respective condition, with each intervention period ending on day 21. The study protocol was approved by the National Committee for Medical Ethics of the Republic of Slovenia and is registered at ClinicalTrials.gov (NCT02293772). All participants provided informed consent before recruitment, and the study was undertaken in accordance with the Declaration of Helsinki.
Participants.
Fourteen healthy, nonobese (BMI <30 kg/m2) men (25–45 yr), who habitually lived close to sea level, were recruited, with 11 completing all three interventions. Three individuals withdrew from the study after completing two interventions, and their data were not included in the analysis. Participant details have been described previously (16), but, in summary, baseline age was 27 (6) yr, body mass 76.7 (11.8) kg, BMI 23.7 (3.0) kg/m2, and total body fat composition 21 (5)%.
Antecedent diet.
Dietary intake and macronutrient composition were standardized throughout each intervention using a repeating 14-day meal plan comprised of foods commonly consumed in the Slovenian diet. To reduce menu fatigue, a variety of different starchy and protein-rich foods were included in the diet, and five portions of fruit and vegetables were provided per day. Individualized energy requirements were calculated using the modified Harris-Benedict resting metabolic rate equation (21) and subsequently multiplied by activity factors of 1.4 for the ambulatory confinement and 1.2 for both bed rest interventions. In addition, the diet delivered a daily protein intake of >1 g protein/kg body wt, with a sodium intake of <3 g per day (16). Food was provided in weighed portions, and subjects were encouraged to eat all food supplied. However, any food not eaten was weighed, and the amount consumed was recorded in a diet analysis program (OPKP Open Platform for Clinical Nutrition). Mean daily energy intake was 2,197 (193) kcal for HAMB, 2,018 (202) kcal for HBR, and 2,027 (188) kcal for NBR. Further details of the dietary intake during PlanHab have been reported previously (16). Participants were given their evening meal 12 h before the current protocol, which was performed in the morning at the same time for each intervention and visit. In the time between the evening meal and attending the laboratory, only water was allowed to be consumed, and individuals had the same meals on the day prior to each study visit, across all three interventions.
Experimental protocol.
On arrival at the laboratory, participants rested quietly on a hospital bed (in the horizontal position) and placed their hand in a heated hand-warming unit (University of Nottingham Medical Engineering Workshop, Nottingham, United Kingdom), with the hand kept in an air temperature of 50–55°C. On V2 of the bed rest interventions, participants were transferred from their bedroom to the bed in the laboratory, via a gurney, maintaining the horizontal position throughout. On V2 of the hypoxic interventions, the participants remained in hypoxia during the transfer, and the laboratory atmosphere for these visits was normobaric hypoxic. An intravenous cannula (20G venflon; Becton Dickinson, Helsingborg, Sweden) was then inserted retrograde into a dorsal hand vein for arterialized venous blood sampling, with cannula patency being maintained using a slow-running 0.9% saline infusion (Baxter, Thetford, United Kingdom).
After 15 min, V̇o2 and V̇co2 were assessed for 20 min using indirect calorimetry and a face mask (Quark CPET; COSMED, Rome, Italy) (16). Thereafter, a breath sample was collected for 13CO2 measurement (see Breath sample analysis below), and a baseline (fasting) blood sample was taken for determination of insulin, c-peptide, lipids [total cholesterol, HDL, LDL, nonesterified fatty acids (NEFA), and triacylglycerol (TAG)], glucose, and lactate concentration. Once baseline measurements had been completed, participants consumed a mixed nutrient milkshake drink (Ensure Plus; 1.5 kcal/ml, Abbott Nutrition) at 5 ml/kg body wt, supplemented with U-13C labeled d-glucose (13C/C >99%; Cambridge Isotope Laboratories, Andover, MA) at 1% of total carbohydrate content (10.1 mg 13C-glucose/kg body wt). Arterialized-venous blood samples were subsequently taken every 10 min for plasma glucose and lactate determination and every 20 min for assessment of insulin and c-peptide concentration, with expired breath samples collected every 15 min and indirect calorimetry measurements made for 15 min in every half hour over the 120-min postprandial study period.
Blood sample analysis.
The blood sample for glucose and lactate assessment was transferred into a fluoride heparin microtube (Sarstedt Group, Sarstedt, Germany), mixed well, then centrifuged (mini centrifuge; Labogene, Lynge, Denmark) at 14,000 g for 1 min. The plasma was removed from the cell pellet, frozen at −80°C, and analyzed at a later date using the glucose oxidase and lactate oxidase methods (YSI Life Sciences, Yellowsprings, OH). Blood for insulin, c-peptide, and total, LDL, and HDL cholesterol analysis was placed into Vacutainer SST tubes (Becton Dickinson, Franklin Lakes, NJ) and left at room temperature for 20 min to clot. These were then centrifuged (Centric 200R; Tehtnica Železniki, Železniki, Slovenia) at 4°C and 1,300 g for 10 min, the serum removed and stored at −80°C until analysis. Serum insulin and c-peptide were assessed using human-specific radioimmuno assays (Merck Millipore, Billerica, MA), with total, LDL, and HDL cholesterol measured using enzymic photometric methods (Horiba Medical, Montpellier, France). The blood sample for fasting TAG and NEFA analysis was split between two lithium heparin vacutainers (LH; Becton Dickinson), to which 75 μl of glutathione/ethylene glycol tetra acetic acid additive (Sigma-Aldrich, St Louis, MO) had been pipetted. Tetrahydrolipostatin (10 μl) was also added to the NEFA tube to inhibit lipase activity. The tubes were immediately centrifuged as described above, and the plasma was removed from the cell pellet for storage at −80°C until analysis at a later date. TAG was assessed using an enzymic photometric method (Horiba Medical), with NEFA analyzed by the ACS-ACOD Method (Wako Diagnostics, Richmond, VA).
Breath sample analysis.
The appearance of 13CO2 in the expired breath was used as a marker of the combined rate of uptake from the gut and oxidation of the test meal. This breath test is based on the principle that an ingested substrate is absorbed and metabolized, and a measurable metabolite is then expelled by the respiratory system. Breath samples were collected by individuals breathing the last portion of their expiration into a 500-ml sampling bag with a one-way valve. To allow analysis of 13C:12C in expired CO2, duplicate 10-ml samples were removed from the breath-sampling bag via a vacutainer hub and luer adaptor (Becton Dickinson) into evacuated tubes (Exotainers; Labco, Lampeter, United Kingdom). These were stored at room temperature until analysis with mass spectrometry (Prism; VG, Manchester, United Kingdom). 13C abundance above baseline levels (atom percentage excess; APE) was determined for all time points according to Slater et al. (34). The molar quantity of CO2 production was calculated using expired V̇co2, the room temperature, and atmospheric pressure measured at each time point and the Ideal Gas Law. The fractional enrichment then allowed the rate of 13CO2 elimination (mmol/min) to be determined at these time points over the 120-min postprandial period, and the quantity of 13C recovered in the breath (mmol) was then estimated by integrating this curve, using the trapezoid method. This figure was subsequently divided by 6 (to account for the universal labeling of the tracer glucose carbon), multiplied by the molecular weight of glucose (to provide the equivalent amount of glucose metabolized), and was expressed as a percentage of the quantity ingested.
Statistical methods and calculations.
All data were coded and analyzed using SPSS version 21.0 (Statistical Package for the Social Sciences 2012). Data were initially checked for normality of distribution using the criteria of a skewness or kurtosis z-score between −1.96 and 1.96. Parametric data in the text are displayed as the means with the standard deviations shown in parentheses, with nonparametric data shown as the median with interquartile range in parentheses. A decrease in a variable at V2, compared with V1, is indicated by a minus sign, with a positive effect indicated by a plus sign. Data displayed in figures are the means, with error bars indicating the standard error of the means. In figures, time point 0 min is the fasting sample, with all other points as the time after eating. Comparison of a variable, at a single time point, across the three interventions, was made using one-way ANOVA, and postprandial profiles of variables across the three interventions were examined using two-way ANOVA tests with repeated measures. Violation of the assumption of sphericity was assessed using Mauchly's test, and where apposite the Greenhouse-Geisser statistic was used to determine significance. If appropriate, post hoc comparisons were subsequently made to assess the effect of hypoxia on responses to bed rest (HBR vs. NBR), and the effect of bed rest on the response to hypoxia (HBR vs. HAMB). Two data points were compared using paired Student's t-test or Wilcoxon signed ranks (as appropriate). Relationships were considered significant when P < 0.05.
Fasting and postprandial c-peptide to insulin molar ratios were calculated to provide an index of hepatic insulin extraction. To address the limitations of this measure in conditions of non-steady state, the area under the incremental postprandial curve for each variable was estimated using the trapezoid method and used to determine the postprandial c-peptide to insulin ratio.
Fasting insulin sensitivity was assessed from fasting insulin and glucose concentration using the Quantitative Insulin Sensitivity Index (QUICKI) (13).
Burning ethanol under normoxic conditions showed an intra-assay coefficient of variation of 1.3% for respiratory exchange ratio (RER) using the Quark C-PET indirect calorimeter. The coefficient of variation for RER, measured in fasted participants, was 4.8 (2.2)% in normoxia and 3.3 (1.4)% in hypoxia. Substrate oxidation rates were calculated according to Peronnet and Massicote (30), with protein oxidation assumed to remain constant and ignored. Fat and carbohydrate (CHO) oxidation rates were standardized for body mass (mg·kg−1·min−1), with postprandial oxidation calculated from the area under the 120-min postprandial fat and CHO oxidation rate curves, respectively (mg/kg).
RESULTS
Plasma glucose.
In each intervention, following the consumption of the liquid meal, plasma glucose increased from a mean (SD) fasting value of 4.9 (0.34) mmol/l to a mean peak of 7.7 (0.85) mmol/l at a median time of 30 (20) min, range 20–60 min, after consuming the liquid meal. A reduction in fasting plasma glucose was observed on day 17 (V2) of HAMB, compared with preintervention values (P < 0.05), whereas this variable did not change significantly after 16 days of bed rest in either normoxia or hypoxia (Table 2). There was a difference across these fasting plasma glucose responses to the three interventions (1-way ANOVA; P < 0.05), and post hoc analysis indicated a tendency for glucose concentration to be lower in HAMB than in HBR (P = 0.083; statistical power 58%). At V2, postprandial plasma glucose was significantly increased from V1 in both bed rest interventions (NBR and HBR: 2-way ANOVA; visit P < 0.05 in each case) but appeared unchanged after 16 days of ambulatory confinement in hypoxia (Fig. 1). This resulted in a significant difference, between HBR and HAMB, in the change in postprandial glucose profile seen at V2 compared with that at V1 (2-way ANOVA; intervention P < 0.05).
Table 2.
Change in fasting variables at day 17, compared with preintervention
| Variable | HAMB | HBR | NBR |
|---|---|---|---|
| Plasma glucose, mmol/l | −0.17 (0.22)* | +0.15 (0.43) | +0.17 (0.39) |
| Plasma lactate, mmol/l | +0.113 (0.19) | +0.072 (0.26) | −0.001 (0.25) |
| Serum insulin, pmol/l | −8.40 (13.76)* | −3.23 (17.27) | +10.55 (19.31) |
| Serum c-peptide, pmol/l | +80.8 (70.0)* | +66.3 (37.3)* | +42.84 (36.7)* |
| QUICKI | +0.010 (0.009)*† | −0.001 (0.012) | −0.010 (0.016) |
| C-peptide:insulin | +1.87 (1.11)* | +1.06 (0.97)* | −0.04(0.59)† |
| Serum total cholesterol, mmol/l | −0.47 (0.36)* | −0.55 (0.41)* | −0.20 (0.39)† |
| Serum HDL cholesterol, mmol/l | −0.13 (0.14)*† | −0.30 (0.21)* | −0.17 (0.15)*† |
| Serum LDL cholesterol, mmol/l | −0.25 (0.34)* | −0.17 (0.40) | +0.02 (0.37) |
| Total:HDL cholesterol | −0.07 (0.49)† | +0.53 (0.69)* | +0.41 (0.61) |
| Plasma NEFA, mmol/l | +0.05 (0.15) | +0.10 (0.13)* | −0.04 (0.16) |
| Plasma TAG, mmol/l | −0.17 (0.09)* | −0.11 (0.16) | −0.14 (0.45) |
| Fat oxidation rate, mg·kg−1·min−1 | +0.45 (0.20) | +0.49 (0.23) | −0.43 (0.20) |
| Carbohydrate oxidation rate, mg·kg−1·min−1 | −0.93 (1.30)* | −0.88 (1.47) | +0.81 (1.23)† |
A decrease in values from preintervention is indicated by a minus, whereas an increase is shown by a plus sign. Data are the means (SD).
Statistically significant change from preintervention,
change significantly different from HBR. Individual P values are described in the text.
Fig. 1.

Plasma glucose profiles observed before (V1) and at day 17 (V2) of interventions, in response to consumption of a mixed-nutrient liquid meal (1 g carbohydrate/kg body wt). At V2, postprandial plasma glucose was significantly increased from V1 in both bed rest interventions [normobaric normoxia (NBR) and normobaric hypoxia (HBR): 2-way ANOVA; visit P < 0.05 in each case]. The change in postprandial glucose profile (at V2 compared with V1) in HBR differed from normobaric hypoxia combined with daily moderate intensity exercise (HAMB) (2-way ANOVA; intervention P < 0.05).
Plasma lactate.
Mean fasting plasma lactate concentration was comparable before the interventions. At V1 in NBR, this variable increased from a mean fasting value of 0.79 (0.33) mmol/l to a mean peak of 1.45 (0.31) mmol/l at median time of 60 (10) min, range 40–70 min. In HBR, fasting lactate was 0.80 (0.28) mmol/l and peak 1.50 (0.30) mmol/l at 50 (20) min, range 40–60 min, with these values as 0.72 (0.19) mmol/l, 1.58 (0.33) mmol/l, and at 60 (30) min, range 40–80 min for HAMB. No change in fasting plasma lactate concentration was observed at V2 in the bed rest conditions, whereas a trend for fasting lactate to increase was noted at V2 in HAMB (P = 0.071; Table 2). Postprandial plasma lactate increased as a result of 16 days in HBR (2-way ANOVA; visit P < 0.001), with a higher peak (P < 0.05) and later time to peak (P < 0.005) resulting in a different postprandial profile at V2 compared with V1 (2-way ANOVA; visit × time P < 0.001). Moreover, postprandial lactate response, and change in this profile from V1, was greater in HBR compared with NBR (2-way ANOVA; intervention P < 0.05 in each case). Postprandial lactate concentration and response did not differ from preintervention in HAMB, and, although postprandial concentration and time to peak did not change significantly in NBR, the plasma lactate profile in response to eating did appear to differ at V2 (2-way ANOVA; visit × time P < 0.01).
Serum c-peptide.
Fasting c-peptide and postprandial concentrations of this variable at V1 were similar across all three interventions (see Table 1 and Fig. 2). However, fasting c-peptide concentration was higher at day 17 of all interventions (P < 0.005 in all cases; Table 2). Showing a similar pattern to that seen for plasma glucose, postprandial serum c-peptide concentration at V2 was significantly higher than V1 in both bed rest interventions (2-way ANOVA; visit P ≤ 0.001) but appeared unchanged after 16 days of HAMB. However, in the HAMB intervention, there was a weak trend for the postprandial response of serum c-peptide concentration to be different at V2 (2-way ANOVA; visit × time P = 0.091) although peak concentration and time to peak were not different (Fig. 2).
Table 1.
Fasting values for variables before the interventions (V1)
| Variable | HAMB | HBR | NBR |
|---|---|---|---|
| Plasma glucose, mmol/l | 5.03 (0.35) | 4.82 (0.33) | 4.84 (0.33) |
| Plasma lactate, mmol/l | 0.72 (0.19) | 0.80 (0.28) | 0.79 (0.33) |
| Serum insulin, pmol/l | 72.72 (19.32) | 74.57 (25.80) | 65.98 (19.07) |
| Median serum c-peptide, pmol/l | 280.5 (217.2) | 260.1 (69.3) | 188.0 (100.1) |
| QUICKI | 0.331 (0.013) | 0.333 (0.016) | 0.338 (0.016) |
| C-peptide:insulin | 4.16 (1.73) | 4.18 (1.32) | 3.50 (1.35) |
| Serum total cholesterol, mmol/l | 4.13 (0.57) | 4.31 (0.57) | 4.10 (0.52) |
| Serum HDL cholesterol, mmol/l | 1.13 (0.30) | 1.17 (0.32) | 1.14 (0.26) |
| Serum LDL cholesterol, mmol/l | 2.45 (0.52) | 2.53 (0.51) | 2.39 (0.43) |
| Total:HDL cholesterol | 3.82 (0.87) | 3.89 (0.90) | 3.72 (0.74) |
| Median plasma NEFA, mmol/l | 0.383 (0.257) | 0.326 (0.217) | 0.371 (0.159) |
| Median plasma TAG, mmol/l | 0.75 (0.28) | 0.92 (0.40) | 0.78 (0.21) |
| Median fat oxidation rate, mg·kg−1·min−1 | 1.40 (0.69) | 1.28 (0.96) | 1.38 (0.59) |
| Median carbohydrate oxidation rate, mg·kg−1·min−1 | 1.56 (0.92) | 1.88 (1.72) | 1.39 (0.71) |
Data are the means (SD), unless otherwise indicated. Median data are expressed with interquartile range in parentheses. There was no difference in fasting data at V1 (P > 0.05 in each case). HAMB, normobaric hypoxia combined with daily moderate intensity exercise; HBR, normobaric hypoxia; NBR, normobaric normoxia; QUICKI, Quantitative Insulin Sensitivity Index; NEFA, nonesterified fatty acids; TAG, triacylglycerol.
Fig. 2.
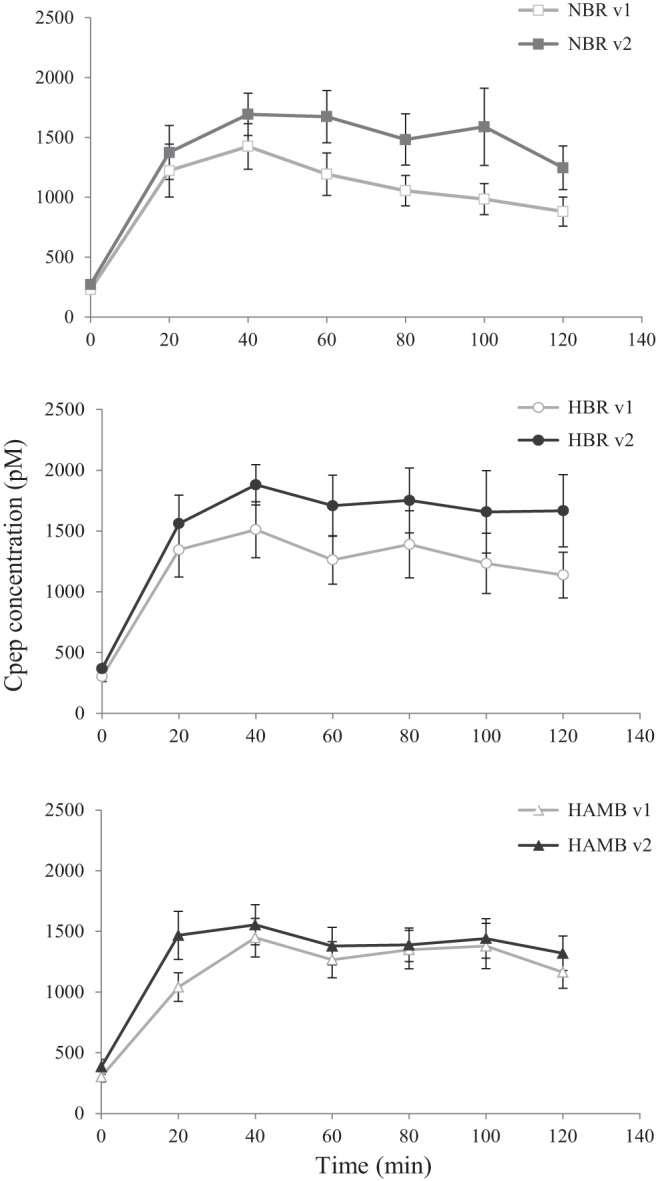
Serum c-peptide profiles observed at V1 and V2 in response to the liquid meal. Postprandial c-peptide concentration was significantly higher at V2 in NBR and HBR (2-way ANOVA; visit P ≤ 0.001).
Serum insulin.
There was no difference in mean fasting serum insulin concentration before HAMB, HBR, and NBR (Table 1). A reduction in fasting insulin, from preintervention values, was observed on day 17 of HAMB (P = 0.05), with no significant change from V1 seen on V2 of HBR or NBR (Table 2). There was a trend for these fasting insulin responses across the three interventions to differ (1-way ANOVA; P = 0.065) although post hoc comparison suggests that the fasting serum insulin responses to the intervention were not different between HBR and NBR, or between HAMB and HBR.
Postprandial concentrations of serum insulin at V1 were similar across all three interventions, with serum insulin, at V1, rising to a mean peak of 692 (275.0) pmol/l at a median time of 40 (20) min, range 20–60 min, after consumption of the liquid meal. At V2, postprandial serum insulin was significantly increased from V1 in NBR (2-way ANOVA; visit P < 0.005) but was not different after 16 days in either of the hypoxic conditions. However, there was a trend for the serum insulin postprandial response to differ at V2 of HAMB (2-way ANOVA; visit × time P = 0.067), with an earlier time to peak compared with V1 (P < 0.05; Fig. 3).
Fig. 3.

Serum insulin concentration, observed at V1 and V2 in response to consumption of a mixed-nutrient liquid meal. Postprandial insulin concentration was significantly elevated at V2 of NBR (2-way ANOVA: visit P < 0.005).
Fasting insulin sensitivity.
QUICKI values were not different before HAMB, HBR, and NBR, but there was a difference in the change to QUICKI values that occurred as a result of the three interventions (1-way ANOVA; P < 0.01; Table 2). After 16 days in hypoxic confinement, an increase in this variable was observed (P < 0.01). QUICKI did not change as a result of HBR, but there was a strong trend for this surrogate for fasting insulin sensitivity to be negatively affected in NBR (P = 0.053). This resulted in a significant difference between the change to QUICKI in HAMB compared with that in HBR (P < 0.05; Table 2), with no statistical difference seen between NBR and HBR.
C-peptide to insulin ratio.
Fasting c-peptide to insulin ratio was comparable at V1 across the three interventions (Table 1). At V1, postprandial c-peptide to insulin ratio was 3.09 (0.68) for NBR, 2.81 (0.72) for HBR, and 3.02 (0.76) for HAMB, with no significant difference seen between interventions. Sixteen days of bed rest in normoxia did not affect these variables [fasting: see Table 2; postprandial: effect size −0.14 (0.54)]. However, fasting c-peptide to insulin ratio increased both in HBR and HAMB (P < 0.005 in each case; Table 2), with an increase in this ratio in the postprandial period observed at V2 in both of the hypoxic conditions [HBR: effect size +0.74 (0.68); P < 0.005, and HAMB: effect size +0.70 (0.63); P < 0.005]. These changes resulted in a significant increase in c-peptide to insulin ratio, as a result of bed rest in hypoxia (HBR) compared with bed rest alone (NBR), both in the fasted state (P < 0.005) and in the 120-min postprandial period (P < 0.01).
Substrate oxidation.
Fasting fat oxidation rate before each intervention was similar (Table 1). At V2, there was a trend for this variable to be lower in NBR (P = 0.075) and higher in the hypoxic conditions (HBR P = 0.057; HAMB P = 0.051; Table 2). Fat oxidation rate changed over the postprandial periods (2-way ANOVA; time P < 0.05 in each case), with no difference seen in these postprandial responses at V1. Total fat oxidation at V1, calculated over the 120-min postprandial period, was 188.74 (53.14) mg/kg for NBR, 141.82 (51.69) mg/kg for HBR, and 152.50 (35.18) mg/kg for HAMB. This variable was significantly higher at day 17 of hypoxia [HBR: effect size +60.0 (70.5) mg/kg; P < 0.05 and HAMB: effect size +57.0 (44.7) mg/kg; P < 0.005] although unchanged in NBR [effect size −20.6 (61.6) mg/kg]. This resulted in a significant effect of intervention on this variable (1-way ANOVA; P < 0.05), with the increase in 120-min postprandial fat oxidation seen in HBR greater than the lack of change observed in NBR (P < 0.05).
Before each intervention, there was no difference in fasting CHO oxidation rate (Table 1). At V2, this variable was reduced in HAMB (P < 0.05), and there was a trend for it to be higher in NBR (P = 0.053) and lower in HBR (P = 0.075). See Table 2. At each V1, CHO oxidation rate increased in response to eating (2-way ANOVA; time P < 0.05 in each case), with no difference seen in these postprandial responses before the interventions. CHO oxidation at visit 1, calculated over the 120-min postprandial period, was 238.77 (76.77) mg/kg for NBR, 344.13 (131.08) mg/kg for HBR, and 286.93 (55.72) mg/kg for HAMB. This variable was significantly lower at day 17 of hypoxia [HBR: effect size −140.9 (157.6) mg/kg; P < 0.05, and HAMB: effect size −108.9 (63.7) mg/kg; P < 0.001] although unchanged in NBR [effect size +26.0 (112.7) mg/kg]. This resulted in a significant effect of condition on this variable (1-way ANOVA; P < 0.05), with the reduction in 120-min postprandial CHO oxidation seen in HBR different from the absence of change observed in NBR (P < 0.05).
Breath analysis.
At both visits for each intervention, 13C enrichment of expired CO2 increased over the postprandial period to a 120-min value of ∼0.15 APE. Postprandial APE was similar across the three conditions at V1, and no change in this variable occurred at V2 in any of the conditions. The proportion of ingested 13C-labeled glucose that was recovered in the breath at V1 was 4.12 (1.36)% for NBR, 4.70 (2.19%) for HBR, and 3.80 (0.88)% for HAMB, with no significant difference seen between interventions. A significant change in the proportion of ingested 13C-labeled glucose that was recovered in the breath was not observed at V2 for any of the interventions [NBR: effect size −0.27 (1.82); HBR: effect size −0.52 (2.07); HAMB: effect size +0.23 (0.73)], and these responses to the three interventions did not differ.
Fasting lipids.
Before the interventions, individual serum total cholesterol concentration in the current cohort was between 3.36 and 5.40 mmol/l, and there was no difference in the mean serum concentrations at V1 across the interventions (Table 1). A significant fall in total cholesterol was observed at V2 in the hypoxic conditions [HBR: −12.18 (9.41)%, and HAMB: −10.84 (8.01)%; P < 0.005 in each case], whereas no significant change from V1 occurred in NBR (Table 2). When the change in fasting total cholesterol (from V1) was compared between the two bed rest interventions, the addition of hypoxia resulted in a reduction in circulating total cholesterol concentration (P < 0.01).
Serum HDL at V1 was similar across the three interventions (Table 1). HDL fell significantly at day 17 of all interventions (P < 0.01 for each condition; Table 2), with the magnitude of this reduction greatest in HBR, compared with both HAMB (P < 0.005) and NBR (P < 0.05).
There was no difference in the ratio of total to HDL cholesterol at V1 across the interventions (Table 1). This ratio increased at V2 (from preintervention) as a result of HBR (P < 0.05), with a strong trend for it also to be higher in NBR (P = 0.053). However, there was no change in total:HDL cholesterol at day 17 of HAMB (Table 2). When the change in this ratio was compared across the three interventions, there was a significant effect of condition (1-way ANOVA; P < 0.05), with the response in HBR different to that seen in HAMB (P < 0.05).
Fasting serum LDL concentrations across the interventions were comparable at V1, and, as a result of the intervention, there was a fall in this variable with HAMB (P < 0.05) but no significant change seen in the bed rest conditions. When the change in LDL (from V1) was compared across the three interventions, there was no difference in the response (Table 2).
Plasma NEFA concentration at V1, when fasted, was similar across all interventions (Table 1). This variable increased at V2 (from preintervention) as a result of HBR (P < 0.05). However, there was no change in fasting NEFA concentration at day 17 of NBR or HAMB (Table 2). When the change in NEFA was compared across the three interventions, there was no effect of condition although there was a trend for the response in HBR to be different from that seen in NBR (P = 0.075).
There was no difference in the plasma TAG concentration, across intervention, at V1. This variable decreased at V2 as a result of HAMB (P < 0.001), with a strong trend for reduced TAG concentration to occur as a result of HBR (P = 0.054). However, there was no change in fasting TAG at day 17 of NBR (Table 2). When the change in circulating TAG was compared across the three interventions, there was no effect of condition.
DISCUSSION
Many challenges face personnel undertaking long-duration space flight and future planetary habitation. Microgravity induces physiological changes, which could compromise the crew members' long-term health and working ability. The present study investigated the effect of combined chronic exposure to hypoxia and bed rest (to simulate low-gravity states) on glucose tolerance and associated metabolic variables. We found that postprandial plasma glucose response was increased by bed rest, an effect that was not ameliorated by hypoxia, and that increased clearance of insulin (estimated from the change in C-peptide:insulin ratio) occurred in both hypoxic environments. In addition, 16 days of bed rest resulted in a decrease (in the fasted state) in the share of total cholesterol contributed by HDL and an increase in the share contributed by LDL. Although the addition of hypoxia to bed rest reduced fasting serum total cholesterol concentration, the long-term clinical significance of this, in the presence of a lower HDL:LDL ratio, is not clear (6, 24).
As a simulation of the proposed planetary environment, the hypoxic bed rest model used in the present study is by no means a perfect mimetic. Both with regards to the level of hypoxia and the degree of musculoskeletal unloading/inactivity, the present stimuli conditions were exaggerated compared with those anticipated in lunar or planetary habitats. Moreover, planetary habitat atmospheres are likely to be hypobaric, rather than normobaric hypoxic (3), and it cannot be excluded that certain responses to the former may differ from those to the latter (12, 20). However, the normobaric hypoxic bed rest model allowed standardization of potential confounding factors, which are more difficult to control in studies conducted at altitude (such as temperature, physical activity, nutritional intake), and, despite the limitations of the model, the insulin sensitivity and fasting lipid responses observed in NBR and HAMB matched those previously reported in microgravity and in hypobaric hypoxia (or at altitude), respectively (see below for more details).
Insulin sensitivity.
Classically, as insulin sensitivity falls, circulating insulin concentration increases to maintain normal glucose tolerance, and this appears to be due to both increased secretion and reduced clearance of insulin (9). C-peptide and insulin are secreted in equimolar concentrations from pancreatic β-cells although insulin has a shorter half-life in the body (7) and c-peptide appearance in the circulation, thus providing a useful indication of insulin secretion, albeit semiquantitative (31). As insulin resistance develops, circulating insulin ceases to be able to control blood glucose concentration, and blood glucose rises. In the present study, postprandial glucose, insulin, and c-peptide concentrations were increased at V2 in NBR, suggesting that insulin sensitivity was lower after 16 days of horizontal bed rest in normoxia. Indeed, the index of fasting insulin sensitivity (QUICKI) was also reduced in this intervention, and this observation of lower glucose tolerance and development of insulin resistance is corroborated by other bed rest studies and investigations of crewmembers following different periods of space travel (4, 37). Interestingly, 16 days of bed rest in hypoxia also resulted in higher postprandial plasma glucose, but this was not accompanied by a rise in circulating insulin, as seen in NBR. However, although no change in circulating insulin was observed, a similar c-peptide response as that reported for NBR occurred, suggesting that a stimulus for insulin secretion was indeed evident in HBR but that increased clearance of insulin was occurring in the hypoxic bed rest condition. This was reflected in an increase in the c-peptide to insulin ratio, both when fasted and over the 120-min postprandial period, whereas, at V2 in the NBR condition, insulin clearance did not appear to be affected. Although there are limitations with c-peptide:insulin as an index of insulin clearance, especially in non-steady state situations, it is noteworthy that a postprandial elevation in this ratio, of similar magnitude to that induced by HBR, was also observed at day 17 of the HAMB intervention, in the absence of significant changes to circulating c-peptide levels. These observations are not unprecedented, as it has been suggested that those living at altitude may display higher hepatic insulin clearance than those residing at sea level (5).
In the normobaric HAMB, the exercise regimen was designed to maintain the participants' habitual daily energy expenditure, so that detraining did not occur over the confinement period. This intervention appeared to conserve the individuals' postprandial insulin sensitivity, as neither insulin nor glucose measures in the fed state changed significantly after the 16 days. Indeed, there was some suggestion that fasting insulin sensitivity may have been improved. Those living at high altitude have been shown to have lower blood glucose compared with age- and weight-matched lowlanders (8), and these observations have been attributed to an increase in glycolysis and augmentation of insulin-independent glucose uptake, both mediated through the effects of HIF-1α (26, 42). In the present study, fasting glucose was significantly lower after 16 days in hypoxia (HAMB), giving credence to the notion of increased insulin-independent glucose uptake, and was accompanied by a trend for lactate to be higher, the latter perhaps indicating that glycolysis was also increased. However, in the insulin-stimulated state, blood glucose concentration in HAMB did not differ from the preintervention value, and, similar to in other reports, postprandial glucose and lactate profiles did not provide convincing evidence that postprandial glycolysis was significantly increased in hypoxia (22). In contrast, in the bed rest conditions, in which reduced insulin-stimulated uptake may be occurring, postprandial lactate concentration in HBR was greater than in NBR although the addition of hypoxia did not appear to diminish the elevation in blood glucose concentration induced by bed rest in NBR in the fed or fasted state or to affect the rate of appearance of 13CO2 in the breath from breakdown of ingested 13C-glucose.
Fasting lipids.
Dyslipidemia is associated with an increased risk of cardiovascular disease, and a beneficial lipid profile has been characterized as total cholesterol <5.2 mmol/l, LDL <2.6 mmol/l, HDL >1.0 mmol/l, and a total cholesterol to HDL ratio of <4.5 (1). The diet and meal pattern were standardized in the present study, with macronutrient composition of the diet and energy balance the same across all interventions to reduce their impact on cholesterol homeostasis (16). Before the interventions, only one participant had a total cholesterol above the healthy range, with five having raised LDL, as defined in the 2015 NCEP guidelines (1). However, elevation of these variables in these individuals was mild and below the threshold for clinical intervention.
Reduced total and LDL cholesterol have been observed following 17 days at high altitude (18), whereas HDL concentration has been shown to increase (36, 38), decrease (35), or stay the same (18) in response to moderate or high altitude. Moreover, those acclimatized to living at 3,500 m demonstrate lower total, LDL, and HDL cholesterol than those of comparable ethnic origin living at 1,000 m (15). Similarly, after 16 days in the HAMB condition, a reduction in total, LDL, and HDL cholesterol was observed although the ratio of total cholesterol to HDL did not change. The results observed in the HAMB group provide further support to the previously observed phenomena that moderate activity during hypoxic exposure might improve the lipid profile (17). In HBR, a reduction in total and HDL cholesterol was again seen. However, contrary to in HAMB, a significant decrease in the proportion of total cholesterol that was HDL was noted. Differences in diet or energy balance are unlikely to be driving the reduction in total cholesterol observed in HAMB and HBR, as a fall in this measure was not seen in NBR, macronutrient composition of the diet was not different, and changes to body fat mass were not noted across the interventions (16). Moreover, there was no indication that dietary fat absorption was compromised in the hypoxic conditions. Other potential explanations for the reduction in circulating total cholesterol in HAMB and HBR include increased cellular uptake, increased utilization, accumulation within cells, and reduced synthesis. Although uptake into cells does not appear to increase in hypoxia (2), in the present study, fat oxidation in the fed state was higher at V2 in the hypoxic conditions, with a strong trend for this to be higher also in the fasted state. Moreover, increased accumulation and reduced synthesis may also be pertinent to the hypoxic state. Although in vitro studies cannot faithfully reproduce the in vivo hypoxic condition, suppression of sterol biosynthesis and reduced cholesterol efflux have been reported in rabbit fibroblasts, human aortic tissue segments, and human arterial intima cells cultured in hypoxia (29).
During space flight, total cholesterol showed a tendency to increase, with a decrease in HDL and HDL:LDL ratio (27), whereas, after 21 days of bed rest (with head-down tilt), total cholesterol was seen to decrease (43), with HDL also falling in response to short- (32) and medium-term bed rest (40). However, Zwart et al. (43) attributed the fall in total cholesterol to a reduced dietary fat intake during their bed rest intervention. In NBR, a significant change in fasting total cholesterol was not observed, but the reduction in HDL did manifest. Although we cannot confirm the mechanism for this, inactivity has been associated with a decline in lipoprotein lipase activity in the skeletal muscle in response to feeding, which leads to decrements in TAG hydrolysis from TAG-rich lipoproteins, reduced release of substrate for HDL particle maturation (10, 41), and lower circulating HDL levels (41); observations are also reported in bed rest studies (40). However, those with genetic impairment in lipoprotein lipase activity also demonstrate markedly elevated TAG, which was not observed in the present study. It is interesting to note that, in HBR, the reduction in HDL was significantly greater than that recorded in either NBR or HAMB, but the change in total:HDL ratio was of a similar magnitude in both bed rest conditions. This suggests that bed rest and hypoxia had an additive effect on the fall in circulating HDL and that different mechanisms were responsible for these decrements in NBR and HAMB. In each bed rest condition, an increase in the proportion of total cholesterol that was LDL and reduction in that which was HDL occurred, and this more negative lipid profile is often associated with insulin resistance states and cardiovascular disease (23). Indeed, although the numbers were low, the bed rest interventions resulted in an increase in the number of individuals with a total:HDL ratio in the range associated with increased long-term risk of developing cardiovascular disease (23), and this might have implications for the health of those inhabiting future space habitats.
In conclusion, normobaric hypoxia does not appear to ameliorate the negative effects of a simulated condition of microgravity on insulin sensitivity and glucose tolerance, but neither does it worsen these changes. However, further investigations on the implications of HDL cholesterol reduction seen in HBR, on longer-term health risks, may be warranted.
GRANTS
The study was funded by the European Union Programme FP7 (PlanHab project; grant no. 284438), the European Space Agency (ESA) Programme for European Cooperating States (ESTEC/contract no. 40001043721/11/NL/KML: Planetary Habitat Simulation), and the Slovene Research Agency (contract no. L3-3654: Zero and reduced gravity simulation: the effect on the cardiovascular and musculoskeletal systems). The work at the University of Nottingham was supported by an infrastructure award from MRC/ARUK Centre for Musculoskeletal Ageing Research (grant no. MR/K00414X/1 and 19891 2012 −2017) to establish a center of excellence in musculoskeletal aging research.
DISCLOSURES
No conflicts of interest, financial or otherwise, are declared by the authors.
AUTHOR CONTRIBUTIONS
Author contributions: E.J.S. and T.D. performed experiments; E.J.S. analyzed data; E.J.S. interpreted results of experiments; E.J.S. prepared figures; E.J.S. drafted manuscript; E.J.S., T.D., O.E., I.B.M., and I.A.M. edited and revised manuscript; E.J.S., T.D., O.E., I.B.M., and I.A.M. approved final version of manuscript; O.E., I.B.M., and I.A.M. conception and design of research.
ACKNOWLEDGMENTS
The authors acknowledge Ms. Iva Kumprej for excellent assistance with data collection, Mrs. Sally Cordon for the analysis of lipid parameters, insulin, and c-peptide, and Dr. Kenny Smith for analyzing the 13CO2 in breath samples. We also thank the devoted participants, without whom this study would not have been possible.
REFERENCES
- 1. Third Report of the National Cholesterol Education Program (NCEP) Expert Panel on Detection, Evaluation, and Treatment of High Blood Cholesterol in Adults (Adult Treatment Panel III) final report. Circulation 106: 3143–3421, 2002. [PubMed] [Google Scholar]
- 2.Albers JJ, Bierman EL. The effect of hypoxia on uptake and degradation of low density lipoproteins by cultured human arterial smooth muscle cells. Biochim Biophys Acta 424: 422–429, 1976. [DOI] [PubMed] [Google Scholar]
- 3.Bacal K, Beck B, Barratt MR. Hypoxia, hypercarbia and atmospheric control. In: Principles of Clinical Medicine for Space Flight, edited by Barratt MR and Pool SL. New York, NY: Springer Science and Business Media, 2008, p. 445–474. [Google Scholar]
- 4.Biensø RS, Ringholm S, Kiilerich K, Aachmann-Andersen NJ, Krogh-Madsen R, Guerra B, Plomgaard P, van Hall G, Treebak JT, Saltin B, Lundby C, Calbet JAL, Pilegaard H, Wojtaszewski JFP. GLUT4 and glycogen synthase are key players in bed rest-induced insulin resistance. Diabetes 61: 1090–1099, 2012. [DOI] [PMC free article] [PubMed] [Google Scholar]
- 5.Braun B, Rock PB, Zamudio S, Wolfel GE, Mazzeo RS, Muza SR, Fulco CS, Moore LG, Butterfield GE. Women at altitude: short-term exposure to hypoxia and/or α1-adrenergic blockade reduces insulin sensitivity. J Appl Physiol 91: 623–631, 2001. [DOI] [PubMed] [Google Scholar]
- 6.Briel M, Ferreira-Gonzalez I, You JJ, Karanicolas PJ, Akl EA, Wu P, Blechacz B, Bassler D, Wei X, Sharman A, Whitt I, Alves da Silva S, Khalid Z, Nordmann AJ, Zhou Q, Walter SD, Vale N, Bhatnagar N, O'Regan C, Mills EJ, Bucher HC, Montori VM, Guyatt GH. Association between change in high density lipoprotein cholesterol and cardiovascular disease morbidity and mortality: systematic review and meta-regression analysis. BMJ 338: b92, 2009. [DOI] [PMC free article] [PubMed] [Google Scholar]
- 7.Castillo MJ, Scheen AJ, Letiexhe MR, Lefèbvre PJ. How to measure insulin clearance. Diabetes Metab Rev 10: 119–150, 1994. [DOI] [PubMed] [Google Scholar]
- 8.Castillo O, Woolcott OO, Gonzales E, Tello V, Tello L, Villarreal C, Mendez N, Damas L, Florentini E. Residents at high altitude show a lower glucose profile than sea-level residents throughout 12-hour blood continuous monitoring. High Alt Med Biol 8: 307–311, 2007. [DOI] [PubMed] [Google Scholar]
- 9.Cavaghan MK, Ehrmann DA, Polonsky KS. Interactions between insulin resistance and insulin secretion in the development of glucose intolerance. J Clin Invest 106: 329–333, 2000. [DOI] [PMC free article] [PubMed] [Google Scholar]
- 10.Clee SM, Zhang H, Bissada N, Miao L, Ehrenborg E, Benlian P, Shen GX, Angel A, LeBoeuf RC, Hayden MR. Relationship between lipoprotein lipase and high density lipoprotein cholesterol in mice: modulation by cholesteryl ester transfer protein and dietary status. J Lipid Res 38: 2079–2089, 1997. [PubMed] [Google Scholar]
- 11.Convertino VA. Exercise and adaptation to microgravity environments. In: Handbook of Physiology, Sect 4: Environmental Physiology, edited by Fregley and Blatteis. Oxford, United Kingdom: Oxford University, 1996, p. 815–843. [Google Scholar]
- 12.Coppel J, Hennis P, Gilbert-Kawai E, Grocott MP. The physiological effects of hypobaric hypoxia versus normobaric hypoxia: a systematic review of crossover trials. Extreme Physiol Med 4: 2, 2015. [DOI] [PMC free article] [PubMed] [Google Scholar]
- 13.Cutfield WS, Jefferies CA, Jackson WE, Robinson EM, Hofman PL. Evaluation of HOMA and QUICKI as measures of insulin sensitivity in prepubertal children. Pediatr Diabetes 4: 119–125, 2003. [DOI] [PubMed] [Google Scholar]
- 14.David B, Paul E, Kenneth B. A human lunar surface base and infrastructure solution. In: Space 2006. Reston, VA: American Institute of Aeronautics and Astronautics, 2006. [Google Scholar]
- 15.de Mendoza S, Nucete H, Ineichen E, Salazar E, Zerpa A, Glueck CJ. Lipids and lipoproteins in subjects at 1,000 and 3,500 meter altitudes. Arch Environ Health 34: 308–311, 1979. [DOI] [PubMed] [Google Scholar]
- 16.Debevec T, Bali TC, Simpson EJ, Macdonald IA, Eiken O, Mekjavic IB. Separate and combined effects of 21-day bed rest and hypoxic confinement on body composition. Eur J Appl Physiol 114: 2411–2425, 2014. [DOI] [PubMed] [Google Scholar]
- 17.Debevec T, Simpson EJ, Macdonald IA, Eiken O, Mekjavic IB. Exercise training during normobaric hypoxic confinement does not alter hormonal appetite regulation. PLoS One 9: e98874, 2014. [DOI] [PMC free article] [PubMed] [Google Scholar]
- 18.Férézou J, Richalet JP, Coste T, Rathat C. Changes in plasma lipids and lipoprotein cholesterol during a high altitude mountaineering expedition (4800 m). Eur J Appl Physiol 57: 740–745, 1988. [DOI] [PubMed] [Google Scholar]
- 19.Fortney SM, Schneider VS, Greenleaf JE. The physiology of bedrest. In: Handbook of Physiology, Sect 4: Environmental Physiology, edited by Fregley and Blatteis. Oxford, United Kingdom: Oxford University, 1996, p. 889–939. [Google Scholar]
- 20.Girard O, Koehle MS, Guenette JA, Verges S, Chapman RF, Conkin J, Nespoulet H, Casey DP, Taylor BJ, Laymon AS, Loeppky JA, Pun M, Schommer K, Vagula MC, MacInnis MJ, Koehle MS, Rupp T, Jubeau M, Perrey S, Millet GY, Levine BD, Wessel JH, Wuyam B, Tamisier R, Verges S, Levy P, Snyder EM, Johnson BD, Stickford JL, Weavil JC, Bartsch P, Nelatury CF. Comments on Point:Counterpoint: Hypobaric hypoxia induces/does not induce different responses from normobaric hypoxia. J Appl Physiol 112: 1788–1794, 2012. [DOI] [PMC free article] [PubMed] [Google Scholar]
- 21.Hasson RE, Howe CA, Jones BL, Freedson PS. Accuracy of four resting metabolic rate prediction equations: effects of sex, body mass index, age, and race/ethnicity. J Sci Med Sport 14: 344–351, 2011. [DOI] [PubMed] [Google Scholar]
- 22.Horscroft JA, Murray AJ. Skeletal muscle energy metabolism in environmental hypoxia: climbing towards consensus. Extreme Physiol Med 3: 19, 2014. [DOI] [PMC free article] [PubMed] [Google Scholar]
- 23.Jeppesen J, Facchini FS, Reaven GM. Individuals with high total cholesterol/HDL cholesterol ratios are insulin resistant. J Intern Med 243: 293–298, 1998. [DOI] [PubMed] [Google Scholar]
- 24.Lamarche B, Despres JP, Moorjani S, Cantin B, Dagenais GR, Lupien PJ. Prevalence of dyslipidemic phenotypes in ischemic heart disease (prospective results from the Quebec cardiovascular study). Am J Cardiol 75: 1189–1195, 1995. [DOI] [PubMed] [Google Scholar]
- 25.Larsen JJ, Hansen JM, Olsen NV, Galbo H, Dela F. The effect of altitude hypoxia on glucose homeostasis in men. J Physiol 504: 241–249, 1997. [DOI] [PMC free article] [PubMed] [Google Scholar]
- 26.Lecoultre V, Peterson CM, Covington JD, Ebenezer PJ, Frost EA, Schwarz JM, Ravussin E. Ten nights of moderate hypoxia improves insulin sensitivity in obese humans. Diabetes Care 36: e197–e198, 2013. [DOI] [PMC free article] [PubMed] [Google Scholar]
- 27.Markin A, Strogonova L, Balashov O, Polyakov V, Tigner T. The dynamics of blood biochemical parameters in cosmonauts during long-term space flights. Acta Astronaut 42: 247–253, 1998. [DOI] [PubMed] [Google Scholar]
- 28.Mortimer EA, Monson RR, MacMahon B. Reduction in mortality from coronary heart disease in men residing at high altitude. N Engl J Med 296: 581–585, 1977. [DOI] [PubMed] [Google Scholar]
- 29.Mukodani J, Ishikawa Y, Fukuzaki H. Effects of hypoxia on sterol synthesis, acyl-CoA:cholesterol acyltransferase activity, and efflux of cholesterol in cultured rabbit skin fibroblasts. Arteriosclerosis 10: 106–110, 1990. [DOI] [PubMed] [Google Scholar]
- 30.Peronnet F, Massicotte D. Table of nonprotein respiratory quotient: an update. Can J Sport Sci 16: 23–29, 1991. [PubMed] [Google Scholar]
- 31.Polonsky KS, Rubenstein AH. C-peptide as a measure of the secretion and hepatic extraction of insulin. Pitfalls and limitations. Diabetes 33: 486–494, 1984. [DOI] [PubMed] [Google Scholar]
- 32.Saunders TJ, Larouche R, Colley RC, Tremblay MS. Acute sedentary behaviour and markers of cardiometabolic risk: a systematic review of intervention studies. J Nutr Metab 2012: 712435, 2012. [DOI] [PMC free article] [PubMed] [Google Scholar]
- 33.Semenza GL. Regulation of oxygen homeostasis by hypoxia-inducible factor 1. Physiology (Bethesda) 24: 97–106, 2009. [DOI] [PubMed] [Google Scholar]
- 34.Slater C, Preston T, Weaver LT. Stable isotopes and the international system of units. Rapid Commun Mass Spectrom 15: 1270–1273, 2001. [DOI] [PubMed] [Google Scholar]
- 35.Smith JD, Cianflone K, Martin J, Poirier P, Broderick TL, Noel M. Plasma adipokine and hormone changes in mountaineers on ascent to 5300 meters. Wilderness Environ Med 22: 107–114, 2011. [DOI] [PubMed] [Google Scholar]
- 36.Stowhas AC, Latshang TD, Lo Cascio CM, Lautwein S, Stadelmann K, Tesler N, Ayers L, Berneis K, Gerber PA, Huber R, Achermann P, Bloch KE, Kohler M. Effects of acute exposure to moderate altitude on vascular function, metabolism and systemic inflammation. PLoS One 8: e70081, 2013. [DOI] [PMC free article] [PubMed] [Google Scholar]
- 37.Tobin BW, Uchakin PN, Leeper-Woodford SK. Insulin secretion and sensitivity in space flight: Diabetogenic effects. Nutrition 18: 842–848, 2002. [DOI] [PubMed] [Google Scholar]
- 38.Vats P, Ray K, Majumadar D, Amitabh Joseph DA, Bayen S, Akunov A, Sarbaev A, Singh SB. Changes in cardiovascular functions, lipid profile, and body composition at high altitude in two different ethnic groups. High Alt Med Biol 14: 45–52, 2013. [DOI] [PubMed] [Google Scholar]
- 39.Ward MP, Milledge JS, West JB. High Altitude Medicine and Physiology. London, UK: Arnold, 2000. [Google Scholar]
- 40.Yanagibori R, Kondo K, Suzuki Y, Kawakubo K, Iwamoto T, Itakura H. Effect of 20 days' bed rest on the reverse cholesterol transport system in healthy young subjects. J Int Med Res 243: 307–312, 1998. [DOI] [PubMed] [Google Scholar]
- 41.Zderic TW, Hamilton MT. Physical inactivity amplifies the sensitivity of skeletal muscle to the lipid-induced downregulation of lipoprotein lipase activity. J Appl Physiol 100: 249–257, 2006. [DOI] [PubMed] [Google Scholar]
- 42.Zhang JZ, Behrooz A, Ismail-Beigi F. Regulation of glucose transport by hypoxia. Am J Kidney Dis 34: 189–202, 1999. [DOI] [PubMed] [Google Scholar]
- 43.Zwart SR, Crawford GE, Gillman PL, Kala G, Rodgers AS, Rogers A, Inniss AM, Rice BL, Ericson K, Coburn S, Bourbeau Y, Hudson E, Mathew G, DeKerlegand DE, Sams CF, Heer MA, Paloski WH, Smith SM. Effects of 21 days of bed rest, with or without artificial gravity, on nutritional status of humans. J Appl Physiol 107: 54–62, 2009. [DOI] [PMC free article] [PubMed] [Google Scholar]