

Abstract
The metabolic status of the kidney is a determinant of injury susceptibility and a measure of progression for many disease processes; however, noninvasive modalities to assess kidney metabolism are lacking. In this study, we employed positron emission tomography (PET) and intravital multiphoton microscopy (MPM) to assess cortical and proximal tubule glucose tracer uptake, respectively, following experimental perturbations of kidney metabolism. Applying dynamic image acquisition PET with 2-18fluoro-2-deoxyglucose (18F-FDG) and tracer kinetic modeling, we found that an intracellular compartment in the cortex of the kidney could be distinguished from the blood and urine compartments in animals. Given emerging literature that the tumor suppressor protein p53 is an important regulator of cellular metabolism, we demonstrated that PET imaging was able to discern a threefold increase in cortical 18F-FDG uptake following the pharmacological inhibition of p53 in animals. Intravital MPM with the fluorescent glucose analog 2-[N-(7-nitrobenz-2-oxa-1,3-diazol-4-yl)amino]-2-deoxyglucose (2-NBDG) provided increased resolution and corroborated these findings at the level of the proximal tubule. Extending our observation of p53 inhibition on proximal tubule glucose tracer uptake, we demonstrated by intravital MPM that pharmacological inhibition of p53 diminishes mitochondrial potential difference. We provide additional evidence that inhibition of p53 alters key metabolic enzymes regulating glycolysis and increases intermediates of glycolysis. In summary, we provide evidence that PET is a valuable tool for examining kidney metabolism in preclinical and clinical studies, intravital MPM is a powerful adjunct to PET in preclinical studies of metabolism, and p53 inhibition alters basal kidney metabolism.
Keywords: positron emission tomography, multiphoton microscopy, kidney, p53
it is widely appreciated that kidney tubule metabolism is a critical determinant of both kidney function under physiological conditions and dysfunction in a variety of disease processes such as acute kidney injury (AKI) (31). More specifically, there is a growing awareness that understanding proximal tubule metabolism is a key component toward elucidating the overall susceptibility of the kidney to disease and injury. The application of drugs targeting glucose uptake in the proximal tubule for the treatment of diabetes mellitus has recently underscored this issue. Historical interpretation of studies from heterogeneous ex vivo preparations suggests that glucose utilization for glycolysis by the proximal tubule is minimal (17, 32). However, recent studies suggest that proximal tubule glycolytic flux plays an important role under various stressors and in diverse pathophysiological conditions (14, 15, 24, 34). Nonetheless, a detailed examination and understanding of kidney glucose metabolism in vivo is lacking in large extent to the absence of tools to examine this process in vivo.
Positron emission tomography (PET) has revolutionized the study and clinical detection of neoplastic tumors. The majority of tumors demonstrate an increase in glucose uptake due to a preferential shift in metabolism under aerobic conditions toward glycolysis that is known as the Warburg effect. This increase in glucose uptake can be detected by PET following the administration of the glucose analog 2-18fluoro-2-deoxyglucose (18F-FDG). While PET has also been employed to study basal metabolism in organs such as the brain, heart, and skeletal muscle to name a few, the application of PET to the study of glucose metabolism in the kidney has not been widely utilized. In part, this is due to the complexity of dissecting out tissue signal from the background of the filtered load of 18F-FDG and the relatively diminished affinity of tubular reabsorption for 18F-FDG by the sodium glucose cotransporter (SGLT) compared with glucose. While these limitations may have initially slowed the application of PET to the study of kidney metabolism, we demonstrate they are surmountable, which further opens the door for the extensive potential PET has in the study of kidney metabolism.
Intravital multiphoton microscopy (MPM) is an attractive complementary approach to PET imaging for examining metabolism in animal studies. Intravital MPM provides added cellular resolution of metabolic processes within the physiological milieu of the living animal. This resolution coupled with the expanding number of fluorescently labeled substrates and probes to examine metabolic processes makes intravital MPM an attractive technique to further dissect metabolic alterations under physiological conditions and disease states.
In this study, we apply the two powerful and complementary imaging approaches of PET and MPM to examine kidney glucose tracer uptake in vivo. We demonstrate for the first time that PET can discern alterations in glucose tracer uptake by the kidney in animals. We also show that MPM can further resolve these changes in uptake to the cellular level, thus allowing the study of segmental tubular metabolism. In addition, we analyze key metabolic regulators and metabolites to provide aggregate support for a shift in kidney metabolism consistent with the changes in glucose handling by the kidney. Last, we provide additional evidence for the regulatory role of p53 in nonneoplastic cell metabolism.
MATERIALS AND METHODS
Animal studies.
All animal protocols were approved by the Indiana University Institutional Animal Care Committee and conform to the National Institutes of Health Guide for the Care and Use of Laboratory Animals. Male mice strains C57BL/6J and B6.129S2-Trp53tm1Tyj/J (p53−/−) were obtained from the Jackson Laboratory. Mice were aged 8–12 wk and weighed 20–30 g. Male Sprague-Dawley rats, weighing 150–200 g, were obtained from Harlan. In some experiments, animals received pifithrin-α, a pharmacological p53 inhibitor, administered daily as an intraperitoneal injection for a total of 3 days (2.2 mg·kg−1·day−1, dissolved in DMSO; Calbiochem; the last dose was given 4 h before imaging or chemical analysis). Sham-treated animals received an equivalent dose of DMSO vehicle. Parallel experiments were performed in both mice and rats when feasible.
PET/computed tomography imaging.
Before imaging, animals were induced with 3–5% isoflurane gas (balance medical air), placed on a carbon fiber imaging bed, and an aesthetic plane was maintained with 1–3% isoflurane gas. Animals were injected with 10.6 ± 0.53 MBq of 18F-FDG via the tail vein once the scanner acquisition sequence had initiated. Dynamic-high resolution 18F-FDG PET images were acquired in list-mode for 60 min, using the IndyPETIII small-animal PET scanner. Animals were maintained isothermal by use of a 750-W convective header (P/N VH2 EH1-0020-01, Vornado). At the end of the PET imaging session, the subject and carbon fiber bed were transferred to a small-animal computed tomography (CT) imager (R9, GE Healthcare), where whole body CT images were acquired in two bed positions using a tube voltage, current, and shutter speed of 55 kVp, 1,000 mA, and 100 ms, respectively. In all cases, images were reconstructed using conventional filtered back-projection (FBP) algorithms with a 60-mm field of view into a 4D image series (3D image volumes with time), respectively. In all cases, CT images were reconstructed into a calibrated single 3D image volume using FBP and 4 × 4 binning according to the manufacturer, yielding a final effective isotropic resolution of 0.160 mm. Rats were used for all PET/CT imaging experiments due to the technical limitations based on size of imaging smaller mice.
In all cases, CT images were coregistered to 18F-FDG PET image volumes using Analyze 11.0 (AnalyzeDirect) software based on the maximum entropy and mutual information algorithm described previously (27). Semiautomated liver segmentation was performed on coregistered PET/CT image volumes (Analyze 11.0, AnalyzeDirect), and then data was extracted from the PET images with time. In addition, the left ventricular cavity was manually segmented to permit tracer kinetic modeling, and in all cases, CT-defined regions were applied to 3D and 4D PET images.
Dynamic 18F-FDG PET images for each animal were analyzed for kidney metabolism by simultaneously solving the following set of differential equations
| (1) |
| (2) |
where Fav, Ca, and C3 are the myocardial blood spillover fraction (5%) and arterial and cytosol concentrations of 18F-FDG in MBq/ml, respectively. K1(ml·ml−1·s−1), k2 (1/s), and k3 (1/s) are the first-order rate constants for exchange between the blood and kidney, kidney and the blood, and the cellular incorporation into oxidative phosphorylation, respectively. Upon model convergence, the kidney metabolic rate in glucose (g)·100 g−1·min−1 was computed according to the following equation
| (3) |
where R̄ (ml·g−1·min−1) and ρ are the average tissue metabolic rate and tissue density for the region, respectively, and Cg is the average concentration of serum glucose.
2-Photon intravital imaging of the kidney.
The fluorescent glucose analog 2-[N-(7-nitrobenz-2-oxa-1,3-diazol-4-yl)amino]-2-deoxyglucose (2-NBDG) was purchased from LifeTechnologies (N13195). A total of 20 μg/g 2-NBDG dissolved in normal saline was administered via the jugular vein, and intravital imaging of the kidney was performed over 50 min. In some experiments, continuous infusion of NBDG at a rate of 25 μg/min for 20 min was performed. Tetramethylrhodamine methyl ester (TMRM; LifeTechnologies) was used to assess the mitochondrial membrane potential. It emits bright red fluorescence that is proportional to mitochondrial membrane potential. It was administered intravenously as a 10 μg/kg bolus from a DMSO stock diluted in normal saline. Images were collected before injection and 20 min after intravenous injection of TMRM.
An Olympus FV1000-MPE confocal/multiphoton scanner was used for intravital imaging. The scanner is equipped with a Spectra Physics MaiTai Deep See laser and gallium arsenide 12-bit detectors. The system is mounted on an Olympus Ix81 inverted microscope with a Nikon ×20 or ×60 NA 1.2 water-immersion objective. The laser was tuned to 800 nm excitation for NBDG and 860 nm for TMRM. Animals were placed on the stage with the exposed intact kidney placed in a coverslip-bottom cell culture dish bathed in isotonic saline.
13C NMR spectroscopy.
Mice were infused with [U-13C]glucose (Cambridge Isotope Laboratories) via a jugular vein catheter as follows: a bolus of 0.4 mg/g body wt (300 μl) followed by a continuous infusion of 0.012 mg/g/min at 150 μl/h for 150 min. Isotopic steady state has been shown to be achieved with this protocol in mice. The kidney and liver were snap-frozen and finely ground in a mortar under liquid nitrogen. Four percent perchloric acid (4× the sample weight) and chloroform/tri-n-octylamine (78%/22%; 2× the sample volume) were used for extraction, and the pH was adjusted to 7.1.
Proton-decoupled 13C spectra were acquired on a 400-MHz Varian magnet and Varian VNMRS Direct Drive console using a 5-mm auto-switchable broadband probe (Varian Instruments). Proton decoupling was performed using a Waltz-16 sequence. 13C NMR parameters included a 45° flip angle per transient, a relaxation delay of 1.5 s, an acquisition time of 1.5 s, and a spectral width of 24.5 kHz. Samples were spun at 20 Hz, with the temperature regulated at an ambient 25°C. A 2H field-frequency lock was used. NMR spectral analyses were performed with ACD/Spec Manager 11.0 software. Free induction decays were zero-filled and multiplied by an exponential weighting function of 0.5–1.0 Hz before Fourier transformation. Resonances were assigned on the basis of the chemical shift position referenced to the glutamate C4 singlet at 34.2 ppm.
Immunostaining and pyruvate dehydrogenase enzyme activity.
Tissues were fixed with 4% paraformaldehyde and subsequently processed for immunofluorescence staining. The following primary antibodies were used for immunostaining: TP53-induced glycolysis and apoptosis regulator (TIGAR; IN1) rabbit polyclonal (ProSci) and pyruvate dehydrogenase kinase 1 (PDK1) rabbit polyclonal (Enzo Life Sciences). Images were collected using LSM-510 Zeiss confocal microscopy. A pyruvate dehydrogenase (PDH) enzyme activity microplate assay kit (ab109902, Abcam) was used to measure PDH enzyme activity of snap-frozen kidneys according to the manufacturer's instructions.
Metabolomics.
Kidneys from pifithrin-treated and vehicle-treated mice were snap frozen in liquid nitrogen and shipped on dry ice as per protocol to Metabolon (Durham, NC; www.metabolon.com), where the samples were stored at −80°C until metabolomic analysis was performed on their ultra-HPLC-tandem mass spectroscopy (UPLC-MS/MS) metabolomics platform.
Nucleotide extraction and HPLC.
Kidney tissues were obtained with precooled forceps and was crushed under liquid nitrogen and suspended in 30% ice-cold acetonitrile. The supernatant was gassed with nitrogen gas to evaporate acetonitrile, and the nucleotides were assayed by HPLC (Agilent 1100 series) as previously described (3). The HPLC column used was a Nova-Pack C18 4-μm, 8 × 100-mm Radial-Pak cartridge (Waters). HPLC grade nucleotide standards were used to calibrate the signals and identify peaks. Absolute nucleotide levels were adjusted for the pellet's protein content.
Statistical analyses.
Data were analyzed for statistical significance with R 2.13.1 software using t-tests or ANOVA followed by pairwise t-tests with the Holm P value adjustment. Significance was set at P < 0.05. A Welch's two-sample t-test was used to identify biochemicals that differed significantly between experimental groups for the metabolomic analysis. All data are reported as means with SD. In PET/CT analysis, a two-compartment three-parameter kinetic model was used, with tissue density of 1.05 g/ml, blood volume in the kidney at 5%, and hematocrit of 45%. In Fig. 2, we performed a nonlinear curve fitting and overlaid the fitted curves on measured values. The model used was y = a*[1 − exp(−b*x)]+c.
Fig. 2.

Application of intravital multiphoton microscopy (MPM) for subsegmental analysis of tubular glucose tracer uptake. Shown are representative ×20 intravital MPM images obtained ∼20 min after the infusion of 2-[N-(7-nitrobenz-2-oxa-1,3-diazol-4-yl)amino]-2-deoxyglucose (2-NBDG) in sham (vehicle control = DMSO) mice (A) and rats (C) as well as mice and rats treated with pifithrin-α (B and D, respectively). DT = distal tubule. E: time-fluorescence intensity curve (TFIC) of 2-NBDG uptake by the proximal tubules in mice treated with pifithrin-α (red) or sham mice. Each data point represents an individual region of interest, and error bars = SD. Similar findings were observed in rats. Right: example of how intracellular regions of interest were overlaid on images obtained by intravital microscopy to quantify proximal tubule uptake of 2-NBDG.
RESULTS
PET can discern differences in cortical glucose tracer. uptake in the kidney.
To examine the utility of PET in examining glucose tracer uptake by the kidney cortex, we performed dynamic image acquisition 18F-FDG PET and tracer kinetic modeling. The initial rapid blush of the 18F-FDG signal that appeared was overlaid on a CT scan to obtain anatomic definition and determine a “cortical mask” that was subsequently applied to images in order to define a cortical region of interest. Applying compartmental analysis techniques, we determined the uptake rate of 18F-FDG in the rat kidney cortex was 0.65 ± 0.14 mg·100 g−1·min−1 as measured by PET (Fig. 1, A, B, E, and F, sham). To assess the ability of PET to discriminate differences in cortical 18F-FDG uptake, we next sought to alter glucose metabolism by the kidney. It is known that functional loss of the transcription factor p53 can drive the Warburg effect in neoplastic cells, and mounting evidence suggests p53 is a key modulator of cellular metabolism under physiological conditions (30). Consequently, to perturb glucose tubular metabolism and to integrate this study with our prior studies in p53 biology (4, 28, 29), we pharmacologically inhibited p53 with pifithrin-α as a provocative measure to alter glucose metabolism in the renal tubular epithelium. Administration of pifithrin-α resulted in a 3.5-fold increase in the 18F-FDG uptake rate of the kidney cortex (Fig. 1, C–F, pifithrin). We observed a similar effect on 18F-FDG uptake in cultured renal tubular epithelial (LLC-PK) cells treated with pifithrin-α compared with vehicle control (data not shown).
Fig. 1.

Application of positron emission tomography (PET) for cortical glucose tracer uptake differences in the kidney. Shown are representative fused computed tomography (CT)/PET images of 2-18fluoro-2-deoxyglucose (18F-FDG) uptake by the kidney in sham rats (A; vehicle control = DMSO, S = superior, I = inferior, R = right, L = left) and rats treated with pifithrin-α (B). Images are pseudo-colored and integrated over the time of the experiment. C and D: identical images as the top panel in A and B, with the kidney regions of interest isolated and subsequently pseudo-colored on a different color scale to expand the color difference in the activity scale of 18F-FDG uptake. E: time-activity curves (TAC) of 18F-FDG uptake from PET imaging of the kidney region of interest in rats treated with pifithrin-α (red) or sham animals (vehicle control = DMSO, blue). F: analysis of the TACs from PET imaging reveal the rate of glucose uptake is significantly higher in the pifithrin-α-treated animals (2.98 ± 0.75) vs. sham animals (0.65 ± 0.14). PET/CT imaging experiments were not replicated in mice due to technical limitations based on animal size.
Intravital MPM provides subsegmental analysis of tubular glucose tracer uptake.
To analyze glucose tracer uptake at higher resolution, we examined proximal tubule glucose uptake in animals with intravital MPM following administration of the glucose analog 2-NBDG. We observed that uptake of 2-NBDG was more robust in the proximal tubule than in the distal tubules. 2-NBDG was more noticeable in the lumens of the distal tubule, where cellular uptake was barely detectable (Fig. 2A). Analysis of the time-fluorescence intensity curves revealed maximal 2-NBDG uptake in the proximal tubule of mice was 2.19 ± 0.26 arbitrary fluorescent units (afu)/min (Fig. 2, A and E). To parallel our PET studies above, we administered pifithrin-α as a provocative measure to alter glucose metabolism in the kidney cortex. Similar to our findings with PET, maximal 2-NBDG uptake in the proximal tubules was increased in pifithrin-α-treated animals (3.6 ± 0.60 afu/min) compared with vehicle-treated animals (Fig. 2, B and E). Proximal tubule cellular 2-NBDG uptake in mice following treatment with pifithrin-α was particularly robust in the brush-border area (Fig. 2B). Inhibition of p53 by pifithrin-α had a similar effect on 2-NBDG uptake in the rat (Fig. 2, C and D). To further explore the spatial laterality of 2-NBDG uptake in the proximal tubule, we rapidly acquired images during continuous infusion of 2-NBDG (supplementary movie; all supplemental material for this article is accessible on the journal web site). We observed the cellular uptake of 2-NBDG in the proximal tubule was similar from the apical and basolateral side of the cell, suggesting uptake by both SGLT and the glucose transporter (GLUT) as observed in studies in isolated cells (2, 7, 23, 33).
Glucose is used for glycolysis in the kidney.
Given the uptake of glucose tracer by the proximal tubule and the kidney in general, we next sought to examine the metabolic fate of glucose in the kidney. [U-13C]glucose was administered to mice, and metabolite production was examined by NMR spectroscopy (25) (Fig. 3A). Infusion of [U-13C]glucose achieved a steady-state enrichment of 40%. Although technical limitations of this type of study do not allow resolution to the level of the tubular segments, the generation of 13C-panlabeled lactate and the pattern of 13C-labeled glutamate and lactate demonstrate glycolytic metabolism of glucose in the kidney under physiological conditions (Fig. 3, B and C). The flux of [U-13C]glucose metabolism in the kidney is qualitatively similar to that observed in the liver, consistent with the high metabolic rate of the kidney (data not shown).
Fig. 3.

Metabolic fate of glucose in the kidney. A: schematic for the metabolic fate of 13-carbons (·) following administration of [U-13C]glucose and initial passage through glycolysis and the TCA cycle. B: NMR spectroscopic analysis of kidney tissue from mice demonstrating the 13C-labeled (·) species of lactate generated following the intravenous administration of [U-13C]glucose. C: NMR spectroscopyic analysis of kidney tissue from mice demonstrating the 13C-labeled (·) species of glutamate (Glu), alanine (Ala), and lactate (Lac) generated following the administration of [U-13C]glucose.
Pharmacological inhibition of p53 alters metabolic enzymes in the kidney.
In view of the increased uptake of glucose tracer analogs by the kidney that we observed following the pharmacological inhibition of p53 by pifithrin-α, we next examined some of the key metabolic enzymes regulating glucose metabolism that have been reported to be regulated by p53. TIGAR is transcriptionally activated by p53. TIGAR can inhibit glycolysis through its reported fructose-2,6-bisphosphatase activity (1). We found that expression of TIGAR in the proximal tubule of animals is significantly decreased following treatment with pifithrin-α (Fig. 4A).
Fig. 4.

Inhibition of p53 promotes metabolic alterations in the kidney consistent with an increased glycolytic flux. A: representative confocal images of TP53-induced glycolysis and apoptosis regulator (TIGAR) immunofluorescent staining (blue) in the cortex of kidneys from sham animals (vehicle control = DMSO) and animals treated with pifithrin-α. Right: quantitation of TIGAR immunostaining. B: representative confocal images of pyruvate dehydrogenase kinase 1 (PDK1) immunofluorescent staining (yellow) in the cortex of kidneys from sham animals (vehicle control = DMSO) and animals treated with pifithrin-α. Right: quantitation of PDK1 immunostaining. C: pyruvate dehydrogenase (PDH) activity in kidney homogenate obtained from sham animals (vehicle control = DMSO) and animals treated with pifithrin-α. Each tracing represents an individual animal, P < 0.001. D: data plots of key glycolytic metabolites as determined by a nonbiased metabolomics screen using ultra-high performance liquid chromatography-tandem mass spectroscopy. Each data point represents the measured metabolite from an individual animal in the associated treatment group as a scaled intensity compared with an internal standard.
PDK is another key metabolic enzyme regulated, albeit indirectly, by p53. PDK expression is suppressed by p53 through a microRNA 34-dependent mechanism (13). PDK phosphorylation of PDH inactivates PDH and in so doing diminishes the flux of pyruvate from glycolysis into the TCA cycle and subsequent oxidative phosphorylation (OXPHOS). We observed that pharmacological inhibition of p53 by pifthrin-α significantly increased PDK expression in the proximal tubule (Fig. 4B). Pifthrin-α produced a similar effect on PDK expression in cultured renal tubular epithelial (LLC-PK) cells (data not shown). Consistent with this observation, we found PDH activity in the kidney was significantly diminished following the pharmacological inhibition of p53 (Fig. 4C). In addition, through a nonbiased metabolomics screen we found that pharmacological inhibition of p53 significantly increased the glycolytic intermediaries fructose-6-phosphate, phosphoglycerate, and phosphoenolpyruvate, which is consistent with diminished flux into the TCA cycle (Fig. 4D).
Pharmacological inhibition of p53 alters OXPHOS in the kidney.
Synthesis of cytochrome oxidase 2 (SCO2) is another important metabolic enzyme transcriptionally activated by p53 (18). SCO2 maintains OXPHOS by facilitating the assembly of the cytochrome c oxidase complex. To examine the effect of p53 inhibition on OXPHOS, we monitored the maintenance of the mitochondrial potential difference in the proximal tubule by intravital MPM as a readout (11) of OXPHOS activity. Pifithrin-α reduced the mitochondrial potential difference of proximal tubules compared with vehicle-treated animals (Fig. 5), consistent with a decrease in SCO2 and an overall decrease in OXPHOS activity. Consistent with diminished OXPHOS activity, ATP content in the kidney of pifithrin-α-treated animals or animals with the genetic deletion of p53 is decreased compared with vehicle-treated controls (Fig. 6A). Furthermore, there is a significant decrease in the ATP/AMP ratio (Fig. 6B) that can enhance glycolysis through stimulation of phosphofructokinase activity.
Fig. 5.
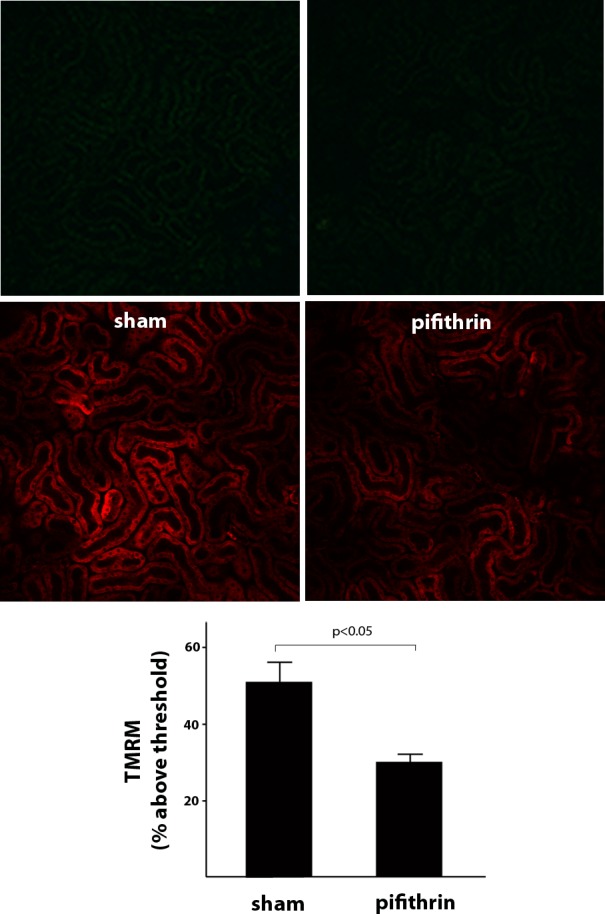
Inhibition of p53 decreases mitochondrial potential difference (PD) in the proximal tubule. Shown are representative intravital MPM images of tetramethylrhodamine methyl ester (TMRM; red) uptake from sham mice (vehicle control = DMSO; left) and mice treated with pifithrin-α (right). Top: t = 0. Middle: t = 20 min. TMRM uptake is proportional to the mitochondrial PD. Bottom: quantitation of fluorescence intensity demonstrating that mitochondrial PD was significantly diminished, as indicated by TMRM uptake, in animals treated with pifithrin-α compared with sham animals. Similar findings were observed in rats (data not shown).
Fig. 6.

Inhibition of p53 alters nucleotide concentration in the kidney. A: representative HPLC chromatograms of various nucleotides in kidney homogenates from sham (vehicle control = DMSO), pifithrin-α-treated, and p53 null mice. B: quantitation of ATP/AMP ratios by HPLC in kidney homgenates from sham (vehicle control = DMSO), pifithrin-α-treated, and p53 null mice demonstrates that ATP/AMP levels are significantly reduced in mice genetically lacking p53 or in mice where p53 is inhibited by pifithrin-α compared with sham mice. Similar findings ATP/AMP ratios were observed in sham and pifithrin-α-treated rats (data not shown).
DISCUSSION
To a large extent, the complex structure of the kidney gives rise to its many specialized functions. However, this complexity has hampered our understanding of the relationship between cellular metabolism and transport function along the various tubular segments. Historical attempts to clarify metabolism along the tubule have utilized preparations of isolated cells, dissected tubules, or ex vivo slices. This reductionist approach has provided some insight but is limited by removing the context of the intact organ that may influence cell and tubular metabolism. Flux studies of isolated, perfused kidneys have provided metabolic information within the context of the organ, but the signal is an aggregate readout from the heterogeneous structures of the kidney and thus lacks resolution to the level of the tubular segments. However, imaging modalities, combined or alone, are evolving to be powerful tools for the clinical and preclinical evaluation of metabolism within the context of the whole organ. PET has gained considerable attention in the past several decades as an in vivo imaging modality of metabolism. Application of PET to study metabolism in the kidney has had a somewhat slower trajectory because the most widely used tracer,18F-FDG, is handled by the kidney in a complex manner. Compartments to be considered in the handling of 18F-FDG include a blood compartment, a intracellular component from reabsorption and metabolism, and a urinary compartment from filtration and excretion (5). In particular, 18F-FDG in the pelvis of the kidney can obscure the signal in the kidney parenchyma. This barrier can be addressed by extending the time of image acquisition after excessive tracer is eliminated.
We used a similar approach in this study to model the rate of 18F-FDG uptake by the kidney cortex. Our findings in the animal studies provide further proof of concept that PET imaging has the capacity to discern changes in cellular glucose utilization following a provocative maneuver that can alter metabolism. Our animal studies are unique in that they examine differences in the tubular intracellular compartment under basal physiological conditions following a pharmacological manipulation to alter cell metabolism. In contrast, prior studies utilizing PET to study 18F-FDG distribution in the kidney examined either disease states where there was a combination of altered glomerular filtration rate and uptake by inflammatory cells (10, 22) or changes in the excretory compartment in non-disease states following pharmacological manipulation (5).
Recently, we have begun to explore the clinical applicability of PET to examine 18F-FDG uptake in the kidney cortex of humans without clinical evidence of kidney disease but with and without diabetes mellitus. Early observations suggest PET could be a tool for discerning fundamental differences in glucose utilization by the kidney that could have prognostic implications in patients with type II diabetes mellitus. Granted, much further study is required before this can be plausibly put forth as a working hypothesis. The development of PET tracers that can be used to exploit specific aspects of metabolism (6, 12, 19, 36) is expanding rapidly. The further development of tracers with specificity for metabolic pathways and selectivity for cell types will further enhance the appeal of PET as a noninvasive tool to study metabolism in health and disease, as well as the impact of therapeutic maneuvers in both clinical and preclinical studies.
As previously mentioned, one of the obstacles of prior studies in kidney metabolism was the lack of resolution to correlate function with metabolism at a specific segment of the kidney. Our PET studies were able to resolve the cortex from the medulla, but that was the limit. Consequently, we used intravital MPM to monitor the cellular uptake of the fluorescent glucose analog 2-NBDG as a complement to PET for examining cellular glucose tracer uptake in the living animal. Similar to 18F-FDG in PET, 2-NBDG in optical microscopy has experienced growing application for both preclinical and clinical studies of cancer (8, 16, 21). Our findings with 2-NBDG and intravital MPM in the proximal tubule of rodents were parallel to our findings with 18F-FDG and PET in the cortex of the kidney. Considering that proximal tubules make up the bulk of the tubules in the cortex, this may not be surprising. Importantly, our study demonstrates the feasibility of using 2-NBDG to examine glucose metabolism at a cellular resolution in the kidney of a living animal. In this study, we again used TMRM and intravital MPM to examine mitochondrial function in the kidney, similar to previous studies by us and others (9, 11). The application of 2-NBDG and TMRM to examine different aspects of metabolism underscores the emerging power of intravital MPM to study metabolism especially as the number of fluorescent probes for various pathways grows.
Both our PET and intravital MPM studies utilized tracers that are 2-deoxyglucose (2DG) analogs. These compounds are taken up by cells and phosphorylated by hexokinase in the cytosol to 2-deoxyglucose-6-phosphate compounds (2DG6P). The resulting products are asymmetric because of the substituted 2-deoxy position and are not further metabolized in the glycolytic pathway. Although phosphatases can convert the 2DG6P analogs back to 2DG analogs, this step has been shown to be relatively slow (>2 h) (26). Therefore, the tracers accumulate in the cytosol in direct proportion to uptake into the cell and the rate of phosphorylation by hexokinase. Pifithrin and/or p53 is not known to alter the activity of hexokinase or glucose-6 phosphatases; thus the alterations in glucose tracer uptake we observed likely represent accommodation for downstream changes in glucose metabolism. As previously mentioned, both of these tracers have relatively less efficient transport than glucose through SGLTs. This limits the application of these techniques for the strict kinetic study of vectorial glucose transport in the living kidney tubule or other tissues. Nonetheless, the change in uptake of these tracers suggests an underlying difference in glucose metabolism just as they reflect changes in underlying glucose metabolism of malignant tumors. As mentioned previously, the continued development of probes for applications in this type of imaging will provide additional mechanistic insights.
In our study, we used the pharmacological inhibition of p53 as a provocative maneuver to alter cellular metabolism. Regulation of cellular metabolism is a rapidly emerging role that has been ascribed to p53. The evolving metabolic theme is that loss or inhibition of p53 function activates glycolysis and suppresses OXPHOS (35). The vast majority of the studies examining the role of p53 in metabolism are derived from malignant cells although consistent with these studies the genetic loss of p53 function has been demonstrated to decrease aerobic metabolism in muscle (20). In addition, Kim et al. (14) have recently demonstrated that inhibition of the p53 regulated-enzyme TIGAR in proximal tubules alters glycolytic flux and is protective in a model of ischemic AKI. Our observations that acute pharmacological inhibition of p53 1) increases glucose tracer uptake by the proximal tubule, 2) decreases proximal tubule TIGAR, 3) increases proximal tubule PDK1, 4) decreases cortical PDH activity, 5) decreases proximal tubule mitochondrial membrane potential, and 6) increases the relative amount of select glycolytic intermediates in the kidney are cumulatively consistent with a switch toward glycolytic metabolism in the proximal tubule. Granted, technical limitations in some of these studies did not allow resolution to the level of proximal tubule, but they suggest further study is warranted as this metabolic switch in the proximal tubular cell could provide a metabolic survival advantage when threatened under stressed local environments similar to the survival advantage that neoplastic cells with the genetic loss of p53 have in similar local environments.
In summary, our findings in the aggregate 1) demonstrate the ability of 18F-FDG PET to discern metabolic changes in the kidney that has the clinical potential to be applied to a wide variety disease processes and pharmacological trials, 2) reveal an innovative application of intravital microscopy to investigate glucose tracer uptake in vivo, and 3) provide original evidence for the capacity of acute, transient p53 inhibition to shift kidney metabolic flux.
GRANTS
This work was supported by grants from the National Institutes of Health (R01DK099345 to T. A. Sutton and P. C. Dagher), Indiana University Clinical and Translational Science Institute NIH/NCCR (TR000006 to T. A. Sutton and P. C. Dagher, 607 to A. N. Friedman), the Indiana Institute for Biomedical Imaging Sciences (A. N. Friedman, T. A. Sutton, and P. C. Dagher), Dialysis Clinics, Inc. (A. N. Friedman, Paul Teschan Research grant to T. A. Sutton), and institutional support through the Indiana University-Purdue University Indianpolis Research Center for Quantitative Renal Imaging.
DISCLOSURES
No conflicts of interest, financial or otherwise, are declared by the authors.
AUTHOR CONTRIBUTIONS
Author contributions: T.H., A.N.F., G.D.H., P.R.T., R.A.H., P.C.D., and T.A.S. provided conception and design of research; T.H., A.N.F., H.E.M., Z.P., S.D., B.P.M., A.A.R., K.P., and T.A.S. performed experiments; T.H., S.D., G.D.H., P.R.T., K.P., C.R.M., P.C.D., and T.A.S. analyzed data; T.H., A.N.F., S.D., G.D.H., P.R.T., K.P., C.R.M., P.C.D., and T.A.S. interpreted results of experiments; T.H., S.D., P.R.T., and T.A.S. prepared figures; T.H., A.N.F., P.R.T., P.C.D., and T.A.S. edited and revised manuscript; T.H., P.C.D., and T.A.S. approved final version of manuscript; T.A.S. drafted manuscript.
REFERENCES
- 1.Bensaad K, Tsuruta A, Selak MA, Vidal MN, Nakano K, Bartrons R, Gottlieb E, Vousden KH. TIGAR, a p53-inducible regulator of glycolysis and apoptosis. Cell 126: 107–120, 2006. [DOI] [PubMed] [Google Scholar]
- 2.Blodgett AB, Kothinti RK, Kamyshko I, Petering DH, Kumar S, Tabatabai NM. A fluorescence method for measurement of glucose transport in kidney cells. Diabetes Technol Ther 13: 743–751, 2011. [DOI] [PMC free article] [PubMed] [Google Scholar]
- 3.Dagher PC. Modeling ischemia in vitro: selective depletion of adenine and guanine nucleotide pools. Am J Physiol Cell Physiol 279: C1270–C1277, 2000. [DOI] [PubMed] [Google Scholar]
- 4.Dagher PC, Mai EM, Hato T, Lee SY, Anderson MD, Karozos SC, Mang HE, Knipe NL, Plotkin Z, Sutton TA. The p53 inhibitor pifithrin-alpha can stimulate fibrosis in a rat model of ischemic acute kidney injury. Am J Physiol Renal Physiol 302: F284–F291, 2012. [DOI] [PMC free article] [PubMed] [Google Scholar]
- 5.Garbarino S, Caviglia G, Sambuceti G, Benvenuto F, Piana M. A novel description of FDG excretion in the renal system: application to metformin-treated models. Phys Med Biol 59: 2469–2484, 2014. [DOI] [PubMed] [Google Scholar]
- 6.Gatliff J, Campanella M. TSPO is a REDOX regulator of cell mitophagy. Biochem Soc Trans 43: 543–552, 2015. [DOI] [PubMed] [Google Scholar]
- 7.Gaudreault N, Scriven DR, Laher I, Moore ED. Subcellular characterization of glucose uptake in coronary endothelial cells. Microvasc Res 75: 73–82, 2008. [DOI] [PubMed] [Google Scholar]
- 8.Gorospe EC, Leggett CL, Sun G, Anderson MA, Gupta M, Penfield JD, Lutzke L, Lewis JT, Wong Kee Song LM, Wang KK. Diagnostic performance of two confocal endomicroscopy systems in detecting Barrett's dysplasia: a pilot study using a novel bioprobe in ex vivo tissue. Gastrointest Endosc 76: 933–938, 2012. [DOI] [PubMed] [Google Scholar]
- 9.Hall AM, Rhodes GJ, Sandoval RM, Corridon PR, Molitoris BA. In vivo multiphoton imaging of mitochondrial structure and function during acute kidney injury. Kidney Int 83: 72–83, 2013. [DOI] [PMC free article] [PubMed] [Google Scholar]
- 10.Hao G, Du Y, Zhou XJ, Guo J, Sun X, Mohan C, Oz OK. Serial non-invasive assessment of antibody induced nephritis in mice using positron emission tomography. PLoS One 8: e57418, 2013. [DOI] [PMC free article] [PubMed] [Google Scholar]
- 11.Kalakeche R, Hato T, Rhodes G, Dunn KW, El-Achkar TM, Plotkin Z, Sandoval RM, Dagher PC. Endotoxin uptake by S1 proximal tubular segment causes oxidative stress in the downstream S2 segment. J Am Soc Nephrol 22: 1505–1516, 2011. [DOI] [PMC free article] [PubMed] [Google Scholar]
- 12.Kim DY, Min JJ. Synthesis and evaluation of 18F-labeled fluoroalkyl triphenylphosphonium salts as mitochondrial voltage sensors in PET myocardial imaging. Methods Mol Biol 1265: 59–72, 2015. [DOI] [PubMed] [Google Scholar]
- 13.Kim HR, Roe JS, Lee JE, Cho EJ, Youn HD. p53 regulates glucose metabolism by miR-34a. Biochem Biophys Res Commun 437: 225–231, 2013. [DOI] [PubMed] [Google Scholar]
- 14.Kim J, Devalaraja-Narashimha K, Padanilam BJ. TIGAR regulates glycolysis in ischemic kidney proximal tubules. Am J Physiol Renal Physiol 308: F298–F308, 2015. [DOI] [PMC free article] [PubMed] [Google Scholar]
- 15.Lee H, Abe Y, Lee I, Shrivastav S, Crusan AP, Huttemann M, Hopfer U, Felder RA, Asico LD, Armando I, Jose PA, Kopp JB. Increased mitochondrial activity in renal proximal tubule cells from young spontaneously hypertensive rats. Kidney Int 85: 561–569, 2014. [DOI] [PMC free article] [PubMed] [Google Scholar]
- 16.Luo Z, Loja MN, Farwell DG, Luu QC, Donald PJ, Amott D, Truong AQ, Gandour-Edwards R, Nitin N. Widefield optical imaging of changes in uptake of glucose and tissue extracellular pH in head and neck cancer. Cancer Prev Res (Phila) 7: 1035–1044, 2014. [DOI] [PMC free article] [PubMed] [Google Scholar]
- 17.Mandel LJ. Metabolic substrates, cellular energy production, and the regulation of proximal tubular transport. Ann Rev Physiol 47: 85–101, 1985. [DOI] [PubMed] [Google Scholar]
- 18.Matoba S, Kang JG, Patino WD, Wragg A, Boehm M, Gavrilova O, Hurley PJ, Bunz F, Hwang PM. p53 regulates mitochondrial respiration. Science 312: 1650–1653, 2006. [DOI] [PubMed] [Google Scholar]
- 19.Ng Y, Moberly SP, Mather KJ, Brown-Proctor C, Hutchins GD, Green MA. Equivalence of arterial and venous blood for [11C]CO2-metabolite analysis following intravenous administration of 1-[11C]acetate and 1-[11C]palmitate. Nucl Med Biol 40: 361–365, 2013. [DOI] [PMC free article] [PubMed] [Google Scholar]
- 20.Park JY, Wang PY, Matsumoto T, Sung HJ, Ma W, Choi JW, Anderson SA, Leary SC, Balaban RS, Kang JG, Hwang PM. p53 improves aerobic exercise capacity and augments skeletal muscle mitochondrial DNA content. Circ Res 105: 705–712, 2009. [DOI] [PMC free article] [PubMed] [Google Scholar]
- 21.Rajaram N, Frees AE, Fontanella AN, Zhong J, Hansen K, Dewhirst MW, Ramanujam N. Delivery rate affects uptake of a fluorescent glucose analog in murine metastatic breast cancer. PLoS One 8: e76524, 2013. [DOI] [PMC free article] [PubMed] [Google Scholar]
- 22.Reuter S, Schnockel U, Schroter R, Schober O, Pavenstadt H, Schafers M, Gabriels G, Schlatter E. Non-invasive imaging of acute renal allograft rejection in rats using small animal F-FDG-PET. PLoS One 4: e5296, 2009. [DOI] [PMC free article] [PubMed] [Google Scholar]
- 23.Roman Y, Alfonso A, Louzao MC, Vieytes MR, Botana LM. Confocal microscopy study of the different patterns of 2-NBDG uptake in rabbit enterocytes in the apical and basal zone. Pflügers Arch 443: 234–239, 2001. [DOI] [PubMed] [Google Scholar]
- 24.Rowe I, Chiaravalli M, Mannella V, Ulisse V, Quilici G, Pema M, Song XW, Xu H, Mari S, Qian F, Pei Y, Musco G, Boletta A. Defective glucose metabolism in polycystic kidney disease identifies a new therapeutic strategy. Nat Med 19: 488–493, 2013. [DOI] [PMC free article] [PubMed] [Google Scholar]
- 25.Shulman GI, Rothman DL, Smith D, Johnson CM, Blair JB, Shulman RG, DeFronzo RA. Mechanism of liver glycogen repletion in vivo by nuclear magnetic resonance spectroscopy. J Clin Invest 76: 1229–1236, 1985. [DOI] [PMC free article] [PubMed] [Google Scholar]
- 26.Sokoloff L, Reivich M, Kennedy C, Des Rosiers MH, Patlak CS, Pettigrew KD, Sakurada O, Shinohara M. The [14C]deoxyglucose method for the measurement of local cerebral glucose utilization: theory, procedure, and normal values in the conscious and anesthetized albino rat. J Neurochem 28: 897–916, 1977. [DOI] [PubMed] [Google Scholar]
- 27.Studholme C, Hill DL, Hawkes DJ. Automated three-dimensional registration of magnetic resonance and positron emission tomography brain images by multiresolution optimization of voxel similarity measures. Med Phys 24: 25–35, 1997. [DOI] [PubMed] [Google Scholar]
- 28.Sutton TA, Hato T, Mai E, Yoshimoto M, Kuehl S, Anderson M, Mang H, Plotkin Z, Chan RJ, Dagher PC. p53 is renoprotective after ischemic kidney injury by reducing inflammation. J Am Soc Nephrol 24: 113–124, 2013. [DOI] [PMC free article] [PubMed] [Google Scholar]
- 29.Sutton TA, Wilkinson J, Mang HE, Knipe NL, Plotkin Z, Hosein M, Zak K, Wittenborn J, Dagher PC. p53 regulates renal expression of HIF-1α and pVHL under physiological conditions and after ischemia-reperfusion injury. Am J Physiol Renal Physiol 295: F1666–F1677, 2008. [DOI] [PMC free article] [PubMed] [Google Scholar]
- 30.Vousden KH, Lane DP. p53 in health and disease. Nat Rev Mol Cell Biol 8: 275–283, 2007. [DOI] [PubMed] [Google Scholar]
- 31.Wei Q, Xiao X, Fogle P, Dong Z. Changes in metabolic profiles during acute kidney injury and recovery following ischemia/reperfusion. PLoS One 9: e106647, 2014. [DOI] [PMC free article] [PubMed] [Google Scholar]
- 32.Wirthensohn G, Guder WG. Renal substrate metabolism. Physiol Rev 66: 469–497, 1986. [DOI] [PubMed] [Google Scholar]
- 33.Yamada K, Saito M, Matsuoka H, Inagaki N. A real-time method of imaging glucose uptake in single, living mammalian cells. Nat Protoc 2: 753–762, 2007. [DOI] [PubMed] [Google Scholar]
- 34.Zager RA, Johnson AC, Becker K. Renal cortical pyruvate depletion during AKI. J Am Soc Nephrol 25: 998–1012, 2014. [DOI] [PMC free article] [PubMed] [Google Scholar]
- 35.Zawacka-Pankau J, Grinkevich VV, Hunten S, Nikulenkov F, Gluch A, Li H, Enge M, Kel A, Selivanova G. Inhibition of glycolytic enzymes mediated by pharmacologically activated p53: targeting Warburg effect to fight cancer. J Biol Chem 286: 41600–41615, 2011. [DOI] [PMC free article] [PubMed] [Google Scholar]
- 36.Zhu A, Lee D, Shim H. Metabolic positron emission tomography imaging in cancer detection and therapy response. Semin Oncol 38: 55–69, 2011. [DOI] [PMC free article] [PubMed] [Google Scholar]