ABSTRACT
Myogenesis is a crucial process governing skeletal muscle development and homeostasis. Differentiation of primitive myoblasts into mature myotubes requires a metabolic switch to support the increased energetic demand of contractile muscle. Skeletal myoblasts specifically shift from a highly glycolytic state to relying predominantly on oxidative phosphorylation (OXPHOS) upon differentiation. We have found that this phenomenon requires dramatic remodeling of the mitochondrial network involving both mitochondrial clearance and biogenesis. During early myogenic differentiation, autophagy is robustly upregulated and this coincides with DNM1L/DRP1 (dynamin 1-like)-mediated fragmentation and subsequent removal of mitochondria via SQSTM1 (sequestosome 1)-mediated mitophagy. Mitochondria are then repopulated via PPARGC1A/PGC-1α (peroxisome proliferator-activated receptor gamma, coactivator 1 alpha)-mediated biogenesis. Mitochondrial fusion protein OPA1 (optic atrophy 1 [autosomal dominant]) is then briskly upregulated, resulting in the reformation of mitochondrial networks. The final product is a myotube replete with new mitochondria. Respirometry reveals that the constituents of these newly established mitochondrial networks are better primed for OXPHOS and are more tightly coupled than those in myoblasts. Additionally, we have found that suppressing autophagy with various inhibitors during differentiation interferes with myogenic differentiation. Together these data highlight the integral role of autophagy and mitophagy in myogenic differentiation.
Keywords: autophagy, differentiation, mitochondria, mitophagy, myoblasts, myogenesis, myotubes
Introduction
Skeletal muscle is a dynamic tissue type comprised primarily of myotubes which bundle into myofibrils. Between the sarcolemma and endomysium of myotubes reside satellite cells critical for muscle homeostasis and repair. These myogenic progenitors remain quiescent until the need for muscle repair and remodeling arises; then satellite cells mobilize and proliferate as myoblasts, a process governed by the activation of MYOD1/MyoD and MYF5/Myf5 (myogenic factor 5).1,2 Once the myoblast population has expanded, they withdraw from the cell cycle and activate their myogenic differentiation program.3,4 At the onset of differentiation, myoblasts express myogenin which allows them to fuse with other newly differentiated myoblasts or pre-existing myotubes.5,6
The myotube is a highly metabolically active cell type that relies heavily on OXPHOS.7,8 To meet their high energetic demand, myotubes harbor a large population of mitochondria arrayed in complex networks.7,9 In contrast to mature myotubes, myoblasts rely primarily on glycolysis for their metabolic needs and therefore have a more sparse mitochondrial population which is organized in a more rarefied network. The need for increased mitochondrial activity during myogenic differentiation has been well documented. For example, shortly after muscle injury occurs, PPARGC1A-related coactivator and PPARGC1B/PGC-1β (peroxisome proliferator-activated receptor gamma, coactivator 1 beta) are upregulated, followed somewhat later by PPARGC1A.10,11 These events result in an increase in mitochondrial protein amount and mitochondrial DNA copy number.
The events that set the stage for mitochondrial biogenesis during myogenic differentiation are less well understood. In order to transition from the glycolytic state of myoblasts, the mitochondria must acquire a dramatically different repertoire in order to support the metabolic demands of the differentiated myotube. Do cells simply add OXPHOS components to the existing mitochondrial network, or do they eliminate most of the mitochondria and establish a new network of mitochondria configured to meet the new energetic requirements of the cell? We hypothesized that mitochondrial clearance must precede repopulation. In this study, we show that soon after differentiation, C2C12 myoblasts briskly upregulate autophagy coincident with DNM1L-mediated fragmentation of mitochondrial networks, a decline in cellular mitochondrial protein, and an increase in mitochondrial SQSTM1 labeling consistent with mitophagy. As differentiation progresses, mitochondrial content dramatically increases and dense mitochondrial networks form, accompanied by an upregulation of mitochondrial fusion protein OPA1. These data suggest that mitophagy is a crucial precursor to mitochondrial remodeling during myogenesis. Dysregulation of autophagy and mitophagy with Atg5-directed siRNA, bafilomycin A1 (BAF), or Sqstm1-directed siRNA interfered with myogenic differentiation, revealing an important role for mitophagy during the formation of myotubes.
Results
Autophagy is an early event in myogenic differentiation
During the course of differentiation, cellular components adapted to support the quiescent stem cell must be remodeled or replaced with elements better suited to support the new functions of the differentiated cell. To investigate whether autophagy is involved in this process of cellular deconstruction, we utilized C2C12 mouse skeletal myoblasts and examined the expression of autophagy markers during differentiation. The C2C12 cell line was originally isolated from the thigh muscle of female C3H mice after crush injury. In full-serum growth media, these cells rapidly proliferate and maintain an undifferentiated myogenic progenitor state; however, when exposed to low-serum differentiation media they undergo growth arrest, differentiating and fusing into mature multi-nucleated myotubes.12,13 As shown in Figure 1A, C2C12 myoblasts grew as small spindle-shaped individual cells when cultured in growth media. As early as 3 d postdifferentiation (3 d PD), many of the cells had become phase-bright fused myotubes. By 6 d PD, the majority of the cells were myotubes that were elongated due to continued fusion. Western blotting revealed that at 6 d PD, the myogenic differentiation marker ACTA1/α-actin was strongly upregulated (Fig. 1B and C). To monitor the activation of autophagy, cell lysates were also probed for MAP1LC3A/LC3A (microtubule-associated protein 1 light chain 3 alpha). In western blots, MAP1LC3A appears as a double band, the top band representing the inactive cytosolic MAP1LC3A-I and the bottom band representing the lipidated active MAP1LC3A-II which is incorporated into the phagophore membrane. An elevation of MAP1LC3A-II and punctate cytoplasmic MAP1LC3A immunostaining are often used as markers of autophagy; an increase in the presence of lysosomal blockade indicates active autophagic flux. Interestingly, MAP1LC3A-II was upregulated early after the introduction of differentiation medium, but was downregulated later in differentiation (Fig. 1B and C). MAP1LC3A immunostaining on differentiating C2C12s recapitulated this result as can be seen by the large number of MAP1LC3A puncta in cells immediately following differentiation and gradual clearance by 6 d PD (Fig. S1). The addition of BAF resulted in the accumulation of MAP1LC3A puncta, indicating intact flux. This phenomenon was recapitulated in transmission electron micrographs (Figs. 4 and 6). These data show that autophagy is a transient phenomenon that is robustly upregulated only during the early steps of differentiation.
Figure 1.
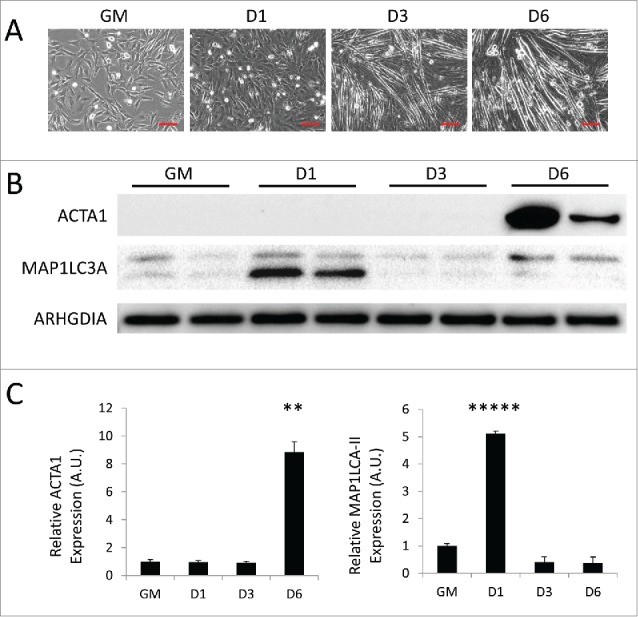
Autophagy is upregulated during myogenic differentiation of C2C12 myoblasts. C2C12 skeletal myoblasts were differentiated for 6 d in low serum differentiation media. (A) Phase contrast microscopy of differentiating C2C12s in growth medium (GM) or 1 d, 3 d, or 6 d PD. Scale bars: 100 µm. (B) Western blot analysis of whole cell lysates from differentiating C2C12s. (C) Quantification of western blots in B normalized to ARHGDIA (**, P < 0.01; *****, P < 0.00001; Student t test; representative western blot is shown, n=3).
Figure 4.
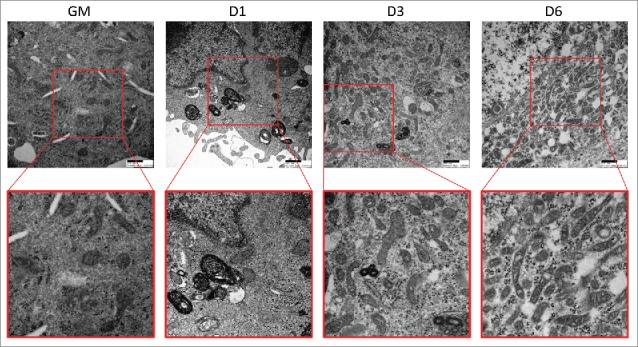
Electron micrographs of differentiating C2C12s. Transmission electron microscopy was performed on differentiating C2C12s to examine alterations in mitochondrial populations. Insets are presented at higher magnification below each original image. Scale bars: 500 nm. GM, growth medium.
Figure 6.
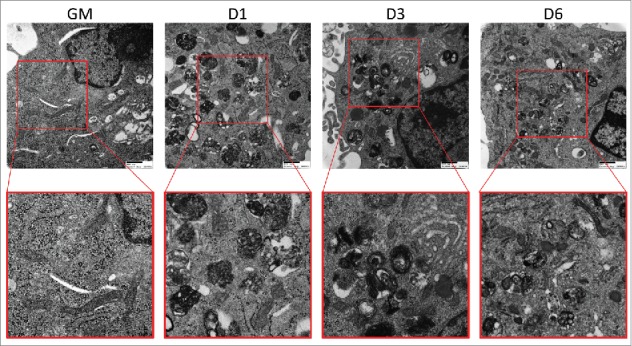
Electron micrographs of differentiating C2C12s treated with BAF. Transmission electron microscopy was performed on differentiating C2C12s treated with 100 nM BAF to examine alterations in mitochondrial populations. Insets are presented at higher magnification below each original image. Scale bars: 500 nm. GM, growth medium.
Blocking autophagy prevents differentiation
To determine if autophagy is crucial for myogenic differentiation, we pretreated myoblasts with autophagy inhibitors targeting various stages of the process. These inhibitors were well-tolerated, and did not substantially increase cell death (Fig. S5). Phase contrast imaging showed that C2C12s treated with siRNA targeting Atg5, BAF, or siRNA targeting Sqstm1 (Fig. 2A, C, and E, respectively) did not develop myotube morphology but rather maintained a primitive fibroblast-like shape throughout the differentiation time course. Western blots revealed that the myotube marker ACTA1 was robustly expressed at 6 d PD by cells in differentiation media with vehicle only, but this was either delayed or completely inhibited by treatment with autophagy inhibitors (Fig. 2B, D, and F). Similar effects were seen when cells were treated with 3-methyladenine (3-MA) (Fig. S2). These data illustrate that disruption of autophagy, whether at the initiation, cargo trafficking, or lysosomal fusion steps, impairs myogenic differentiation.
Figure 2.
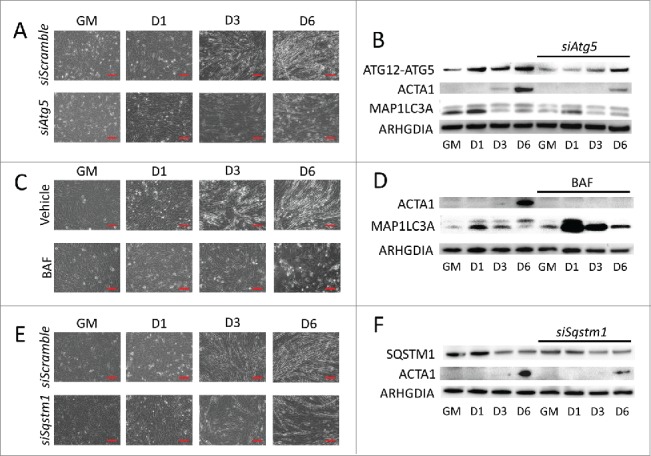
Blocking autophagy prevents myogenic differentiation. C2C12 cells were pretreated with autophagy-inhibiting agents and were subsequently differentiated. (A, C, and E) Phase contrast microscopy of differentiating C2C12s pretreated with either siRNA targeting Atg5 (A), BAF (C), or siRNA targeting Sqstm1 prior to differentiation (E). Scale bars: 100 µm. (B, D, and F) Western blot analysis of whole cell lysates from siAtg5 (B), BAF (D), or siSqstm1 (F)-treated cells. GM, growth medium.
Mitochondrial networks remodel during myogenic differentiation
As myoblasts differentiate into myotubes, their mitochondria must increase OXPHOS capacity and conform to the rather rigid architecture imposed by the contractile machinery. To visualize alterations in the mitochondrial network, we differentiated C2C12s expressing a mitochondrial matrix-directed DsRed and examined them at various time points during differentiation. As seen in Figure 3A, undifferentiated myoblasts exhibited a sparsely-populated filamentous mitochondrial network. As early as 1 d PD, mitochondrial network fragmentation was observed, giving rise to spherical mitochondria that persisted to 3 d PD. This coincided with a brisk upregulation of the mitochondrial fission protein DNM1L at 1 d PD; DNM1L decreased at 3 d PD and was nearly undetectable by 6 d PD (Fig. 3C and D). At 4 d PD, mitochondrial fusion events led to the formation of a filamentous network concurrent with an increase in OPA1 expression (Fig. 3B, C, and D). We next performed transmission electron microscopy on differentiating cells to examine changes in mitochondrial networks (Fig. 4). In undifferentiated myoblasts, mitochondrial populations were sparse and exhibited primarily elongated morphology. At 1 d PD, numerous autophagosomes were observed and mitochondria were predominantly circular. At 3 d and 6 d PD, fewer autophagosomes were observed and mitochondria were more numerous with more instances of elongation. These data illustrate the dynamic remodeling of the mitochondrial network during the transition from myoblast to myotube.
Figure 3.
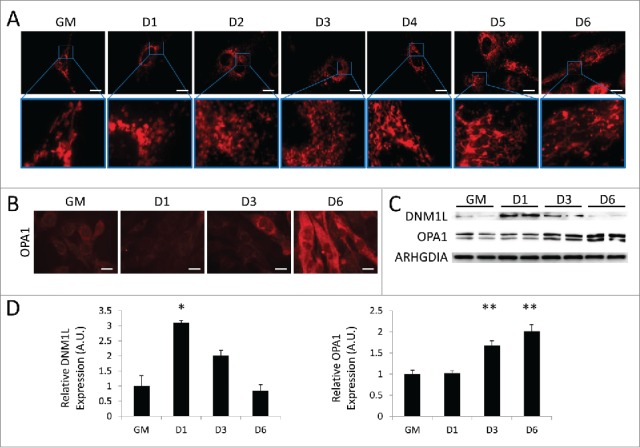
Mitochondrial remodeling occurs during myogenic differentiation. Differentiating C2C12s were examined for alterations in mitochondrial networks. (A) Cells expressing mitochondria-targeted DsRed were differentiated and examined with fluorescence microscopy. Exposure times were individually adjusted to bring out detail. Scale bars: 20 µm. (B) Differentiating cells immunostained for OPA1 (red) and imaged via fluorescence microscopy. All images were collected under identical illumination and exposure parameters. Scale bars: 20 µm. (C) Western blot analysis of whole cell lysates from differentiating C2C12s. (D) Quantification of western blots in C normalized to ARHGDIA (*, P < 0.05; **, P < 0.01; Student t test; representative western blot is shown, n=3). GM, growth medium.
Mitochondrial remodeling is impaired when autophagic flux is blocked
Earlier, we observed that autophagy was activated during early differentiation accompanied by a transient elevation of DNM1L and fragmentation of the mitochondrial network. To assess the effect of autophagy on mitochondrial remodeling during myogenic differentiation, we pretreated undifferentiated C2C12s with BAF or equivalent volume of vehicle prior to differentiation. Cells were then stained for outer mitochondrial membrane marker TOMM70A/TOM70 (translocase of outer mitochondrial membrane 70 homolog A [S. cerevisiae]) to visualize the mitochondrial network. Vehicle-treated cells underwent the previously observed network remodeling, fragmenting soon after exposure to differentiation media and then fusing into dense filamentous networks as differentiation progressed (Fig. 5A and B). Cells treated with BAF also underwent mitochondrial fragmentation early during differentiation, but failed to reconstitute their networks even by 6 d PD. This aberrant mitochondrial remodeling was accompanied by the expected early upregulation of DNM1L; however the elevated level of DNM1L persisted out to 6 d PD (Fig. 5C and D). The upregulation of OPA1 was also blocked by BAF, consistent with the failure to reconstitute the mitochondrial network. Western blot detection of DNM1L and OPA1 on isolated mitochondria also showed these same trends (Fig. S3). Electron micrographs showed that early in differentiation, cells treated with BAF lacked elongated mitochondria throughout the course of differentiation and also contained a large amount of autophagosomes as is expected from a blockade in autophagic flux (Fig. 6). An abundance of autophagosomes remained until 6 d PD, while instances of elongated mitochondria were rare when compared to non-BAF controls (Fig. 4). While blockade of autophagy prevented differentiation, it did not increase cell death (Fig. S5). The inhibition of differentiation by BAF shows that while the initiation of autophagy is accompanied by fragmentation of mitochondrial networks, intact autophagic flux during early differentiation appears to be required for network reconstruction and myotube formation.
Figure 5.
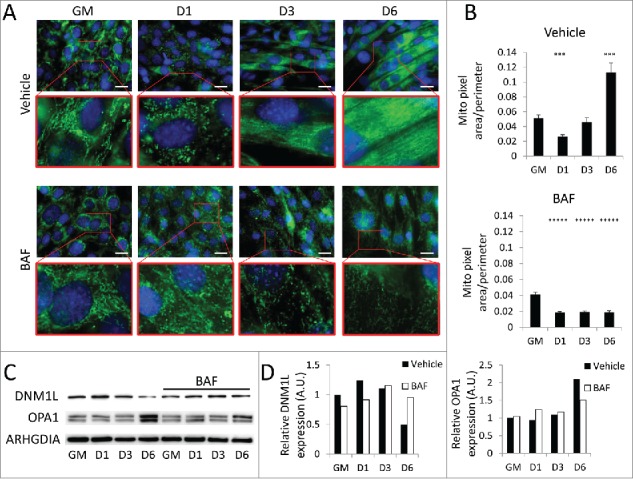
Mitochondrial remodeling is impaired when autophagic flux is blocked. BAF-treated cells were examined to determine if autophagic flux was required for mitochondrial remodeling. (A) C2C12s were pretreated with BAF or vehicle and then stained for TOMM70A (green) and with Hoechst 33342 (blue) and imaged via fluorescence microscopy. Insets are presented at higher magnification below each original image. Exposure times were individually adjusted to bring out detail. Scale bars: 20 µm. (B) Cells in A were analyzed using Image J to measure mitochondrial pixel area/perimeter ratios of individual cells as a measure of network interconnectivity. (***, P<.001; *****, P<.00001; Student t test, n=10) (C) Western blot analysis of whole cell lysates from BAF-treated C2C12s. (D) Quantification of western blots in C. GM, growth medium.
Myogenic differentiation is accompanied by mitophagy and biogenesis
Given that mitochondria undergo an orchestrated program of fission and fusion during myogenic differentiation, we next examined differentiating C2C12s for evidence of mitochondrial clearance and repopulation. Immunofluorescence targeting TOMM70A revealed modest mitochondrial staining when cells were in full growth media. When cells were switched to differentiation media, a marked reduction in TOMM70A immunostaining was observed at 1 d PD (Fig. 7A). TOMM70A expression increased by 3 d PD, and by 6 d PD myotubes contained very dense and brightly stained mitochondrial networks. Western blots of cell lysates from differentiating cells recapitulated the depletion of TOMM70A 1 d PD and the gradual buildup of TOMM70A by 6 d PD (Fig. 7B and C). The initial decline of mitochondrial protein coincided with the previously noted spike in autophagy marker MAP1LC3A-II (Fig. 1B and C) as well as a sustained increase in the ATG12–ATG5 complex. Cellular SQSTM1 levels also began to decline at 3 d PD. Interestingly, mitochondrial SQSTM1 recruitment was significantly elevated at 1 d PD and beyond (Fig. 7B, C and Fig. S4). Together, these data show that mitochondria are targeted for degradation immediately after the differentiation program is set into motion, and the involvement of SQSTM1 as well as upregulation of various autophagy markers suggests that this is an autophagy-mediated process.
Figure 7.
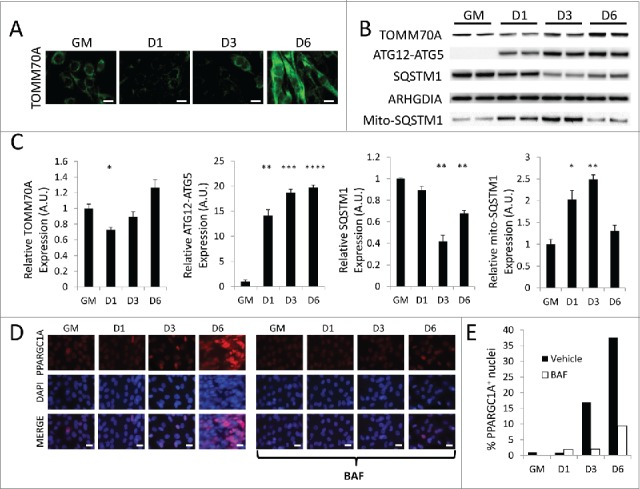
Myogenic differentiation is accompanied by mitophagy and biogenesis. Differentiating C2C12s were analyzed for mitophagy and biogenesis markers. (A) Differentiating C2C12s immunostained for TOMM70A (green) and imaged via fluorescence microscopy. All images were collected under identical illumination and exposure parameters. Scale bars: 20 µm. (B) Western blot analysis of whole cell lysates from differentiating C2C12s. (C) Quantification of western blots in B. Whole lysate blots were normalized to ARHGDIA. (*, P < 0.05; **, P < 0.01; ***, P < 0.001; ****, P < 0.0001; Student t test; representative western blot is shown, n=3). (D) Differentiating C2C12s were immunostained for PPARGC1A (red) as well as with Hoechst 33342 nuclear stain (blue) and examined via fluorescence microscopy. All images were collected under identical illumination and exposure parameters. Scale bars: 20 µm. (E) Quantification of the percentage of PPARGC1A+ nuclei over total nuclei (100 nuclei counted per condition). GM, growth medium.
Next, differentiating C2C12s were examined for markers of mitochondrial biogenesis. PPARGC1A is a transcriptional coactivator that interacts with nuclear receptor PPARG/PPAR-γ (peroxisome proliferator-activated receptor gamma) and mediates mitochondrial biogenesis. Cells were therefore stained for PPARGC1A and examined for nuclear expression of the protein, a common indicator of biogenesis. As can be seen in Figure 7D and E, very few of the undifferentiated C2C12 myoblasts exhibited nuclear PPARGC1A, consistent with minimal levels of mitochondrial biogenesis under basal growth conditions. However, by 3 d PD there was a noticeable increase in PPARGC1A-positive nuclei, and this number continued to increase out to 6 d PD. This matched the previously described increase in mitochondrial content indicated by TOMM70A immunostaining and western blots (Fig. 7A, B, and C). Blocking autophagic flux with BAF inhibited PPARGC1A expression during differentiation. Together, these data illustrate an orchestrated differentiation program in developing myotubes, which begins with a round of brisk mitophagy that must be fully resolved before a phase of mitochondrial biogenesis and network reconstitution can occur.
To measure mitochondrial turnover dynamics, we utilized MitoTimer-expressing C2C12s (MitoTimer-C2C12s) and examined them throughout the course of differentiation. These cells constitutively express a mitochondria-targeted fluorescent timer protein, which slowly transitions from green to red fluorescence over 48 h.14 Therefore, a decrease in red over green signal indicates mitochondrial biogenesis. Figure 8A shows that mitochondria began mostly green in normal growth media. Upon the introduction of differentiation media, mitochondria progressively shifted to red fluorescence until 3 d PD at which point green signal intensity began to increase again, suggesting that mitochondria were actively importing newly synthesized protein, a characteristic of mitochondrial biogenesis. Ratiometric quantification of red and green fluorescence intensity based on microscopy (Fig. 8B) and fluorescence-activated cell-sorting analysis (Fig. 8C) both revealed that the red/green ratio peaked at 3 d PD and then declined as new (green) MitoTimer protein was incorporated, reflecting mitochondrial biogenesis in the later stages of differentiation.
Figure 8.
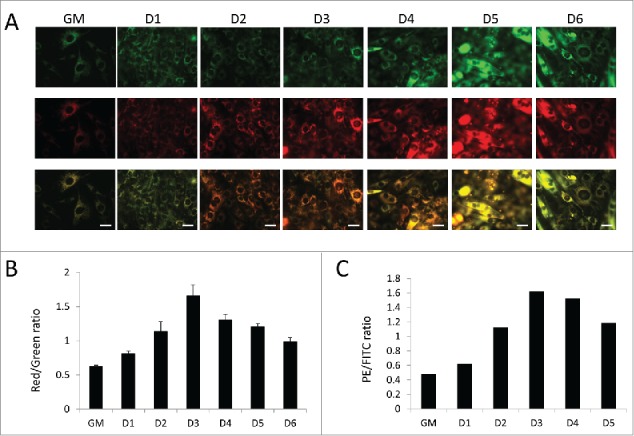
Assessment of mitochondrial turnover via MitoTimer. Mitochondrial turnover was examined in differentiating C2C12s expressing MitoTimer. (A) Fluorescent images of MitoTimer-expressing C2C12s throughout differentiation. All images were collected under identical illumination and exposure parameters. Scale bars: 20 µm. (B) Red/green ratios based on images from A. Three fields were analyzed per time point. (C) PE/FITC ratios of differentiating MitoTimer-expressing C2C12s as measured by fluorescence-activated cell sorting. 50,000 events were analyzed per time point. GM, growth medium.
Myotubes are populated with more tightly coupled mitochondria fortified with increased OXPHOS machinery
We and others have observed that myotubes contain a larger population of mitochondria than do undifferentiated myoblasts.7,9 Therefore we wished to determine whether the individual newly-formed mitochondria that reside within these mature, differentiated cells are qualitatively different from those found in primitive, undifferentiated myoblasts. To investigate this, mitochondria were isolated from undifferentiated C2C12 myoblasts and differentiated C2C12 myotubes (6 d PD) and studied using a Seahorse extracellular flux analyzer. Fatty acid oxidation analysis showed that myotube mitochondria had higher state III oxygen consumption rates (OCRs) compared to myoblast mitochondria (Fig. 9A). The addition of the ATP synthase inhibitor oligomycin revealed that the respiratory control ratio was almost 3-fold higher in mitochondria isolated from myotubes compared to those isolated from myoblasts, showing that myotube mitochondria were more tightly coupled. The addition of the uncoupler FCCP showed an enhanced reserve respiratory capacity in myotube mitochondria as well. Interestingly, examining palmitate oxidation in intact cells revealed that myotubes had an elevated basal OCR when exposed to palmitate but myoblasts appeared to be completely unresponsive to fatty acid relative to BSA controls (Fig. 9B). The introduction of oligomycin abolished palmitate-induced OCR elevation in myotubes, bringing down respiration rates close to the levels of BSA controls. Oligomycin also dramatically reduced respiration of myoblasts that were incubated in either BSA or palmitate. These data suggest that myotubes were primarily reliant on fatty acid oxidation, whereas myoblasts utilized glucose oxidation. Western blot analysis also showed that mitochondria isolated from differentiating C2C12s had a higher content of OXPHOS components by 3 d PD (Fig. 9C, D and Fig. S4). In all, these data show that myotubes not only contain more mitochondria, but these mitochondria are qualitatively different, better adapted to supply the energetic requirements of a differentiated muscle cell.
Figure 9.
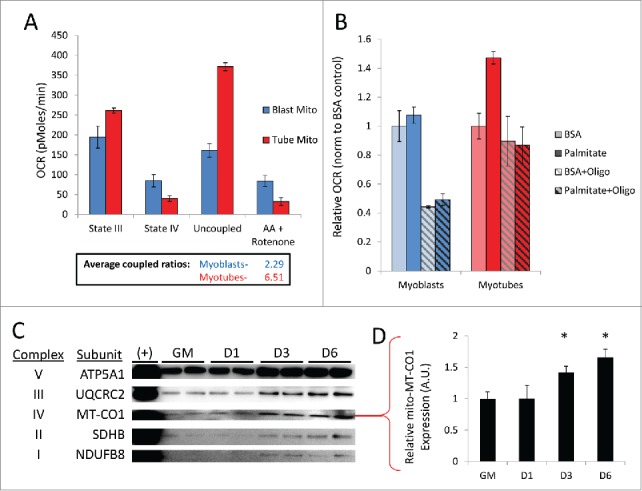
Myotubes are populated with more tightly coupled mitochondria fortified with increased OXPHOS machinery. Undifferentiated C2C12 myoblasts and differentiated myotubes 6 d PD were examined for qualitative differences in mitochondria. (A) OCRs of isolated mitochondria from myoblasts (Blast Mito) or myotubes (Tube Mito). Palmitoyl carnitine was used as the substrate. Average coupled ratios are presented below. (B) OCRs of intact myoblasts or myotubes using palmitate as the substrate. (C) Western blot analysis detecting OXPHOS complex proteins in mitochondria isolated from myoblasts or myotubes. (D) Quantification of MT-CO1 western blot (*, P < 0.05; Student t test; representative western blot is shown, n=3). GM, growth medium.
Discussion
The myogenic precursor cell population residing within skeletal muscle is a crucial component of repair and homeostasis. Once activated, these cells must undergo a substantial transformation from a mostly glycolytic myoblast7 with mildly uncoupled mitochondria to a metabolically active OXPHOS-dependent myotube (Fig. 10). To meet this increased energetic demand, mitochondrial biogenesis is induced to expand the mitochondrial mass. Indeed we have observed that during the later phase of myogenic differentiation, mitochondrial biogenesis leads to the formation of a dense mitochondrial network. However, our data indicate that this expansion is preceded by a wave of mitochondrial clearance, eliminating most of the pre-existing mitochondria that were adapted to serve the needs of a stem cell in order to make way for functionally different mitochondria capable of robust ATP production via fatty acid oxidation. The dramatic break-down and reassembly of the mitochondrial networks is interesting as it highlights several key players involved in the “mitochondrial differentiation” process. During the early phase of differentiation, DNM1L is upregulated but cleared soon after. Recent work has shown that mice with a cardiac-specific Dnm1l knockout have inhibited cardiac mitophagy resulting in cardiac dysfunction.15 Therefore DNM1L-mediated fission appears to be a crucial prerequisite for mitophagy. Following the mitochondrial clearance stage, mitochondrial constituents are replenished and densely populated networks are built via OPA1-mediated fusion. Interestingly, this rebuilding phase does not occur until mitochondrial clearance has subsided. This was illustrated when we pretreated myoblasts with BAF and placed them in differentiation media. Mitochondrial fission and autophagosomes were prominent; however because lysosomal fusion was blocked and degradation was prevented, the progression to biogenesis and further differentiation was impeded. Our findings show that mitochondrial autophagy dependent upon intact autophagic flux and SQSTM1 translocation is essential for mitochondrial clearance during early myogenic differentiation.
Figure 10.
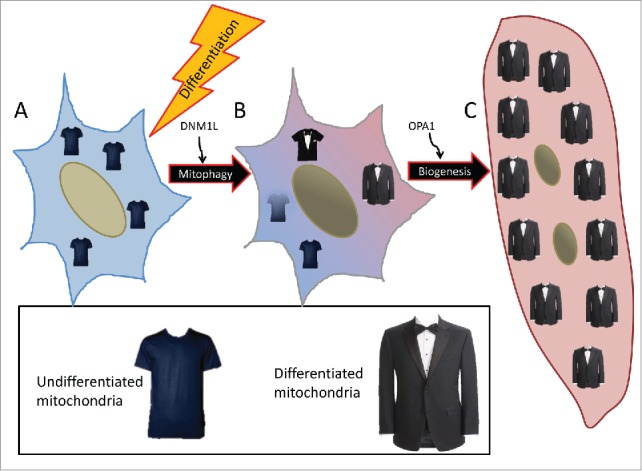
Schematic of mitochondrial remodeling during differentiation. (A) Myoblasts rely primarily on glycolysis and to a lesser extent glucose oxidation and contain sparsely-populated networks of mitochondria. (B) With a differentiation stimulus, mitochondrial fission protein DNM1L and mitophagy receptor protein SQSTM1 are upregulated, leading to mitochondrial fragmentation and mitophagy. (C) Following clearance of the myoblast mitochondria, new mitochondria are synthesized via PPARGC1A-mediated biogenesis. These new mitochondria which rely primarily on fatty acid oxidation, are more tightly-coupled and better equipped to perform OXPHOS. Dense mitochondrial networks are established via OPA1-mediated fusion.
The prerequisite for mitophagy in differentiating cells raises the concern that impaired autophagy would negatively affect myogenesis. This may explain in part the diminished ability to repair damaged tissue in aged organisms where autophagy is diminished,16 and similarly in the setting of obesity.17,18 It has been documented that a slew of autophagy proteins including various ATG proteins and sirtuins are downregulated in aged tissues. These can manifest in neurological and cardiac disorders and likely could contribute to impaired skeletal muscle homeostasis and repair. Indeed this, among other factors, may be involved in the reduction of skeletal muscle mass typically seen with increased age.19 This type of atrophy has been associated with diminished size and number of muscle fibers and is consistent with reports suggesting that satellite cells in aged muscle have an impaired ability to form fused myotubes.20,21 Interventions such as caloric restriction, intermittent fasting, and resveratrol, all of which promote autophagy, could potentially preserve the regenerative capacity of skeletal muscle as well as prevent tissue damage due to protein aggregation and ROS oxidative stress. Autophagy is likely to have other roles during cellular remodeling aside from mitochondrial turnover.22 This may include breakdown of structural components and other organelles. Additionally, autophagy could be involved in differentiation signaling. For example, growth arrest is an early component in cellular differentiation and this is accompanied by a downregulation in AKT-MTOR (mechanistic target of rapamycin [serine/threonine kinase]) signaling. Previous work has shown that rapamycin can induce the differentiation of various cell types such as glioma stem or progenitor cells and myeloid cells.22,23 It will be interesting to explore if the activation of autophagy mediates this process or if upregulation of autophagy is merely a byproduct of diminished AKT-MTOR activity.
This study reveals the importance of mitochondrial turnover at the onset of differentiation. We have used the C2C12 cell line as a model for stem cell differentiation, but further work is needed to show that the requirement for autophagy, mitophagy, and mitochondrial biogenesis are common to other stem cells and differentiation pathways. The expanded mitochondrial population present in fully differentiated myotubes is quantitatively and qualitatively different from the mitochondria in myoblasts. This is consistent with the distinctly different roles of mitochondria in the 2 cellular contexts: in stem cells, ATP demands are low, and because stem cell niches may be somewhat hypoxic, ATP synthesis should depend on glucose as the more oxygen-efficient fuel, and ROS production must be minimal to avoid DNA damage and early senescence; in contrast, in muscle cells, ATP production must utilize a substrate such as fatty acids that can yield abundant ATP even at the cost of greater oxygen consumption in order to meet the energy demands of contractile tissue, and must possess high reserve capacity even at the expense of more ROS production when “idling.”
Metabolic reprogramming has been described in various differentiation programs24 and is often considered to arise from a broadly scripted translational program in which metabolic pathways and cytoskeletal components are coordinately regulated. However, our findings suggest that rather than a symphony of multiple parallel events, mitochondrial clearance, reconstitution, and myotube differentiation proceed in a step-wise fashion in which mitophagy must resolve prior to the initiation of biogenesis and subsequent events. This adds new meaning to the concept of metabolic reprogramming: we posit that the altered metabolic milieu created by the new mitochondria (e.g., NADH, acetyl-CoA, and other metabolites) leads to chromatin remodeling; these epigenetic modifications then alter the nuclear transcriptional program.
Materials and methods
Cell culture and treatments
C2C12 mouse skeletal myoblasts (ATCC, CRL-1772) were maintained in growth media consisting of DMEM (Gibco, 11995–073) containing 10% fetal bovine serum (Life Technologies, 16010–159) and antibiotic/antimycotic (Life Technologies, 15240–062). Cells were differentiated by allowing them to reach 100% confluence and switching them to differentiation medium consisting of DMEM containing 2% horse serum (Life Technologies, 16050–122) and antibiotic/antimycotic. At 6 d PD, cells appeared mostly as phase-bright fused myotubes.
3-MA (Sigma-Aldrich, M9281) was dissolved directly into prewarmed growth media at a concentration of 5 mM. C2C12s were treated with 3-MA or normal growth media for 24 h prior to differentiation.
BAF (EMD Millipore, 196000) was dissolved in DMSO at a concentration of 100 µM. C2C12s were treated with 100 nM BAF (diluted in growth media) or equivalent amounts DMSO for 2 h prior to differentiation.
Atg5 siRNA (Santa Cruz Biotechnology, SC-41446) and Sqstm1 siRNA (Santa Cruz Biotechnology, SC-29828) were reconstituted following the manufacturer-provided datasheet. Transfection was performed using Effectene Transfection Reagent (Qiagen, B00118) following manufacturer's guidelines for reagent volumes. Cells were transfected for 48 h prior to differentiation. For Sqstm1 silencing, cells were then transfected again at 2 d PD and 4 d PD for 24 h each.
To examine cell viability, cells were trypsinized and stained with trypan blue (Life Technologies, 15250061). Percent viability was then measured using a Bio-Rad TC20 automated cell counter (Bio-Rad Laboratories Inc.; Hercules, CA, USA).
Western blots
Whole cell lysates were obtained by applying RIPA buffer containing Tris pH 8.0 (50 mM; Sigma-Aldrich, T1503), NaCl (150 mM; Sigma-Aldrich, S7653), ethylene glycol tetraacetic acid [EGTA] (2 mM; Sigma-Aldrich, E4378), ethylenediaminetetraacetic acid [EDTA] (1 mM; Sigma-Aldrich, E4884), NP-40 (1%; Sigma-Aldrich, I3021), sodium deoxycholate (0.5%; Sigma-Aldrich, D6750), sodium dodecyl sulfate [SDS] (0.1%; Bio-Rad Laboratories Inc., 161–0302) with protease inhibitors (Sigma-Aldrich, 05056489001) directly to adherent cells and scraping. For subcellular fractionation to separate mitochondrial and cytoplasmic fractions, cells were scraped in mitochondrial isolation buffer containing sucrose (250 mM; Sigma-Aldrich, 179949), EDTA (1 mM), HEPES (10 mM; Sigma-Aldrich, H3375), and protease inhibitors pH-adjusted to 7.4. Collected cells were then mechanically disrupted by passing through a 27 ½ gauge needle. Cell slurries were centrifuged at 600 x g for 5 min. Supernatant fractions were collected and centrifuged again at 8000 x g for 15 min to pellet mitochondria. Supernatant fractions represented the cytosolic fraction. The mitochondrial pellet was washed by resuspending in mitochondrial isolation buffer, spinning again at 8000 x g for 15 min and lysing in RIPA with protease inhibitors.
Proteins were quantified using bicinchoninic acid solution (Sigma-Aldrich, B9643). Equal amounts of protein were run in 4–20% Tris-glycine SDS-PAGE gels (Life Technologies, EC6025) and transferred to nitrocellulose membranes. Membranes were blocked in 5% nonfat dry milk in Tris-buffered saline [TBS] containing Tris (20 mM) and NaCl (150 mM) pH-adjusted to 7.6 with 0.1% Tween-20 (Sigma-Aldrich, P1379) [TBS-T] for 1 h at room temperature and then incubated in primary antibody diluted in 5% nonfat dry milk overnight at 4°C. Primary antibodies used were as follows: ACTA1 (1:200, Santa Cruz Biotechnology, sc-58670), MAP1LC3A (1:1000, Cell Signaling Technology, 4108), ARHGDIA/Rho GDI (Rho GDP dissociation inhibitor alpha) (1:200, Santa Cruz Biotechnology, sc-373724), TOMM70A (1:1000, Proteintech, 14528–1-AP), OPA1 (1:1000, BD Transduction Labs, 612607), DNM1L (1:1000, EMD Millipore, ABT155), ATG5 (1:200, Santa Cruz Biotechnology, sc-133158), SQSTM1 (1:1000, Abcam, ab56416), COX4I1/COX IV (cytochrome c oxidase subunit IV isoform 1) (1:1000, Cell Signaling Technology, 4844), OXPHOS complex cocktail (1:250, Abcam, ab110413), and activated CASP3/Caspase 3 (1:1000, Cell Signaling Technology, 9661). Membranes were washed in TBS-T and incubated in horseradish peroxidase-conjugated anti-mouse (1:3000, KPL, 074–1806) and anti-rabbit (1:3000, KPL, 074–1516) secondary antibodies for 1 h at room temperature. Membranes were washed again in TBS-T and developed with Clarity Western ECL Substrate (Bio-Rad Laboratories Inc., 170–5061) and imaged using a Bio-Rad ChemiDoc XRS (Bio-Rad Laboratories Inc.; Hercules, CA, USA). Densitometry was performed using ImageJ software (NIH).
Immunocytochemistry
Cells were seeded on permanox chamber slides (Thermo Scientific, 177429) and fixed with 4% formaldehyde (Ted Pella, Inc., 18505) in phosphate-buffered saline [PBS] (Gibco, 14200–075) for 10 min and then washed in PBS. Cells were then permeabilized in PBS with 0.25% Triton X-100 (Sigma-Aldrich, T9284) for 10 min. Cells were washed in PBS and blocked in PBS with 5% goat serum (Sigma-Aldrich, G9023). Cells were incubated in primary antibody diluted in PBS with 5% goat serum overnight at 4°C. Primary antibodies used were as follows: MAP1LC3A (1:100, Cell Signaling Technology, 4108), OPA1 (1:100, BD Transduction Labs, 612607), TOMM70A (1:200, Proteintech, 14528–1-AP), PPARGC1A (1:100, Santa Cruz Biotechnology, sc-13067). Cells were washed in PBS and incubated in corresponding fluorescent secondary antibodies (1:100, Life Technologies, A11032, A11034, A21207) and Hoechst 33342 nuclear stain (1:1000; Life Technologies, H1399) for 1 h in the dark at room temperature. Cells were washed and coverslipped with hardset Vectashield mounting medium (Vector Labs, H-1400). Imaging was performed using a Keyence BZ-9000 microscope (Keyence; Osaka, Japan).
Transmission electron microscopy
Cells were lifted from petri dishes using trypsin-EDTA, pelleted at 350 x g for 7 min, rinsed with PBS, and fixed in 4% formaldehyde and 2% glutaraldehyde (Ted Pella, Inc., 18421) in PBS for 1 h and 20 min. Pellet was then rinsed 3 times with PBS before being postfixed in 1% OsO4 (Ted Pella, Inc., 18459) in PBS for 1 h on a rotator. The pellet was then rinsed 3 times with water before being dehydrated in a series of increasing ethanol concentrations (30%, 50%, 70%, 85%, 95%, 100%, 100%, 100%). Following dehydration, pellet was infiltrated with a series of increasing concentrations of Spurr's resin (Ted Pella, Inc., 18300–4221) (33%, 66%, 100%, 100%) in dry acetone and subsequently polymerized at 60°C for 24 h. Resin blocks were sectioned at 65-nm thickness using a Leica UC6 ultramicrotome (Leica Microsystems; Wetzlar, Germany) and sections were mounted on 300-mesh copper grids (Electron Microscopy Sciences, G300-Cu). Sections were positive-stained with uranyl acetate and lead citrate and viewed with a Tecnai T12 transmission electron microscope (FEI; Hillsboro, OR, USA). Images were captured with a Zeiss 215 side-mount digital camera (Carl Zeiss; Oberkochen, Germany) running AMT image capture software.
Flow cytometry
Cells constitutively expressing MitoTimer were trypsinized and fixed in 4% formaldehyde in PBS for 10 min. Fluorescence-activated cell sorting was performed on a BD LSFORTESSA (BD Biosciences; Franklin Lakes, NJ, USA), using a 488-nm laser to detect green fluorescence and a 561-nm laser to detect red fluorescence. 50,000 events were analyzed per sample. Data was analyzed using BD FACSDIVA software.
Respirometry
For fatty acid oxidation analysis on isolated mitochondria, cells were washed, scraped and resuspended at a concentration of 108/ml in ice-cold isolation medium (for buffer recipes see Shirihai lab protocols: (shirihailab.org/uploads/6/2/2/8/6228003/shirihai_lab_isolated_mito_resp_protocol.pdf). Resuspended cells were transferred to a magnetically stirred nitrogen cavitation vessel (Parr Instrument Company; Moline, IL, USA) and the vessel was pressurized with nitrogen gas to 250 lb/in2 at 4°C. After 5 min, the outflow valve was opened and homogenates were collected dropwise followed by removal of nuclei and unbroken cells by sedimentation at 750 x g for 5 min at 4°C. Recovered supernatant fractions were then centrifuged at 7000 x g for 20 min at 4°C to obtain crude mitochondrial pellets which were resuspended in isolation medium and stored on ice while protein concentration was determined via Bradford assay. 12 µg mitochondria were diluted in 50 µl mitochondrial assay solution. The mitochondrial suspension was loaded into the center of each well of the V7 Seahorse microplate (Seahorse Bioscience, 100777–004) which was then centrifuged at 2000 x g for 20 min at 4°C to facilitate adhesion of mitochondria to the microwell surface. Wells were carefully loaded with 450 µl mitochondrial assay solution and the plate was loaded into a Seahorse XF24 extracellular flux analyzer (Seahorse Bioscience; North Billerica, MA, USA). Respiratory function was assessed in the presence of 40 µM palmitoyl carnitine (Sigma-Aldrich, P1645). State III and state IV respiration were assessed following the addition of 0.25 mM ADP (Sigma-Aldrich, A2754) and 1 µM oligomycin (Santa Cruz Biotechnology, sc-201551A), respectively. Uncoupled respiration was determined following the addition of 2.5 µM FCCP ( Sigma-Aldrich, C2920).
Fatty acid oxidation analysis on intact cells was measured with a Seahorse XF24 extracellular flux analyzer according to manufacturer's protocol for extracellular flux assay kit. For “myotube” wells, C2C12s were seeded at 10,000 cells/well in each chamber of an XF24 cell culture microplate. Once cells reached confluence, they were differentiated as described above. When “myotube” wells had been in differentiation media for 3 d, undifferentiated C2C12s were seeded into “myoblast” wells at 10,000 cells/well. Prior to the assay, cells were incubated overnight in substrate-limited media (Seahorse Bioscience, 102353–100) containing 0.5 mM glucose and supplemented with either 0.2 mM palmitate-BSA (Seahorse Bioscience, 102720–100) or fatty acid-free BSA (Sigma-Aldrich, A7030). Basal respiration was monitored prior to the addition of 1 µM oligomycin.
Quantification of mitochondrial interconnectivity
Differentiating C2C12s were stained for TOMM70A and imaged using a Keyence BZ-9000 microscope. Images were then analyzed using ImageJ software with “Mito-Morphology Macro” (URL below). Pixel area/perimeter ratios were used as a measure of mitochondrial interconnectivity. (http://imagejdocu.tudor.lu/doku.php?id=plugin:morphology:mitochondrial_morphology_macro_plug-in:start).
Statistical analysis
Statistical significance was determined using the 2-tailed Student t test. Differences were measured relative to growth media controls. Groups were considered significantly different if P values were less than 0.05. Error bars indicate standard error.
Supplementary Material
Abbreviations
- 3-MA
3-methyladenine
- ARHGDIA
Rho GDP dissociation inhibitor (GDI) alpha
- BAF
bafilomycin A1
- COX4I1
cytochrome c oxidase subunit IV isoform 1
- DNM1L
dynamin 1-like
- MAP1LC3A
microtubule-associated protein 1 light chain 3 alpha
- MTOR
mechanistic target of rapamycin (serine/threonine kinase)
- MYF5
myogenic factor 5
- OCR
oxygen consumption rate
- OPA1
optic atrophy 1 (autosomal dominant)
- OXPHOS
oxidative phosphorylation
- PBS
phosphate-buffered saline
- PD
postdifferentiation
- PPARG
peroxisome proliferator-activated receptor gamma
- PPARGC1A
peroxisome proliferator-activated receptor gamma coactivator 1 alpha
- PPARGC1B
peroxisome proliferator-activated receptor gamma coactivator 1 beta
- RCR
respiratory control ratio
- ROS
reactive oxygen species
- TBS-T
tris-buffered saline with Tween-20
- TOMM70A
translocase of outer mitochondrial membrane 70 homolog A (S. cerevisiae)
Disclosure of Potential Conflicts of Interest
RAG is a consultant for Takeda Pharmaceuticals and is a cofounder of TissueNetix, Inc. The other authors have no potential conflicts of interest to disclose.
Acknowledgments
All transmission electron microscopy was generously performed by the Electron Microscopy Facility at San Diego State University.
Funding
RAG holds the Dorothy and E. Phillip Lyon Chair in Molecular Cardiology in honor of Clarence M. Agress, MD. This work was funded in part by NIH P01 HL112730 (RAG) and NIH T32 HL116273 (JS).
References
- 1.Zhang K, Sha J, Harter ML. Activation of cdc6 by myod is associated with the expansion of quiescent myogenic satellite cells. Journal Cell Biol 2010; 188:39-48; PMID:20048262; http://dx.doi.org/ 10.1083/jcb.200904144 [DOI] [PMC free article] [PubMed] [Google Scholar]
- 2.Cooper RN, Tajbakhsh S, Mouly V, Cossu G, Buckingham M, Butler-Browne GS. In vivo satellite cell activation via myf5 and myod in regenerating mouse skeletal muscle. J Cell Sci 1999; 112(Pt 17):2895-901; PMID:10444384 [DOI] [PubMed] [Google Scholar]
- 3.Fujio Y, Guo K, Mano T, Mitsuuchi Y, Testa JR, Walsh K. Cell cycle withdrawal promotes myogenic induction of akt, a positive modulator of myocyte survival. Mol Cell Biol 1999; 19:5073-82; PMID:10373556; http://dx.doi.org/ 10.1128/MCB.19.7.5073 [DOI] [PMC free article] [PubMed] [Google Scholar]
- 4.Chen TT, Wang JY. Establishment of irreversible growth arrest in myogenic differentiation requires the rb lxcxe-binding function. Mol Cell Biol 2000; 20:5571-80; PMID:10891495; http://dx.doi.org/ 10.1128/MCB.20.15.5571-5580.2000 [DOI] [PMC free article] [PubMed] [Google Scholar]
- 5.Dedieu S, Mazeres G, Cottin P, Brustis JJ. Involvement of myogenic regulator factors during fusion in the cell line c2c12. Int J Dev Biol 2002; 46:235-41; PMID:11934152 [PubMed] [Google Scholar]
- 6.Mastroyiannopoulos NP, Nicolaou P, Anayasa M, Uney JB, Phylactou LA. Down-regulation of myogenin can reverse terminal muscle cell differentiation. PloS One 2012; 7:e29896; PMID:22235349; http://dx.doi.org/ 10.1371/journal.pone.0029896 [DOI] [PMC free article] [PubMed] [Google Scholar]
- 7.Wagatsuma A, Sakuma K. Mitochondria as a potential regulator of myogenesis. ScientificWorldJournal 2013; 2013:593267; PMID:23431256; http://dx.doi.org/ 10.1155/2013/593267 [DOI] [PMC free article] [PubMed] [Google Scholar]
- 8.Leary SC, Battersby BJ, Hansford RG, Moyes CD. Interactions between bioenergetics and mitochondrial biogenesis. Biochim Biophy Acta 1998; 1365:522-30; PMID:9711303; http://dx.doi.org/ 10.1016/S0005-2728(98)00105-4 [DOI] [PubMed] [Google Scholar]
- 9.Remels AH, Langen RC, Schrauwen P, Schaart G, Schols AM, Gosker HR. Regulation of mitochondrial biogenesis during myogenesis. Mol Cell Endocrinol 2010; 315:113-20; PMID:19804813; http://dx.doi.org/ 10.1016/j.mce.2009.09.029 [DOI] [PubMed] [Google Scholar]
- 10.Duguez S, Feasson L, Denis C, Freyssenet D. Mitochondrial biogenesis during skeletal muscle regeneration. Am J Physiol Endocrinol Metab 2002; 282:E802-809; PMID:11882500; http://dx.doi.org/ 10.1152/ajpendo.00343.2001 [DOI] [PubMed] [Google Scholar]
- 11.Wagatsuma A, Kotake N, Yamada S. Muscle regeneration occurs to coincide with mitochondrial biogenesis. Mol Cell Biochem 2011; 349:139-147; PMID:21110070; http://dx.doi.org/ 10.1007/s11010-010-0668-2 [DOI] [PubMed] [Google Scholar]
- 12.Burattini S, Ferri P, Battistelli M, Curci R, Luchetti F, Falcieri E. C2c12 murine myoblasts as a model of skeletal muscle development: Morpho-functional characterization. Eur J Histochem 2004; 48:223-33; PMID:15596414 [PubMed] [Google Scholar]
- 13.Kellerer M, Koch M, Metzinger E, Mushack J, Capp E, Haring HU. Leptin activates pi-3 kinase in c2c12 myotubes via janus kinase-2 (jak-2) and insulin receptor substrate-2 (irs-2) dependent pathways. Diabetologia 1997; 40:1358-62; PMID:9389430; http://dx.doi.org/ 10.1007/s001250050832 [DOI] [PubMed] [Google Scholar]
- 14.Hernandez G, Thornton C, Stotland A, Lui D, Sin J, Ramil J, Magee N, Andres A, Quarato G, Carreira RS, Sayen MR, Wolkowicz R, Gottlieb RA. Mitotimer: A novel tool for monitoring mitochondrial turnover. Autophagy 2013; 9:1852-1861; PMID:24128932; http://dx.doi.org/ 10.4161/auto.26501 [DOI] [PMC free article] [PubMed] [Google Scholar]
- 15.Ikeda Y, Shirakabe A, Maejima Y, Zhai P, Sciarretta S, Toli J, Nomura M, Mihara K, Egashira K, Ohishi M, Abdellatif M, Sadoshima J. Endogenous drp1 mediates mitochondrial autophagy and protects the heart against energy stress. Circ Res 2015; 116(2):264-78; Epub 2014; http://dx.doi.org/ 10.1161/CIRCRESAHA.116.303356 [DOI] [PubMed] [Google Scholar]
- 16.Cuervo AM. Autophagy and aging: Keeping that old broom working. Trends Genet 2008; 24:604-12; PMID:18992957; http://dx.doi.org/ 10.1016/j.tig.2008.10.002 [DOI] [PMC free article] [PubMed] [Google Scholar]
- 17.Yamahara K, Kume S, Koya D, Tanaka Y, Morita Y, Chin-Kanasaki M, Araki H, Isshiki K, Araki S, Haneda M, Matsusaka T, Kashiwagi A, Maegawa H, Uzu T.Obesity-mediated autophagy insufficiency exacerbates proteinuria-induced tubulointerstitial lesions. J Am Soc Nephrol 2013; 24:1769-81; PMID:24092929; http://dx.doi.org/ 10.1681/ASN.2012111080 [DOI] [PMC free article] [PubMed] [Google Scholar]
- 18.Yang L, Li P, Fu S, Calay ES, Hotamisligil GS. Defective hepatic autophagy in obesity promotes er stress and causes insulin resistance. Cell Metabol 2010; 11:467-78; PMID:20519119; http://dx.doi.org/ 10.1016/j.cmet.2010.04.005 [DOI] [PMC free article] [PubMed] [Google Scholar]
- 19.Faulkner JA, Larkin LM, Claflin DR, Brooks SV. Age-related changes in the structure and function of skeletal muscles. Clin Exp Pharmacol Physiol 2007; 34:1091-6; PMID:17880359; http://dx.doi.org/ 10.1111/j.1440-1681.2007.04752.x [DOI] [PubMed] [Google Scholar]
- 20.Conboy IM, Conboy MJ, Smythe GM, Rando TA. Notch-mediated restoration of regenerative potential to aged muscle. Science 2003; 302:1575-7; PMID:14645852; http://dx.doi.org/ 10.1126/science.1087573 [DOI] [PubMed] [Google Scholar]
- 21.Shefer G, Rauner G, Yablonka-Reuveni Z, Benayahu D. Reduced satellite cell numbers and myogenic capacity in aging can be alleviated by endurance exercise. PloS One 2010; 5:e13307; PMID:20967266; http://dx.doi.org/ 10.1371/journal.pone.0013307 [DOI] [PMC free article] [PubMed] [Google Scholar]
- 22.Mizushima N, Levine B. Autophagy in mammalian development and differentiation. Nat Cell Biol 2010; 12:823-30; PMID:20811354; http://dx.doi.org/ 10.1038/ncb0910-823 [DOI] [PMC free article] [PubMed] [Google Scholar]
- 23.Zhuang WZ, Long LM, Ji WJ, Liang ZQ. Rapamycin induces differentiation of glioma stem/progenitor cells by activating autophagy. Chinese J Cancer 2011; 30:712-20.; PMID:21959048; http://dx.doi.org/ 10.5732/cjc.011.10234 [DOI] [PMC free article] [PubMed] [Google Scholar]
- 24.Folmes CD, Nelson TJ, Martinez-Fernandez A, Arrell DK, Lindor JZ, Dzeja PP, Ikeda Y, Perez-Terzic C, Terzic A. Somatic oxidative bioenergetics transitions into pluripotency-dependent glycolysis to facilitate nuclear reprogramming. Cell Metab 2011; 14:264-71; PMID:21803296; http://dx.doi.org/ 10.1016/j.cmet.2011.06.011 [DOI] [PMC free article] [PubMed] [Google Scholar]
Associated Data
This section collects any data citations, data availability statements, or supplementary materials included in this article.


