

Abstract
Background
Inability to accurately identify parathyroid glands during cervical endocrine surgery hinders patients from achieving post-operative normocalcemia. An intrinsic near-infrared fluorescence method was developed for real-time parathyroid identification with high accuracy. This study assesses the clinical utility of this approach.
Methods
Autofluorescence measurements were obtained from 137 patients (264 parathyroid glands) undergoing parathyroidectomy and/or thyroidectomy. Measurements were correlated to disease state, calcium levels, parathyroid hormone (PTH), vitamin D levels, age, sex, ethnicity and body-mass index (BMI). Statistical analysis identified which factors significantly affect parathyroid detection.
Results
High parathyroid fluorescence was consistently detected and showed wide variability across patients. Near-infrared fluorescence was used to correctly identify 256/264 (97%) of glands. The technique showed high accuracy over a wide variety of disease states, though patients with secondary hyperparathyroidism demonstrated confounding results. Analysis revealed BMI (P<0.01), disease state (P<0.01), vitamin D (P<0.05), and calcium levels (P<0.05) account significantly for variability in signal intensity. Age, gender, PTH, and ethnicity had no effect.
Conclusions
This intrinsic fluorescence-based intraoperative technique can accurately detect nearly all parathyroid glands in real-time. Its discrimination capacity is largely unlimited by patient variables, but several factors affect signal intensity. These results demonstrate potential clinical utility of optical guidance for parathyroid detection.
Introduction
Insufficient or inaccurate identification of the parathyroid glands during thyroidectomy and parathyroidectomy procedures can lead to surgical complications. The incidence of inadvertent parathyroidectomy during thyroidectomy ranges from 8 - 19% (1) and may result in post-operative hypocalcemia. Surgical cure for patients with hyperparathyroidism is dependent on adequate resection of hypersecreting parathyroid glands. If not accomplished, patients may suffer from persistent hyperparathyroidism and require reoperation. Development of preoperative parathyroid imaging modalities has improved surgical success rate (2); however, surgeons must still rely on visual assessment during surgery to identify parathyroid glands. The accuracy of this approach is highly dependent on the experience level of the surgeon (3).
Parathyroid detection presents greatest difficulty in cases such as total thyroidectomy (TT), completion thyroidectomy (CT), central neck lymph node dissection, and reoperative thyroid and parathyroid procedures. The larger extent of dissection during TT and central neck lymphadenectomy poses greater risk of inducing iatrogenic surgical trauma and compromised blood supply to the parathyroid glands (4). Difficulty in reoperative and CT procedures is due to the formation of scar tissue and fibrosis, which distorts normal dissection planes and anatomic relationships (5). During parathyroidectomy, ectopic glands and multiple gland disease also present obstacles to adequate resection and surgical success (3). Intraoperative rapid parathyroid hormone assay is one technique for confirming complete removal of hyperfunctioning glands and in some cases to confirm the correct identification of parathyroid tissue. Intraoperative parathyroid aspiration is another technique for confirmation that requires finding the gland, aspirating it with a needle, and analyzing the aspirate for PTH (6). There remains a clinical need for an intraoperative technique to detect the parathyroid gland instantly and with high accuracy.
To fill this clinical need, we have previously demonstrated the capability of a novel parathyroid detection technique using near-infrared (NIR) fluorescence spectroscopy (7-9). The parathyroid glands have been shown to emit a NIR autofluorescence signal that is stronger than that of the thyroid and all surrounding tissues in the surgical bed. Unlike current preoperative parathyroid detection modalities, this method provides real-time, intraoperative feedback with high accuracy. Intrinsic fluorescence is the basis of this technique, which obviates the need for potentially non-specific or toxic external contrast agents. The fluorophore in the parathyroid gland is currently unknown. A more thorough understanding of the sources contributing to variability in parathyroid fluorescence intensity is necessary and may provide insight into the fluorescence etiology.
This new surgical technique must be proven to be capable of handling the full spectrum of inter-patient variability prior to clinical adoption. The goal of this study then is to establish the clinical utility for this novel intraoperative parathyroid detection technique. This will be determined by assessing the effects of pathologic, clinical and demographic patient variables on the parathyroid fluorescence signal. We present NIR fluorescence spectra acquired from patients undergoing cervical endocrine surgery. Patient factors such as body-mass index, metabolite levels, disease type, or hormone levels, age, and gender underwent statistical analysis for their effects on the parathyroid detection rate. The results suggest NIR fluorescence spectroscopy is ready for clinical implementation as a parathyroid detection tool by showing its effectiveness over a variety of clinical presentations.
Methods
Patient Selection
Informed written consent from all patients enrolled in the study which was approved by the Institutional Review Board (IRB) of Vanderbilt University (# 070795). All patients 18 – 99 years of age who presented at the Vanderbilt Endocrine Surgery Center for thyroidectomy and/or parathyroidectomy were eligible for enrollment into the study. Patient eligibility was evaluated by the attending surgeon during preoperative assessment at the Vanderbilt University Endocrine Surgery Center. One hundred thirty-seven patients were enrolled for intraoperative fluorescence detection of the parathyroid glands.
Fluorescence Measurement
The surgical procedure was conducted as called for by the disease presentation. During dissection, at least one parathyroid gland was identified. The tissue was exposed such that the 2 mm tip of the optical probe could directly contact the surface of the tissue. NIR autofluorescence spectra were collected from parathyroid, thyroid, muscle, and fat using a custom, portable NIR fluorescence spectroscopy system (7, 9). A total of 264 parathyroid glands from 137 patients were measured with one to four glands measured per patient. The system consists of a 785-nm diode laser (IPS, Monmouth Junction, NJ, I0785SL0050PA), sterile fiber optic probe (EMVision, Loxahatchee, FL), and spectrometer (Ocean Optics, Dunedin, FL, S2000-FL) all controlled by a laptop computer. The fiber optic probe irradiated tissue with 80 mW of light and a 400-μm spot size for an integration time of 300 ms. Six spectra were collected per tissue site with the overhead lights turned off, taking approximately 4 seconds for each spot measured Fluorescence measurements were validated using tissue histology as the gold standard when available. In cases where the parathyroid was not removed, the confidence level of the surgeon in their visual identification was noted (high, medium, or low). Low confidence measurements were excluded from the study. To account for day-to-day system variations, each fluorescence spectra from a given patient was divided by the peak fluorescence intensity of the thyroid of that same patient to yield what is referred to throughout the study as normalized fluorescence. Further calibration and post-processing was performed as described previously (7). Parathyroid glands were deemed “undetectable” if their normalized peak fluorescence intensity was less than 1, because this indicated the parathyroid fluorescence was not greater than thyroid fluorescence of that individual patient.
Data Analysis
Patient variables were collected and maintained in an IRB-approved database. To assess the effect of pathology on parathyroid detection, the detection rate was characterized as a function of disease state. Detection rate is defined as the number of parathyroid glands identified with NIR fluorescence spectroscopy divided by the number of glands identified using histology or visual identification by the surgeon. For further statistical analysis, patients were then stratified according to demographic and clinical variables to determine their effects on the NIR fluorescence signal in the parathyroid. Variables included age (continuous between 18-99 years of age), gender (male or female), ethnicity (Caucasian or not Caucasian), and body-mass index (BMI) (normal or overweight/obese) at time of surgery, disease state (benign thyroid disease, malignant thyroid disease, hyperthyroidism, hyperparathyroidism or concurrent parathyroid and thyroid disease), total 25-hydroxyvitamin D level (low or normal), serum calcium levels (normal or high), and parathyroid hormone (PTH) levels (normal and high) measured preoperatively.
A multi-way analysis of variance (ANOVA) test was used to analyze the effect of patient variables on normalized peak parathyroid fluorescence measurements. Before analysis, outlier measurements were identified and excluded using Cook’s distance analysis (10). Unavailability of all lab tests across patients precluded a fully balanced design so two separate ANOVAs were carried out: (1) Effect of disease state, calcium, BMI, age, gender, and ethnicity on parathyroid signal across all patients; (2) Effect of vitamin D and PTH levels on parathyroid signals of patients undergoing parathyroidectomy procedures. Multiple t-tests were performed for pairwise comparison of patient variables showing significance in the ANOVA. Overall significance was 0.05, and Bonferroni’s correction was applied to account for multiple comparisons.
Alternative sources of variability
Alternative sources of variability including intraglandular spatial variability and effect of contact pressure were investigated. For analysis of the intraglandular differences, fluorescence measurements were collected at five different locations within the same tissue specimen of a patient in five patients. In each location, 6 consecutive spectra were measured to get an average fluorescence spectra. The effect of probe-to-tissue contact pressure on parathyroid fluorescence intensity was also examined in vivo and in vitro. During surgery, fluorescence measurements were collected where the surgeon indicated the probe contact pressures qualitatively to be “light”, “medium”, and “heavy”. Additionally, in vitro measurements were performed on excised fresh frozen human parathyroid tissue while controlling probe pressure from 0 – 60 Newtons/cm2 using a scale to measure the force of the probe on the tissue. Differences in peak fluorescence intensity were determined as a function of probe contact pressure.
Results
Fluorescence measurements were collected from 264 parathyroid glands in 137 patients undergoing parathyroidectomy and/or thyroidectomy. The fluorescence measurements of 69 parathyroid glands were confirmed with histology. Of the glands that could not be confirmed with histology, 88% were identified as parathyroid glands with high confidence and 12% with medium confidence using the visual assessment of the surgeon. A typical fluorescence spectra is shown in Figure 1A. The normalized peak parathyroid fluorescence intensity varied from 1.2 to 29 times greater than peak thyroid fluorescence for the detectable parathyroid glands (Figure 1B). Parathyroid NIR autofluorescence was consistently greater than the thyroid and all surrounding tissues in 97% (256 of 264) of glands measured. Muscle, fat, lymph nodes, thymus, and trachea showed little to no fluorescence signal.
Figure 1.
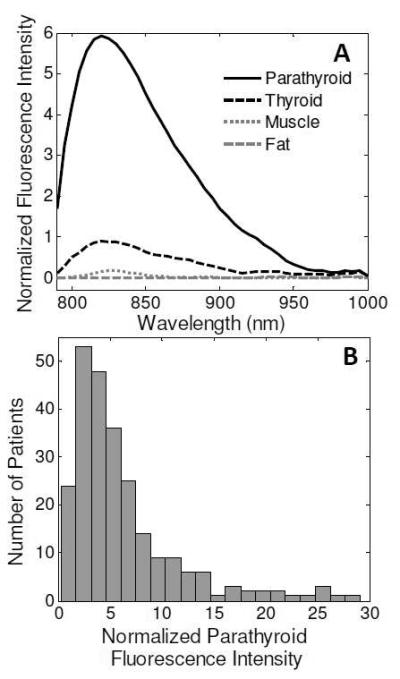
A) Typical near-infrared fluorescence spectra of parathyroid, thyroid, muscle, and fat in a single patient. B) Variability in parathyroid signal across 137 patients. The boxplot shows median, range, and interquartile range and outliers of normalized peak parathyroid signal. Black dots represent fluorescence intensity for each parathyroid measurement collected.
Accuracy of Parathyroid Detection
NIR fluorescence spectroscopy demonstrated 100% parathyroid detection accuracy in patients with toxic and non-toxic nodular goiter, Hashimoto’s thyroiditis, follicular and Hürthle cell thyroid adenoma, medullary thyroid carcinoma, Graves’ disease, and primary and tertiary hyperparathyroidism (Table 1). Patients with well-differentiated thyroid cancer showed 98% detection accuracy (56 of 57 glands), and patients with concomitant parathyroid and thyroid disease exhibited a 94% detection accuracy (16 of 17 glands). The lower accuracy observed in each of these two disease states was a result of a single gland emitting low fluorescence signal. Reduced performance was recorded in the specific case of patients with renal-induced secondary hyperparathyroidism (sHPT), where NIR fluorescence spectroscopy was able to detect 54% of parathyroid glands (7 of 13 glands). All parathyroid glands with low signal were histologically confirmed to be parathyroid tissue, with the exception of the gland from the patient with well-differentiated thyroid cancer. Because parathyroid fluorescence was not significantly different from thyroid fluorescence in secondary hyperparathyroidism patients, measurements from the four sHPT patients were excluded from subsequent analysis and discussed separately in more detail.
Table 1.
Detection rate of parathyroid glands using near-infrared fluorescence spectroscopy in patients across all disease states.
| All patients categorized by disease state | ||||
|---|---|---|---|---|
| Disease Type | Total patients (Total glands) |
Average Normalized Parathyroid Fluorescence |
Standard Error |
Detection rate |
| Nontoxic nodular goiter | 16 (25) | 7.34 | 1.12 | 100% (25 of 25) |
| Toxic multinodular goiter | 8 (20) | 7.30 | 0.81 | 100% (20 of 20) |
| Hashimoto’s thyroiditis | 8 (19) | 6.55 | 0.91 | 100% (19 of 19) |
| Graves disease | 16 (28) | 8.67 | 1.51 | 100% (28 of 28) |
| Differentiated thyroid cancer | 30 (57) | 5.53 | 0.51 | 98.2% (56 of 57) |
| Thyroid adenoma (follicular or hurthle cell) | 9 (16) | 7.36 | 1.29 | 100% (16 of 16) |
| Medullary thyroid cancer | 1 (1) | 3.47 | NA | 100% (1 of 1) |
| Primary hyperparathyroidism | 34 (60) | 4.91 | 0.61 | 100% (60 of 60) |
| Primary hyperparathyroidism with multigland hyperplasia | 2 (5) | 3.07 | 0.53 | 100% (5 of 5) |
| Secondary hyperparathyroidism | 4 (13) | 1.15 | 0.13 | 53.8% (7 of 13) |
| Tertiary hyperparathyroidism | 1 (3) | 2.99 | 0.44 | 100% (3 of 3) |
| Concurrent parathyroid and thyroid disease | 8 (17) | 7.71 | 2.38 | 94% (16 of 17) |
Analysis of Variability in Parathyroid Fluorescence
Pertinent patient demographics and clinical characteristics are summarized in Table 2. Multi-way ANOVA tests showed the following factors have a significant effect on parathyroid fluorescence intensity: disease state (P = 0.008), BMI (P = 0.0018), preoperative calcium levels (P = 0.012), and preoperative vitamin D levels (P = 0.026). No significant differences in the parathyroid signal were found due to age, gender, ethnicity, and parathyroid hormone levels. Prior to conducting ANOVA tests, four parathyroid measurements were determined to be outliers using Cook’s distance. Though these four glands were detected with NIR fluorescence spectroscopy, they were excluded from analysis due to their high fluorescence signal. The high normalized fluorescence intensity in these glands were due to low levels of thyroid fluorescence in these patients. Low thyroid fluorescence may be due to measurements localized in cystic or high fat areas of the thyroid gland.
Table 2.
Clinical and demographic patient characteristics and results of multiway ANOVA test.
|
Patient Factor (Mean, Range) |
No. of
patients in category (No. of glands) |
P-value |
|---|---|---|
| BMI (μ=30 kg/m2, Range=18.5-56 kg/m2) | 0.0018 | |
| Normal (18.5-24.9 kg/m2) | 26 (52) | |
| Overweight/Obese (>25 kg/m2 ) | 106 (195) | |
|
| ||
| Age (μ=53 years, Range=20-87 years) | 0.64 | |
|
| ||
| Disease state | 0.008 | |
| Benign thyroid disease | 33 (60) | |
| Malignant thyroid disease | 29 (54) | |
| Hyperthyroidism | 25 (49) | |
| Hyperparathyroidism | 37(68) | |
| concurrent thyroid and parathyroid disease | 8 (16) | |
|
| ||
| Ethnicity | 0.57 | |
| Caucasian | 125 (237) | |
| Not caucasian | 8 (10) | |
|
| ||
| Gender | 0.32 | |
| Male | 21 (42) | |
| Female | 112 (205) | |
|
| ||
| Serum Calcium Level (μ=9.9 mg/dL, Range=8.5-13.6 mg/dL) | 0.012 | |
| Normal (8.5 - 10.5 mg/dL) | 93 (177) | |
| High (>10.5 mg/dL) | 33 (47) | |
|
| ||
| Parathyroid Hormone (μ = 365 pg/mL, Range = 21-2500 pg/mL) | 0.67 | |
| Normal (10 - 65 pg/mL) | 3 (7) | |
| High (65 - 200 pg/mL) | 22 (40) | |
| Very High (>200 pg/mL) | 22 (42) | |
|
| ||
| Vitamin D (μ=34 ng/mL, Range=8-66 ng/mL) | 0.026 | |
| Low (<30 ng/mL) | 25 (41) | |
| Normal (30 - 80 ng/mL) | 32 (65) | |
μ is the mean value for each patient factor
Pairwise comparisons were performed to assess the individual effects of each factor identified to be statistically significant different in the ANOVA analysis (Figure 2A-D). These tests disclosed that patients with hyperparathyroidism have significantly lower peak parathyroid signal compared to patients with hyperthyroidism (P < 0.01) and malignant thyroid disease (P < 0.05). Parathyroid glands of patients with overweight/obese BMI have significantly lower peak fluorescence signal than that of patients with normal BMI (P < 0.001). Significantly lower parathyroid fluorescence signals were measured in patients with high serum calcium levels compared to patients with normal calcium levels (P < 0.01). Finally, patients with low vitamin D levels showed significantly lower parathyroid fluorescence signals than patients with normal vitamin D levels (P < 0.05). It should be noted that in all these patients, the parathyroid intensities were consistently greater than thyroid intensities.
Figure 2.
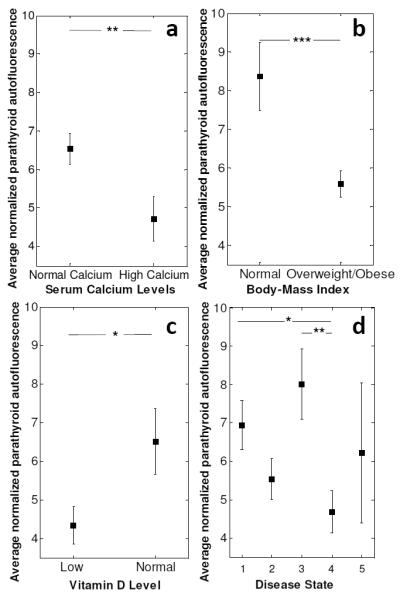
Average near infrared auto-fluorescence signal from parathyroid glands of patients with A) Normal (8.5 -10.5 mg/dL) and high (>10.5 mg/dL) serum calcium levels, B) Normal BMI (18.5 – 24.9 kg/m2) and high BMI (>25 kg/m2), C) Low (< 30 ng/dL) and high (30 – 80 ng/dL) total vitamin D levels, D) Benign thyroid disease-1, malignant thyroid disease-2, hyperthyroidism-3, hyperparathyroidism-4. Error bars indicate standard error of mean. Error bars indicate standard error of mean. Asterisks indicate significant differences (*p<0.05, **p<0.01, ***p<0.001)
Low Fluorescence in Secondary Hyperparathyroidism Patients
When patients with sHPT are separated out from patients with other disease states, the accuracy of fluorescence spectroscopy for parathyroid detection is 54% in sHPT patients compared to 99% in all other disease states. A closer look at the four sHPT patients revealed that each patient had at least one gland with high autofluorescence signal (Figure 3A). Histopathological analysis was performed on two glands that showed high and low fluorescence signals within the same sHPT patient to evaluate the cellular differences for the observed reduction in fluorescence signal. The gland with low fluorescence signal (Figure 3B) showed diffuse chief cell hyperplasia with expanded lobules and some fibrosis with very little fat. In contrast, the parathyroid gland with higher fluorescence (Figure 3C) showed water clear nodules and oxyphil patterns amidst the diffuse chief cell hyperplasia. Both glands were made up of 1 - 5% fat, which is much lower than normocellular parathyroid glands which typically has 10 -25% fat content.
Figure 3.

A) Summary of glands removed from secondary hyperparathyroidism patients. Patient 4 had two glands removed with varying signal intensity. A) H&E stain of gland 1 of Patient 4 shows diffuse chief cell hyperplasia. B) H&E stain of gland 2 of Patient 4 shows water clear cell and oxyphil cell nodules amidst diffuse chief cell hyperplasia. (2x magnification with 10x inset).
Alternative sources of variability
Additional factors that add to the variability in parathyroid fluorescence of all patients were also characterized. Intraglandular spatial heterogeneity in both parathyroid and thyroid measurements contributed to the variability in peak fluorescence intensity. As exemplified in one patient shown in Figure 4A, the fluorescence signal in five unique locations across the surfaces of both the parathyroid and thyroid gland showed a wide spread. In this patient, the mean and standard deviation of parathyroid and thyroid peak fluorescence was 4.99 +/− 0.97 and 1.00 +/− 0.10 a.u, respectively. This same trend was observed across all five patients measured. In another patient, the lowest intensity parathyroid fluorescence measurements overlapped the highest intensity thyroid measurement, indicating if those two points were collected in isolation, that particular parathyroid gland would not have been detected by NIR fluorescence spectroscopy. However, the parathyroid intensity is greater than the thyroid when multiple measurements from each tissue are averaged. Probe contact pressure demonstrated a consistent inverse relationship to peak parathyroid fluorescence intensity (Figure 4B). A decreasing trend in parathyroid fluorescence from 1 to 0.86 (relative to peak fluorescence at 0 N/cm2) was observed in vitro when varying probe contact pressure on the parathyroid from 0 – 60 N/cm2. This decreasing trend in parathyroid fluorescence was also observed in vivo when the probe contact pressure varied from surgeon-determined “light”, “medium”, and “heavy” levels.
Figure 4.

Additional sources of variability. A) Intra-gland spatial heterogeneity contributes to variability in parathyroid and thyroid fluorescence signal. Each black dot corresponds to the fluorescence peak measured from a different location in a single gland. B) Probe contact pressure is inversely related to parathyroid fluorescence. In vitro measurements performed with controlled pressure from 0 – 60 N/cm2. In vivo measurements performed with surgeon’s assessment of “light”,“medium”, and “heavy” contact pressure.
Discussion
Parathyroid detection during cervical endocrine procedures can pose difficulty to even the most experienced surgeons. Inadvertent parathyroid trauma or removal during thyroidectomy and insufficient removal of hypersecreting glands during parathyroidectomy are well-recognized surgical complications (5). To address this problem, we have developed a tool for real-time intraoperative parathyroid detection using NIR autofluorescence spectroscopy. The basis for this technique is an intrinsic fluorescence signal emitted from the parathyroid gland at a higher intensity than all other surrounding neck tissues (7-9). Although the feasibility of the technique has been shown over a large patient population (9), the wide variability in the intensity of the high NIR autofluorescence signal has not been characterized thus far.
This study determines whether pathologic, clinical and demographic patient factors correlate with the variability in the signal intensity of parathyroid glands using NIR fluorescence spectroscopy. The results indicate that this technique offers high levels of accuracy for parathyroid detection in patients presenting with a variety of thyroid and parathyroid disease states and regardless of clinical and demographic factors. Studies show that parathyroidectomy for primary hyperparathyroidism has a >95% success rate in the hands of an experienced endocrine surgeon. Failure to detect the parathyroid gland is more prevalent in centers with lower volumes of parathyroidectomy and thyroidectomy cases (3). Furthermore, lack of clear parathyroid identification during thyroidectomy can lead to an increased incidence of permanent hypoparathyroidism (4). NIR fluorescence spectroscopy has demonstrated detection accuracy ranging from 94% to 100% in all but 4 patients studied thus far which include patients with toxic and non-toxic nodular goiter, Hashimoto’s thyroiditis, follicular and Hürthle cell thyroid adenoma, well-differentiated and medullary thyroid carcinoma, primary and tertiary hyperparathyroidism, Graves’ disease, and concurrent parathyroid and thyroid disease. The accuracy of this technique indicates its potential utility to improve parathyroid detection and hence surgical outcomes.
This study included four patients (13 glands) with renal-induced sHPT (out of 137 patients), where a low parathyroid detection rate was observed in each of these patients. Twenty-six million American adults have chronic kidney disease, and over 60% of these patients are at risk for the development of sHPT and 10% will require parathyroidectomy (11). In this study, 54% of glands from the four patients with sHPT emitted detectable levels of normalized fluorescence compared to 94-100% of glands in all other patients. Each patient had 2 to 4 hypersecreting glands measured and 1 to 3 of those glands in each patient emitted high levels of detectable autofluorescence while the remaining glands showed a low intensity. Interestingly, the parathyroid glands of three patients with multigland hyperplasia unrelated to sHPT (i.e. tertiary hyerperparathyroidism and familial hypocalciuric hypercalcemia) emitted high levels of fluorescence, indicating that some sHPT parathyroid glands may have a unique molecular composition that causes the down-regulation of the fluorescence signal. Varying patterns of chief cell, water clear cell or oxyphil cell hyperplasia as seen in the histological analysis sHPT glands may contribute to varying fluorescence signals. Fat content may also play a role, as parathyroid glands in sHPT patients have decreased fat compared to normocellular glands. Future analysis of the histological features from all disease states will further elucidate these findings.
The performance of traditional parathyroid preoperative imaging techniques such as Sestamibi scintigraphy (SS) and ultrasound (US) is affected by patient factors such as preoperative serum calcium, parathyroid hormone, disease severity, and vitamin D levels (12, 13). Other studies have also reported the influence of factors such as BMI and hormone levels on detection accuracy of optical techniques (14). Based on these studies, we selected age, ethnicity, disease state, preoperative serum calcium, vitamin D, BMI, and PTH levels as patient factors that could potentially be responsible for the variability in the observed parathyroid fluorescence and therefore affect the detection rate of NIR fluorescence spectroscopy. The results reported here show that NIR fluorescence spectroscopy is capable of reliable real-time detection of the parathyroid glands during thyroidectomy and parathyroidectomy regardless of clinical and demographic characteristics of the patient. Certain patient factors, including BMI, disease state, calcium levels, and vitamin D levels, were found to significantly affect the variability in the parathyroid fluorescence across the patient population. However, the parathyroid signal variability associated with these patient factors did not preclude the ability of this technique to successfully detect the parathyroid gland with 94-100% accuracy.
Disease state, BMI, preoperative vitamin D levels and serum calcium levels were shown to contribute to the variability in the parathyroid fluorescence signal, which ranged from 1.2 to 29 times higher than thyroid fluorescence. Patients with normal BMI are shown to emit a significantly higher parathyroid fluorescence signal than in patients who have overweight or obese BMIs. These results suggest that parathyroid compositional changes such as increase in stromal fat at high BMIs (15) may be responsible for the change in fluorescence signal. Patient disease state showed an effect on parathyroid fluorescence intensity with lower signal emitted from patients with primary hyperparathyroidism compared to those with benign thyroid disease or hyperthyroidism. Furthermore, the glands of patients with normal preoperative serum calcium (not low and not high) exhibited significantly higher fluorescence than glands of patients with high serum calcium. This finding along with the low detection rates in sHPT indicate a down-regulation of the parathyroid fluorophore in cases of hypersecreting parathyroid glands. Results indicate that this phenomenon that may be dependent more on the calcium level than the PTH level.
Although the biological basis for the fluorescence signal is not currently known, these results provide indications for potential fluorophore candidates. Calcium-sensing receptors and vitamin D receptors are tentative fluorophore candidates because the levels of these proteins in tissue correspond to the trends observed in the parathyroid fluorescence signal. These proteins show slight down-regulation in primary hyperparathyroidism and more severe down-regulation in secondary hyperparathyroidism (16). Though we believe identifying the fluorophore is not essential for the widespread use of this technology, future knowledge of the biological basis for the fluorescence can expand the use of NIR fluorescence spectroscopy as a surgical guidance tool. Biochemical studies are ongoing to narrow this hypothesis and identify the contributing fluorophore.
Parathyroid detection with NIR fluorescence spectroscopy is not affected by user-induced variability and spatial heterogeneities within a given gland, though these factors did contribute to variability in the fluorescence across patients. The fluorescence signal was shown to decrease as probe contact pressure on the tissue increased both in vitro and in vivo. Increased probe pressure is likely to alter fluorescence intensity due to changes in the absorption and scattering properties of the tissue (17). The range of probe contact pressures applied did not alter the parathyroid gland fluorescence measurement to the extent that it was no longer detected, indicating this technique is capable of handling user-induced variability. The effects of probe contact pressure can be minimized if users are trained to operate at low pressures. Intraglandular spatial heterogeneity was also observed to cause variability in fluorescence measurement at different points within the same gland of the same patient. The reason for the discrepancies in fluorescence across locations may be due to heterogeneous distribution of the fluorophore across the tissue. In one case, the lowest of five parathyroid measurements across a single gland was lower than the highest of five thyroid measurements in the same patient. If these measurements had been collected in isolation, the parathyroid signal would have been considered undetectable by NIR fluorescence spectroscopy. This finding indicates the need for at least three measurements in each gland for accurate identification of the parathyroid gland. Multiple measurements would also minimize the error due to the probe unknowingly slipping off the small gland during surgery. Each fluorescence measurement takes only 300 ms, and as such multiple measurements can be made intraoperatively without adding appreciable time to the procedure. It is also important to note that the parathyroid gland fluorescence is maintained regardless of its vascularity. No change in the parathyroid gland fluorescence was observed when the measurements were made on in vivo vascularized glands versus glands that had been removed and de-vascularized.
Overall, NIR fluorescence spectroscopy is a promising method for parathyroid detection across a diverse patient population. Clinical acceptance of such a technique requires an understanding of all factors present in the patient population. This study shows that this system is able to handle disease, user-induced, and physiologic variability. This study also demonstrated a unique reduction in signal in some of the glands of sHPT patients. This finding will be critical to our improved understanding of the basis of the observed fluorescence. Even though the fluorophore is unknown, this comprehensive study validates the use of this technique in the typical patient population at most major hospitals. This technology is ready for clinical translation through the regulatory process while ongoing research seeks to understand the etiology of the observed autofluorescence. This study gives evidence that use of this device has the potential to improve patient outcome and minimize complications in parathyroid and thyroid procedures.
Acknowledgments
We would like to thank the hospital staff at the Vanderbilt Endocrine Surgery center for their assistance in data collection. This material is based upon work supported by the National Science Foundation Graduate Research Fellowship Program under Grant No. 0909667 and the National Institute of Health under Grant No. NIHR41 EB015291.
Footnotes
Publisher's Disclaimer: This is a PDF file of an unedited manuscript that has been accepted for publication. As a service to our customers we are providing this early version of the manuscript. The manuscript will undergo copyediting, typesetting, and review of the resulting proof before it is published in its final citable form. Please note that during the production process errors may be discovered which could affect the content, and all legal disclaimers that apply to the journal pertain.
References
- 1.Gourgiotis S, Moustafellos P, Dimopoulos N, Papaxoinis G, Baratsis S, Hadjiyannakis E. Inadvertent parathyroidectomy during thyroid surgery: the incidence of a complication of thyroidectomy. Langenbeck’s archives of surgery / Deutsche Gesellschaft fur Chirurgie. 2006 Nov;391(6):557–60. doi: 10.1007/s00423-006-0079-8. PubMed PMID: 16951969. [DOI] [PubMed] [Google Scholar]
- 2.Mohebati A, Shaha AR. Imaging techniques in parathyroid surgery for primary hyperparathyroidism. American journal of otolaryngology. 2012 Jul-Aug;33(4):457–68. doi: 10.1016/j.amjoto.2011.10.010. PubMed PMID: 22154018. Pubmed Central PMCID: 3311773. [DOI] [PMC free article] [PubMed] [Google Scholar]
- 3.Chen H, Wang TS, Yen TWF, Doffek K, Krzywda E, Schaefer S, et al. Operative Failures After Parathyroidectomy for Hyperparathyroidism The Influence of Surgical Volume. Ann Surg. 2010 Oct;252(4):691–4. doi: 10.1097/SLA.0b013e3181f698df. PubMed PMID: WOS:000282369400015. English. [DOI] [PubMed] [Google Scholar]
- 4.Bergamaschi R, Becouarn G, Ronceray J, Arnaud JP. Morbidity of thyroid surgery. Am J Surg. 1998 Jul;176(1):71–5. doi: 10.1016/s0002-9610(98)00099-3. PubMed PMID: WOS:000074852100020. English. [DOI] [PubMed] [Google Scholar]
- 5.Lin DT, Patel SG, Shaha AR, Singh B, Shah JP. Incidence of inadvertent parathyroid removal during thyroidectomy. Laryngoscope. 2002 Apr;112(4):608–11. doi: 10.1097/00005537-200204000-00003. PubMed PMID: WOS:000174970600003. English. [DOI] [PubMed] [Google Scholar]
- 6.Perrier ND, Ituarte P, Kikuchi S, Siperstein AE, Duh QY, Clark OH, et al. Intraoperative parathyroid aspiration and parathyroid hormone assay as an alternative to frozen section for tissue identification. World J Surg. 2000 Nov;24(11):1319–22. doi: 10.1007/s002680010218. PubMed PMID: 11038200. [DOI] [PubMed] [Google Scholar]
- 7.McWade MA, Paras C, White LM, Phay JE, Mahadevan-Jansen A, Broome JT. A novel optical approach to intraoperative detection of parathyroid glands. Surgery. 2013 Dec;154(6):1371–7. doi: 10.1016/j.surg.2013.06.046. PubMed PMID: WOS:000327571200059. English. [DOI] [PMC free article] [PubMed] [Google Scholar]
- 8.Paras C, Keller M, White L, Phay J, Mahadevan-Jansen A. Near-infrared autofluorescence for the detection of parathyroid glands. J Biomed Opt. 2011 Jun;16(6) doi: 10.1117/1.3583571. PubMed PMID: WOS:000293086800038. English. [DOI] [PubMed] [Google Scholar]
- 9.McWade MA, Paras C, White LM, Phay JE, Solorzano CC, Broome JT, et al. Label-free Intraoperative Parathyroid Localization With Near-Infrared Autofluorescence Imaging. The Journal of clinical endocrinology and metabolism. 2014 Dec;99(12):4574–80. doi: 10.1210/jc.2014-2503. PubMed PMID: 25148235. [DOI] [PMC free article] [PubMed] [Google Scholar]
- 10.Cook RD. Detection of Influential Observation in Linear-Regression. Technometrics. 1977;19(1):15–8. PubMed PMID: WOS:A1977CV78500002. English. [Google Scholar]
- 11.Stack BC. [updated January 14, 2014; cited 2015 February 13, 2015];Secondary Hyperparathyroidism: BMJ Best Practice. 2014 Available from: http://bestpractice.bmj.com/best-practice/monograph/1107/basics/epidemiology.html.
- 12.Hughes DT, Sorensen MJ, Miller BS, Cohen MS, Gauger PG. The biochemical severity of primary hyperparathyroidism correlates with the localization accuracy of sestamibi and surgeon-performed ultrasound. J Am Coll Surg. 2014 Nov;219(5):1010–9. doi: 10.1016/j.jamcollsurg.2014.06.020. PubMed PMID: 25086814. [DOI] [PubMed] [Google Scholar]
- 13.Berber E, Parikh RT, Ballem N, Garner CN, Milas M, Siperstein AE. Factors contributing to negative parathyroid localization: an analysis of 1000 patients. Surgery. 2008 Jul;144(1):74–9. doi: 10.1016/j.surg.2008.03.019. PubMed PMID: 18571587. [DOI] [PubMed] [Google Scholar]
- 14.Vargis E, Byrd T, Logan Q, Khabele D, Mahadevan-Jansen A. Sensitivity of Raman spectroscopy to normal patient variability. J Biomed Opt. 2011 Nov;16(11) doi: 10.1117/1.3646210. PubMed PMID: WOS:000298546500038. English. [DOI] [PMC free article] [PubMed] [Google Scholar]
- 15.Iwasaki A, Shan L, Kawano I, Nakamura M, Utsuno H, Kobayashi A, et al. Quantitative analysis of stromal fat content of human parathyroid glands associated with thyroid diseases using computer image analysis. Pathology international. 1995 Jul;45(7):483–6. doi: 10.1111/j.1440-1827.1995.tb03489.x. PubMed PMID: 7551007. [DOI] [PubMed] [Google Scholar]
- 16.Rodriguez M, Nemeth E, Martin D. The calcium-sensing receptor: a key factor in the pathogenesis of secondary hyperparathyroidism. American journal of physiology Renal physiology. 2005 Feb;288(2):F253–64. doi: 10.1152/ajprenal.00302.2004. PubMed PMID: 15507543. [DOI] [PubMed] [Google Scholar]
- 17.Ti Y, Lin WC. Effects of probe contact pressure on in vivo optical spectroscopy. Optics express. 2008 Mar 17;16(6):4250–62. doi: 10.1364/oe.16.004250. PubMed PMID: 18542520. [DOI] [PubMed] [Google Scholar]