

Abstract
Purpose
We investigate whether ocular and person-based characteristics are associated with dark adaptation (DA) measured using the AdaptRx™ device (Apeliotus Technologies, Atlanta, GA).
Design
Cross-sectional, single-center, observational study.
Participants
116 participants >50 years with a range in age-related macular degeneration (AMD) severity.
Methods
Participants underwent best-corrected visual acuity (BCVA) testing, ophthalmoscopic examination and multimodal imaging. Presence of reticular pseudodrusen (RPD) was assessed by masked grading of fundus images and confirmed with OCT. Eyes were also graded for AMD features (drusen, pigmentary changes, late AMD) to generate a person-based AMD severity groups. One eye was designated the study eye for DA testing using the AdaptRx™ device. Nonparametric statistical testing was performed on all comparisons.
Main Outcome Measure
The primary outcome of this study was the rod-intercept time (RIT) which is defined as the time for a participant's visual sensitivity to recover to a stimulus intensity of 5 × 10⁻³ cd/m2 (a decrease of 3 log units), or until a maximum test duration of 40 minutes was reached.
Results
A total of 116 study eyes in 116 participants (mean age=75.4±9.4 years, 58% female) were analyzed. Increased RIT was significantly associated with increasing age (r=0.34, p=0.0002), decreasing BCVA (r=−0.54, p<0.0001), pseudophakia (p=0.03), decreasing subfoveal choroidal thickness (r=−0.27, p=0.003). Study eyes with RPD (15/116, 13%) had a significantly greater mean RIT compared to eyes without RPD in any AMD severity group (p<0.02 for all comparisons) with 80% reaching the DA test ceiling.
Conclusion
Impairments in DA increase with age, worse visual acuity, presence of RPD, AMD severity and decreased subfoveal choroidal thickness. Analysis of covariance found the multivariable model that best fit our data included age, AMD group, and presence of RPD (R2=0.56) with the presence of RPD conferring the largest parameter estimate.
Age-related macular degeneration (AMD) has been the leading cause of severe visual loss in people over 65 years of age in developed countries1. Classification of AMD is based on certain fundus characteristics such as drusen and pigmentary changes that are evaluated on clinical exam, and/or color fundus photographs 2, 3. These features provide information regarding the risk of progression to late AMD 4. In recent years, descriptions of fundus autofluorescence patterns and quantitative measurements on optical coherence tomography provide additional methods for characterizing AMD anatomy5-7. Multi-modal imaging has also revealed additional features that categorize additional anatomic phenotypes such as reticular pseudodrusen5, 8-11.
The assessment of visual function in AMD has primarily centered around visual acuity, which demonstrates the greatest loss in late AMD, but can show some decrease with intermediate AMD 12. Other methods of assessing visual function may provide valuable insights into the mechanism of retinal dysfunction in AMD and may identify risk factors for progression to late AMD. This could lead to further ability to stratify eyes with AMD into subgroups that may be at more or less risk for progression based on findings beyond the anatomic ones currently used.
Dark adaptation is one measure of visual function that has been identified to reveal abnormalities in AMD13-16. The aging process itself is associated with some impairment in dark adaptation as psychophysical studies demonstrate decreases in static scotopic thresholds, rightward shifts of the dark adaptation curve, and a slower recovery rate in older adults compared with younger adults16, 17. Histological examination of donor retinas demonstrates that aging is associated with a steady decline in number and density of rods, while cones are mostly spared18.
AMD patients exhibit even more impairment in dark adaptation compared with the impairment observed in normal aging15. Examination of pathology in AMD eyes demonstrate preferential loss of rod cells in the macula of eyes with early disease compared with age-matched controls with the greatest loss in the region 0.5-3 mm from the fovea19. Previous work has demonstrated that the rod-mediated scotopic sensitivity and recovery time constants are impaired at the parafovea and within the macula of eyes with early and intermediate AMD while sparing cone mediated function14, 15.
A new instrument has been developed to make dark adaptation measurements more feasible in the clinic by decreasing testing duration while maintaining test sensitivity. Focusing on areas 0.5-3mm from the fovea directs testing at anatomic areas thought to be first affected by rod loss, which could potentially increase measurement sensitivity.13, 20 This current study investigates the association between AMD severity and dark adaptation impairment using the AdaptRx™ dark adaptometer (MacuLogix, Atlanta, GA) which performs focal bleach testing in the area of 5 degrees (approximately 1.5mm) from the fovea along the inferior visual meridian. We recruited participants with a range of AMD severity based on the presence of the main fundus features known to be risk factors for progression, including a control group without significant macular findings. We also studied other ocular and person-based characteristics that might be associated with the measurement of dark adaptation, as well as the reproducibility of testing.
METHODS
Study Population
Participants included adults older than 50 years of age both with and without AMD who were recruited from the eye clinic at the National Eye Institute, National Institutes of Health (NIH), Bethesda, MD between May 2011 and January 2014. Patients were excluded for: (1) advanced AMD in both eyes at baseline visit; (2) any other active ocular or macular disease (i.e., glaucoma, diabetic retinopathy, Stargardt disease); (3) a condition preventing compliance with the study assessment; (4) cataract surgery within 3 months prior to enrollment; (5) history of vitamin A deficiency; (6) high oral intake of vitamin A palmitate supplement (≥10,000 international units per day); and (7) active liver disease or history of liver disease. Study eyes were required to have a best-corrected visual acuity (BCVA) ≥ 20/100.
Following examination, eligible participants were separated into groups based on their fundus features. Eligible eyes were screened for the presence of reticular pseudodrusen (grading described below) and these eyes were placed into a separate group (group RPD). The remaining eyes were grouped according to increasing order of AMD severity based on the presence of large drusen (≥125 μm) and/or advanced AMD. The control group, Group 0 consists of participants without any large drusen or advanced AMD (CNV or central GA) in either eye. Group 1 consists of participants with large drusen in one eye only and no late AMD in either eye. Group 2 includes participants with large drusen in both eyes without any late AMD. Group 3 includes participants with large drusen in one eye and late AMD in the other eye (either GA or CNV).
In addition, color fundus images (described below) of both eyes of participants were graded for the presence of large drusen, pigmentary changes, and late AMD (in the fellow eye) to calculate a simplified severity score for each participant4.
Each participant had only one study eye assigned to undergo the dark adaptation testing. In participants without any large drusen, either eye could be designated the study eye. In participants with large drusen in one eye only, the eye with large drusen was the study eye. In participants with large drusen bilaterally, either eye could be the study eye. In participants with advanced AMD in one eye, the non-advanced eye was the study eye. The study was approved by the Institutional Review Board of the National Institutes of Health, and the tenets of the Declaration of Helsinki were followed. Although not a clinical trial the study is registered on ClinicalTrials.gov (NCT01352975). All participants provided informed consent after the nature and possible consequences of the study were explained.
Examination and Imaging
All participants underwent a complete ophthalmoscopic examination, including measurement of best-corrected visual acuity (BCVA) with the ETDRS chart, measurement of intraocular pressure, slit lamp examination, and dilated fundus exam. Presence of AMD features (drusen, pigmentary change, PED, CNV, GA) and other ocular findings (e.g., phakic status) were documented. Color fundus photos and fundus autofluorescence (FAF) images were acquired with the TRC-50DX retinal camera (Topcon Medical Systems, Tokyo, Japan). Infrared reflectance (IR) and FAF images and spectral domain optical coherence tomography (SD-OCT) scans were acquired with the Heidelberg Spectralis (Heidelberg Engineering, Heidelberg, Germany). Each set of SD-OCT scans consisted of 37 B-scans, each of which was composed of 24 averaged scans, obtained within a 30° × 15° rectangle centered on the fovea. In addition, enhanced depth imaging OCT (EDI-OCT) scans were acquired for improved visualization of the choroid in a single horizontal scan centered at the fovea obtained over a distance of 30° consisting of 100 averaged scans.
Dark Adaptation Testing
Dark adaptation (DA) was measured using the AdaptRx™ dark adaptometer (MacuLogix, Atlanta, GA). Details about the testing procedure have been documented elsewhere 13. In brief, the patient's pupil was dilated and the participant was asked to focus on a fixation light. A photoflash producing a 82% focal bleach centered at 5° on the inferior visual meridian was performed, and threshold measurements were made at the same location with a 1.7° diameter, 500-nm wavelength circular test spot using a three-down/one-up modified staircase threshold estimate procedure. The initial stimulus intensity was 5 cd/m2. Threshold measurements were continued until the patient's visual sensitivity recovered to be able to detect a dimmer stimulus intensity of 5 × 10⁻³ cd/m2 (a decrease of 3 log units), or until a maximum test duration of 40 minutes was reached, whichever occurred first. The time to this event was defined as the rod intercept time (RIT), the primary outcome of this study. A measurement used in previous DA studies 20, the RIT corresponds to the time to reach a threshold within in the second component of rod-mediated dark adaptation, and is estimated by linear interpolation of the sensitivity responses. Tests that did not reach this threshold by 40 minutes were reported as “No Rod Intercept” by the machine, and were defined to have a RIT of 40 minutes.
To assess reproducibility of dark adaptation testing with the AdaptRx™, participants returned for repeat dark adaptation testing 1 week after the baseline visit (+/− 7 days).
Grading Reticular Pseudodrusen
To identify cases of reticular pseudodrusen (RPD) within our cohort, masked grading of color, FAF, and IR images from patients’ study eyes was performed by 3 independent graders (CC, JF, SA) trained to identify areas of RPD > 1 disc diameter on each modality (Figure 1AC). RPD were originally described on color fundus photos as “round, oval, or slightly elongated and lobulated yellowish spots with ill-defined edges, 125μm-250μm [...] in size” and an “interlacing network with intervening spaces of background color of 125μm” that had enhanced visibility in blue light 21. Other studies have reported improved sensitivity and specificity with IR and FAF imaging, especially for detecting RPD present in the perifovea 22. RPD on IR have been defined as hyporeflectant lesions against a background of mild hyperreflectance 9, and on FAF, they ae defined as hypofluorescent lesions against a background of mildly elevated autofluorescence 8, 23.
Figure 1.

Representative color (A), fundus autofluorescence (B), and infrared reflectance (C) images from the study eye of a participant in group 2 who had reticular pseudodrusen. Cases of RPD were identified through masked grading of these three imaging modalities for each participant's study eye. Those study eyes that had characteristics consistent with reticular pseudodrusen were confirmed on SD-OCT if subretinal drusenoid deposits (SDD) were observed. A scan through the superior macula of this patient (D) demonstrates numerous SDD located above the RPE. Significant choroidal thinning is also evident.
Reticular pseudodrusen were recorded as being present on a particular modality in a study eye if two or three of the graders scored it as present. Only those eyes that met the criteria of having (1) the presence of RPD on at least one en face imaging modality (color, FAF, IR) and (2) confirmation of previously described findings of hyperrefelctive material located between the retinal pigment epithelium (RPE) and the photoreceptor ellipsoid zone (EZ) on SD-OCT in those areas were designated as having definite RPD (Figure 1D)10. One color image and two fundus autofluorescence images were either unavailable or had insufficient quality for grading; all infrared reflectance images were graded.
Subfoveal Choroidal Thickness Measurements
Subfoveal choroidal thickness (SFCT) in study eyes was measured manually on the foveal EDI-OCT scans using the caliper tool in Eye Explorer software (v. 1.7.0.0). The calipers were drawn perpendicularly from the outer surface of the RPE/Bruch's membrane complex to the inner surface of the chorioscleral interface directly under the center of the fovea. In cases where the choroidal thickness made the chorioscleral interface difficult to visualize, the image brightness and contrast settings were adjusted in Eye Explorer to maximize visibility. EDI scans were not available for 2 study eyes.
Statistical Analysis
The data were analyzed using non-parametric statistics computed using SAS (v.9.3). Interobserver agreement for grading RPD was assessed by calculating Fleiss’ kappa for 3 graders. Categorical variables were analyzed using χ2 and Fisher's exact tests. Continuous variables were analyzed with the Wilcoxon Two-Sample Test and Kruskal-Wallis Test for 2 variables and >2 variables, respectively. Spearman correlation coefficients were calculated for associations with rod intercept time. Analysis of covariance, a method of multivariable analysis allowing for inclusion of continuous and categorical variables, was performed using variables significantly associated with rod intercept time on univariate analysis. Reproducibility was assessed with a Spearman correlation coefficient and a Bland-Altman plot. For all tests, p<0.05 was considered statistically significant.
RESULTS
Participant Demographics
One hundred nineteen participants (ages 51-98 years) were enrolled into the study, and 116 were included in the analysis. The three participants excluded from the analysis included two who were unable to complete dark adaptation testing and one with genetic testing results confirming alternate non-AMD diagnosis.
Ascertainment of Reticular Pseudodrusen in Study Eyes and Participant Demographics
Study eye imaging was graded for the presence of reticular pseudodrusen (RPD). Masked grading of study eye fundus color, FAF, and IR images identified 24 out of 116 study eyes with characteristics consistent with RPD on at least one of these imaging modalities. Of these 24 eyes, 15 were confirmed on SD-OCT to have subretinal drusenoid deposits and were confirmed as “definite” RPD cases. Between the 3 fundus imaging modalities, IR had the highest sensitivity (86.7%), followed by FAF imaging (80%) and color fundus photography (66.7%) (Table 1). Interobserver agreement for color, FAF, and IR imaging had calculated kappas (κ) of 0.55, 0.72, and 0.46, respectively.
Table 1.
Results of Masked Grading for Confirmed Cases of Reticular Pseudodrusen.
| Total | Color | FAF | IR | |
|---|---|---|---|---|
| # of eyes with RPD | 15 | 10 | 12 | 13 |
| # of eyes on 1 modality | 2 | 0 | 1 | 1 |
| # of eyes on 2 modalities | 6 | 3 | 4 | 5 |
| # of eyes on 3 modalities | 7 | 7 | 7 | 7 |
The 15 participants with study eyes identified as having definite RPD (Group RPD) had the following AMD features: 1 RPD participant with no large drusen in either eye, 6 RPD participants with large drusen in both eyes, and 8 participants had advanced AMD in their fellow eye.
The numbers of participants in the remaining groups are: Group 0 = with no large drusen in either eye (n=42), Group 1 large drusen in the study eye only (n=13), Group 2 large drusen in both eyes (n=31), Group 3 advanced disease in the non-study eye (n=15).
The study population was predominantly Caucasian; 59% of participants were female. There were no statistically significant differences between the groups for sex, or race but the group of participants with RPD tended to be older than participants without RPD or drusen (80.9 ± 7.3 vs. 74.8 ± 8.8) years, p<0.05, Table 2).
Table 2.
Baseline Demographic Characteristics by study group
| Characteristic | Group 0 | Group 1 | Group 2 | Group 3 | Group RPD | p |
|---|---|---|---|---|---|---|
| N | 42 | 13 | 31 | 15 | 15 | ---- |
| Mean Age, years (SD) | 74.8 (8.8) | 71.8 (10.8) | 71.8 (9.8) | 76.5 (8.3) | 80.9 (7.3)* | 0.028 |
| Sex, n (%) female | 25 (59.5) | 7 (53.8) | 15 (48.4) | 9 (60.0) | 11 (73.3) | 0.60 |
| Race, n (%) | ||||||
| American Indian/Alaskan Native | 0(0) | 0(0) | 0(0) | 1(6 .7) | 0(0) | |
| Asian | 2(4.8) | 0(0) | 2(6.5) | 0(0) | 1(6.7) | |
| Black | 3(7.1) | 0(0) | 0(0) | 1(6.7) | 0(0) | |
| Caucasian | 37 (88.1) | 13 (100.0) | 29 (93.5) | 13(86.7) | 14 (93.3) | 0.76 |
p<0.05 for pair-wise comparison with group 0
Assessment of Dark Adaptation using the AdaptRx™ device
Figure 2 illustrates dark adaptation curves for participants in each Group. Figure 2A demonstrates representative dark adaptation curves from an individual participant from each group, with the rod intercept time (RIT) for each curve (arrows) defined as the time at which the dark adaptation curve falls below a visual sensitivity threshold of 3 log units. The graph belonging to the patient with RPD is an example of an eye that does not dark adapt to the desired threshold within the 40 minute maximum test time. In the subsequent calculations, study eyes with this result were assigned a RIT of 40 minutes. Figure 2B demonstrates averaged dark adaptation curves per grading group. The range of RIT values of the Adapt Rx test was 6.9 to 40 minutes.
Figure 2.

(A) Representative dark adaptation raw data for individual participants with no large drusen (Group 0), large drusen in the study eye only (Group 1), large drusen in both eyes (Group 2), advanced disease in the non-study eye (Group 3), and reticular pseudodrusen (RPD). The participant with RPD is the same as the one in Figure 1. The rod intercept time is the time required for the patient's visual sensitivity to recover to a stimulus intensity 3 log units dimmer than the initial threshold (arrow). (B) Averaged raw data for each group. The group curves were derived by averaging the fitted values over a grid of points (2 second intervals) from time 0 to 40 minutes based on a 3-component piecewise linear fit to the raw data (excluding fixation errors).
Reproducibility of Dark Adaptation Assessment device
To assess reproducibility of dark adaptation testing, 87 of the 93 participants with baseline RIT values <40 minutes returned 1 week (7.4 ± 3.8 days) following initial baseline assessment to repeat dark adaptation testing under the same parameters. The RIT of the repeated test showed correlation with the baseline testing (Figure 3A, r=0.9542, p<0.0001). A Bland-Altman plot (Figure 3B) also demonstrated that testing was reproducible with a mean RIT difference of 0.02 ± 2.26 min (mean ± SD) and 95% limits of agreement of −4.41 to 4.46 min. The distributions of test-retest differences did not differ significantly between AMD groups, indicating that test reproducibility did not vary with AMD severity (p>0.05 for all comparisons).
Figure 3.

Assessment of dark adaptation testing reproducibility using the AdaptDx™. Participants returned approximately 1 week after their baseline visit to undergo repeat testing. A scatter plot of week 1 vs. baseline rod intercept time (A) and a Bland-Altman plot (B) demonstrate that the test is reproducible.
Association of Dark Adaptation with AMD Severity and the Presence of Reticular Drusen
RIT values for all study eyes were compared in terms of their AMD severity group and the presence/absence of RPD. Figure 4A displays the distribution of RIT values for Groups 0 through 3 and for participants with RPD (Group RPD), and demonstrates that mean RIT increases monotonically with increasing AMD severity group, with Groups 2 and 3 having a significantly greater mean RITs compared with that of Group 0 (p<0.0001 for both comparisons). Eyes in the RPD group showed greatest deficits in dark adaptation, with a mean RIT that was significantly higher than that of all other AMD severity groups (p<0.05 for all comparisons). The mean rod intercept times for study groups were (in minutes): Group 0, 13.3±5.3; Group 1, 17.1±10.5; Group 2, 24.3±10.9; Group 3, 26.6±9.3; RPD Group, 39.1±2.1. The proportion of study eyes in each group that reached the test ceiling of 40 minutes also showed a general increase with increasing AMD severity, with 80% (12 of 15 eyes) of study eyes with RPD reaching the test ceiling compared to 0% (0 of 42 eyes) in Group 0 (Fig. 4B). Of the 20 study eyes reaching the test ceiling, 8 study eyes were outside the RPD group. Review of these eyes indicated that three were identified as having RPD on at least one imaging modality but were not confirmed by OCT, two had non-central GA, and three had numerous large drusen and drusenoid pigment epithelial detachments.
Figure 4.
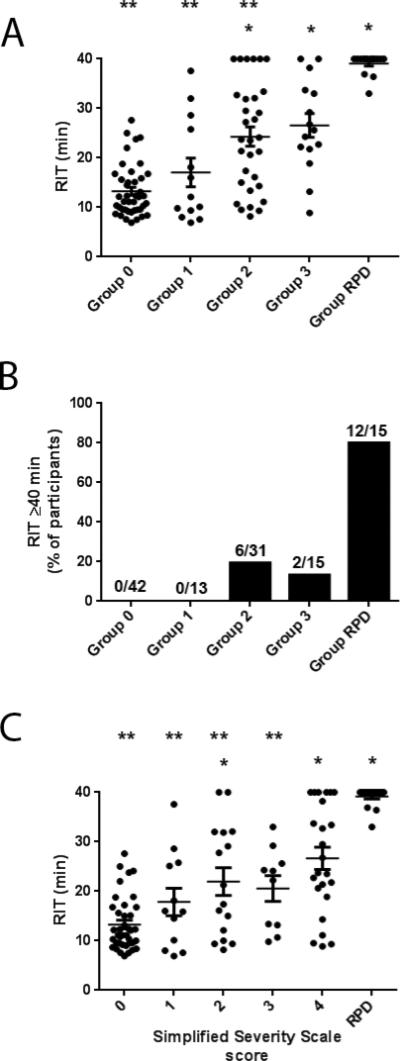
(A) Scatter plot of rod intercept time for study Groups showing mean RIT ± standard error of the mean (SEM). (B) Fundus features per individual used to calculate the participant-based simplified severity scale score. Mean RIT and SEM plotted for one study eye of each participant in each simplified severity scale score group as well as RPD group. * p<0.05 for comparisons to Group 0. ** p < 0.05 for comparisons to Group RPD. (C) Percentage of eyes study eyes reaching time cutoff of 40 minutes demonstrate a significant difference between RPD eyes and all other eyes. *p<0.0001 compared to group 0.
To investigate the dependency of these results on the definition of RPD utilized, we performed the analysis with less stringency on the RPD definition to investigate the effects on the overall result. We recalculated the analysis including eyes that were graded as having RPD on at least two imaging modalities (but relieving the necessity of OCT findings) which resulted in an inclusion of 3 additional eyes in the RPD group (n=18). We also further relaxed the definition to include eyes that were graded as having RPD on any one modality resulting in a total of 24 eyes included in the RPD group. Both analyses again demonstrated increasing mean RIT with increasing AMD severity and with the RPD group demonstrating the greatest deficits in dark adaptation and maintained statistical significance.
We also investigated the effect of the inclusion of eyes with non-central geographic atrophy (n=5) by repeating the analysis with these eyes removed which had no significant effect on the results.
In addition to the AMD severity groupings described above, we examined the association of RIT to an alternative AMD severity scale previously described4. Figure 4C demonstrates that increasing simplified severity score (from 0 to 4) was associated with a trend of increasing mean RIT ; the mean RITs were (in minutes): Score 0, 13.3±5.4; Score 1, 17.9±9.6; Score 2, 22.0±11.2; Score 3, 20.6±8.2; Score 4, 26.7±11.1; RPD Group, 39.1±2.0. This data indicates that dark adaptation deficits tend to increase with increasing AMD severity, and this association is likely to be robust to multiple modes of AMD severity grading and RPD grading.
Association of Dark Adaptation with Ocular Characteristics
While AMD characteristics have been proposed to underlie differences in dark adaptation testing, we also investigated whether there might be other differences between our study groups that may contribute to differences in study group dark adaptation testing results. The following ocular characteristics in study eyes were recorded by AMD severity group: BCVA, pseudophakic status, choroidal thickness as measured from OCT, and presence of pigmentary changes as scored from color fundus photography. Table 3 shows the mean and distribution of these characteristics in each group. Ocular characteristics that differed between the study groups included BCVA (p=0.0007) and prevalence of pigmentary abnormalities (p<0.0001), which were associated with groups 2, 3 and RPD (Table 3). Mean subfoveal choroidal thickness was lower for the Group RPD than all other study groups and was significantly different from group 0 (Figure 5, p=0.005). Group RPD eyes were also more likely to be pseudophakic, a difference that was also statistically significant.
Table 3.
Baseline Ocular Characteristics by study group
| Characteristic | Group 0 | Group 1 | Group 2 | Group 3 | Group RPD | p |
|---|---|---|---|---|---|---|
| Mean BCVA, letters (SD) | 85.4 (5.1) | 85.4 (4.1) | 81.4 (6.4)* | 77.5 (9.9)* | 79.7 (7.8)* | 0.0007 |
| Phakic Status, n (%) pseudophakic | 13 (31.0) | 3 (23.1) | 4 (12.9) | 4 (26.7) | 10 (66.7) | 0.0073 |
| Mean SFCT, μm (SD) | 227.3 (120.6) | 245.8 (79.4) | 233.8 (75.7) | 210.9 (97.9) | 137.1 (62.3)* | 0.0033 |
| Pigmentary Abnormalities, n (%) | 2 (4.8) | 3 (23.1) | 16 (51.6) | 9 (60.0) | 6 (40.0) | <0.0001 |
p<0.05 for pair-wise comparison with group 0
Figure 5.
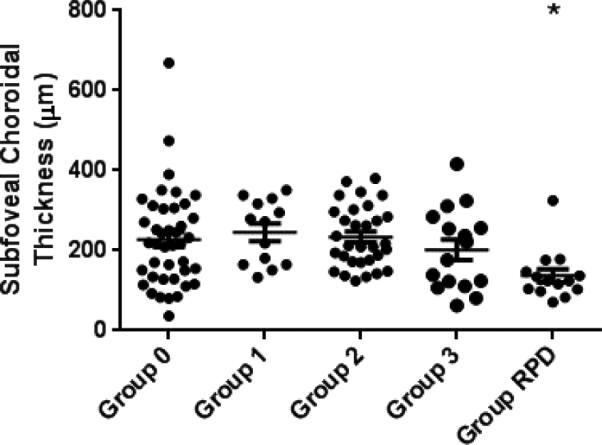
Subfoveal choroidal thickness compared by study group. (*p=0.005 compared to Group 0).
In Figure 6, scatter plots of ocular characteristics versus RIT of all study eyes are shown, with eyes with RPD indicated in red. Increasing age (Figure 6A, r=0.34, p=0.0002) and decreasing BCVA (Figure 6B, r=−0.54, p<0.0001) were significantly associated with increasing RIT. These correlations were investigated further by looking both within Groups 0-3 for correlations and removing groups of eyes that may be confounding. When we examined the relationship of age and BCVA within study groups, only study eyes in group 0 demonstrated correlations of rod intercept time with age (r=0.28, p=0.005) and BCVA (r=−0.60, p<0.0001) that were statistically significant. Removing a study eye with an outlier BCVA of 51 had a minimal effect on the association, which remained statistically significant. We also performed the analysis removing eyes with RPD and found that the correlation of RIT with age and BCVA again remained statistically significant.
Figure 6.

Scatter plots showing the associations of rod intercept time with (A) age, (B) BCVA, (C) subfoveal choroidal thickness, and (D) phakic status. These variables were significantly associated with rod intercept time in univariate analysis. Eyes with RPD are indicated in red.
Decreasing SFCT (Figure 6C, r=−0.27, p=0.0040) and pseudophakia (Figure 6D, p=0.03) were also significantly associated with increasing rod intercept time. Since RPD eyes had significantly decreased choroidal thickness and had a higher prevalence of pseudophakia, when both associations were re-analyzed without these eyes, neither SFCT nor phakic status were significantly associated with rod intercept time.
Other ocular and demographic characteristics were investigated within groups 0-3 including sex, race, presence of small or intermediate drusen in group 0, pigmentary abnormalities, retinal pigment epithelial detachment, and presence of CNV vs. central GA in the fellow eye of group 3 patients. None of these variables was significantly associated with rod intercept time, although a trend of increasing rod intercept time was observed with increasing maximum drusen size in group 0 participants.
Additional grading of horizontal and vertical OCT scans intersecting at the center of the dark adaptation testing spot location was carried out to evaluate associations with local pathology. Few participants in AMD groups 0 or 1 had evidence of any pathology in the test spot location, but those that did had notably lower rod intercept times compared with group averages (data not shown). In Group 2 the presence of any local pathology was associated with a longer mean rod intercept time, while Group 3 patients had similar rod intercept times whether or not any evidence of local pathology was present. A qualitative analysis of those with and without large drusen or drusenoid PED at the testing site in Groups 2 and 3 revealed no clear association with a prolonged rod intercept time (data not shown). Overall, these findings indicate that local pathology is not the sole explanation for dark adaptation abnormalities in AMD.
Analysis of Covariance to Determine Relative Significance of Variables Associated with Rod Intercept Time
An analysis of covariance was performed to assess the relative contributions of variables associated with RIT in univariate analyses. The variables included were age, BCVA, findings of AMD (Group 0, 1, 2, 3), presence of RPD, SFCT, and phakic status. By starting with a model including all six variables and then systematically removing variables, it became evident that when age and BCVA were in the model together, only one remained statistically significant. A similar relationship was observed between presence of RPD and SFCT. AMD severity was significant in all models, while phakic status was never significant. The model that best fit our data included age, AMD group, and presence of RPD (R2=0.56), and all were statistically significant except for AMD group 1 (Table 4). The parameter estimate is the value by which the rod intercept time increased in association with each variable indicating that RIT increases 0.25 minute for each year that age increased after adjustment for AMD features and presence of RPD, while presence of RPD was associated with a 13.3-minute increase in RIT after adjustment for age and AMD features.
Table 4.
Analysis of covariance including variables significantly associated with rod intercept time from univariate analyses.
| Variable | Parameter Estimate | p |
|---|---|---|
| Age | 0.25 | 0.0030 |
| Large drusen one eye only† | 4.56 | 0.0712 |
| Bilateral drusen† | 11.87 | <0.0001 |
| Advanced AMD in one eye† | 12.12 | <0.0001 |
| Presence of RPD | 13.13 | <0.0001 |
Age, BCVA, AMD group, RPD, SFCT, and Phakic Status were tested in different models.
Reference group is group 0
Discussion
The testing protocol used in this study was able to detect differences between aged eyes and intermediate AMD groups, while still having a testing time that was reasonable for an elderly population. There was a portion of the population that reached the test ceiling of 40 minutes 13, most notably the 80% of eyes with RPD. This result that eyes with RPD were not able to dark adapt to the target threshold within the 40 minute limit of this test complements previous work that has indicated RPD is associated with rod dysfunction. A histopathologic study by Curcio et al. of subretinal drusenoid deposits (SDD), the histological and OCT correlate to RPD, found that 90.1% of sampling locations with SDD were located in the perifovea, with the majority in the superior macula, showing a predilection for rod-dominated areas of the retina 29. Examination of individual SDD by both in vivo adaptive optic imaging as well as postmortem pathologic examination revealed that photoreceptor morphology was disturbed to variable extents over all SDD formations, including outer segment shortening and loss, as well as inner segment deflection and absence29, 30. A recent functional study by Hogg et al. also found that scores on the Smith-Kettlewell low-luminance acuity test, which is performed under reduced contrast and luminance conditions, is significantly lower among AMD patients with RPD 28. Other investigations of retinal sensitivity measured by microperimetry, a measurement of mixed rod and cone function, have reported differing results with some studies finding sensitivities that are significantly reduced in eyes with RPD compared with normal eyes or eyes with only drusen24, 25, whereas others find no difference in sensitivities in RPD eyes26. Studies of multifocal electroretinogram (mfERG) measurements, a measure of cone function, on eyes with RPD and eyes without RPD have led to differing findings as well, with some studies finding no association with multifocal ERG measurements 27 while a more recent study reported that mfERG implicit time is associated with the presence of RPD26.
The significant dark adaptation derangements associated with RPD are not well understood but would be consistent with a several hypotheses. Some previous reports have postulated that SDD have a direct mechanical influence on the overlying photoreceptors or that they provide a physical impediment to transport to the outer segments11, 30. Similar physical influences of drusen have been appreciated but in this study the functional consequences of decreased dark adaptation are less severe - perhaps indicating that the spectrum of severity of physical barrier limitations less is significant for drusen than for RPD31. Choroidal thinning among RPD eyes, observed in several prior studies32-34, was present in our participants and could represent another mechanism for decreased retinoid availability, leading to dark adaptation impairment. Furthermore, an investigation of the choroidal thickness at the center of the dark adaptation test spot shows it to be well-correlated with the SFCT (r=0.8549, p<0.0001) and both measurements demonstrate significant thinning in eyes with RPD. Longitudinal data, however, is needed to determine if choroidal changes precede the development of RPD or represent sequelae. A third possibility is that prolonged dark adaptation in RPD eyes represents an abnormality of the retinoid cycle at the level of RPE; thus it may not be a transport issue but one impeding regeneration of 11-cis retinal by the RPE. Supporting the possibility of a primary RPE pathogenesis in eyes with RPD is histopathologic evidence demonstrating that SDD can supplant RPE cells, instead of just overlying them, in certain instances29 supporting a relationship of RPD with RPE dysfunction. Further investigations will be required to increase understanding of RPD/SDD.
This study demonstrates that dark adaptation, as measured here, has an association with age, AMD severity - while correcting for age - and identifies RPD as an additional anatomic fundus feature associated with impairments in dark adaptation. While our study explored many aspects of dark adaptation in AMD, further work remains. Additional testing protocols for eyes that reach the test ceiling duration may enable us to quantitate differences between those eyes and perhaps assess longitudinal changes in these eyes. Longitudinal study and testing will also provide valuable information on the relationship between rod intercept time and risk of AMD progression and help evaluate the utility of dark adaptation as a potential outcome measure for clinical trials.
Acknowledgements
This work has been supported by the National Eye Institute Intramural Research Program. This research was also made possible through the National Institutes of Health (NIH) Medical Research Scholars Program, a public-private partnership supported jointly by the NIH and generous contributions to the Foundation for the NIH from Pfizer Inc, The Doris Duke Charitable Foundation, The Alexandria Real Estate Equities, Inc. and Mr. and Mrs. Joel S. Marcus, and the Howard Hughes Medical Institute, as well as other private donors. We'd also like to thank Katherine Hall, RN, for her help coordinating this study.
Footnotes
Publisher's Disclaimer: This is a PDF file of an unedited manuscript that has been accepted for publication. As a service to our customers we are providing this early version of the manuscript. The manuscript will undergo copyediting, typesetting, and review of the resulting proof before it is published in its final citable form. Please note that during the production process errors may be discovered which could affect the content, and all legal disclaimers that apply to the journal pertain.
Portions of this work have been presented at the 2014 Association for Research in Vision and Ophthalmology (ARVO) meeting
Bibliography
- 1.Leibowitz HM, Krueger DE, Maunder LR, et al. The Framingham Eye Study monograph: An ophthalmological and epidemiological study of cataract, glaucoma, diabetic retinopathy, macular degeneration, and visual acuity in a general population of 2631 adults, 1973-1975. Surv Ophthalmol. 1980;24(Suppl):335–610. [PubMed] [Google Scholar]
- 2.The Age-Related Eye Disease Study (AREDS): design implications. AREDS report no. 1. Control Clin Trials. 1999;20(6):573–600. doi: 10.1016/s0197-2456(99)00031-8. [DOI] [PMC free article] [PubMed] [Google Scholar]
- 3.Klein R, Klein BE, Linton KL. Prevalence of age-related maculopathy. The Beaver Dam Eye Study. Ophthalmology. 1992;99(6):933–43. doi: 10.1016/s0161-6420(92)31871-8. [DOI] [PubMed] [Google Scholar]
- 4.Ferris FL, Davis MD, Clemons TE, et al. A simplified severity scale for age-related macular degeneration: AREDS Report No. 18. Arch Ophthalmol. 2005;123(11):1570–4. doi: 10.1001/archopht.123.11.1570. [DOI] [PMC free article] [PubMed] [Google Scholar]
- 5.Bindewald A, Bird AC, Dandekar SS, et al. Classification of fundus autofluorescence patterns in early age-related macular disease. Invest Ophthalmol Vis Sci. 2005;46(9):3309–14. doi: 10.1167/iovs.04-0430. [DOI] [PubMed] [Google Scholar]
- 6.Farsiu S, Chiu SJ, O'Connell RV, et al. Quantitative classification of eyes with and without intermediate age-related macular degeneration using optical coherence tomography. Ophthalmology. 2014;121(1):162–72. doi: 10.1016/j.ophtha.2013.07.013. [DOI] [PMC free article] [PubMed] [Google Scholar]
- 7.Toy BC, Krishnadev N, Indaram M, et al. Drusen regression is associated with local changes in fundus autofluorescence in intermediate age-related macular degeneration. Am J Ophthalmol. 2013;156(3):532–42. e1. doi: 10.1016/j.ajo.2013.04.031. [DOI] [PMC free article] [PubMed] [Google Scholar]
- 8.Smith RT, Chan JK, Busuoic M, et al. Autofluorescence characteristics of early, atrophic, and high-risk fellow eyes in age-related macular degeneration. Invest Ophthalmol Vis Sci. 2006;47(12):5495–504. doi: 10.1167/iovs.05-1318. [DOI] [PMC free article] [PubMed] [Google Scholar]
- 9.Smith RT, Sohrab MA, Busuioc M, Barile G. Reticular macular disease. Am J Ophthalmol. 2009;148(5):733–43. e2. doi: 10.1016/j.ajo.2009.06.028. [DOI] [PMC free article] [PubMed] [Google Scholar]
- 10.Zweifel SA, Imamura Y, Spaide TC, et al. Prevalence and significance of subretinal drusenoid deposits (reticular pseudodrusen) in age-related macular degeneration. Ophthalmology. 2010;117(9):1775–81. doi: 10.1016/j.ophtha.2010.01.027. [DOI] [PubMed] [Google Scholar]
- 11.Zweifel SA, Spaide RF, Curcio CA, et al. Reticular pseudodrusen are subretinal drusenoid deposits. Ophthalmology. 2010;117(2):303–12. e1. doi: 10.1016/j.ophtha.2009.07.014. [DOI] [PubMed] [Google Scholar]
- 12.Chew EY, Clemons TE, Agron E, et al. Ten-year follow-up of age-related macular degeneration in the age-related eye disease study: AREDS report no. 36. JAMA Ophthalmol. 2014;132(3):272–7. doi: 10.1001/jamaophthalmol.2013.6636. [DOI] [PMC free article] [PubMed] [Google Scholar]
- 13.Jackson GR, Edwards JG. A short-duration dark adaptation protocol for assessment of age-related maculopathy. J Ocul Biol Dis Infor. 2008;1(1):7–11. doi: 10.1007/s12177-008-9002-6. [DOI] [PMC free article] [PubMed] [Google Scholar]
- 14.Owsley C, Jackson GR, Cideciyan AV, et al. Psychophysical evidence for rod vulnerability in age-related macular degeneration. Invest Ophthalmol Vis Sci. 2000;41(1):267–73. [PubMed] [Google Scholar]
- 15.Owsley C, Jackson GR, White M, et al. Delays in rod-mediated dark adaptation in early age-related maculopathy. Ophthalmology. 2001;108(7):1196–202. doi: 10.1016/s0161-6420(01)00580-2. [DOI] [PubMed] [Google Scholar]
- 16.Jackson GR, Owsley C, McGwin G., Jr. Aging and dark adaptation. Vision Res. 1999;39(23):3975–82. doi: 10.1016/s0042-6989(99)00092-9. [DOI] [PubMed] [Google Scholar]
- 17.Jackson GR, Owsley C, Cordle EP, Finley CD. Aging and scotopic sensitivity. Vision Res. 1998;38(22):3655–62. doi: 10.1016/s0042-6989(98)00044-3. [DOI] [PubMed] [Google Scholar]
- 18.Curcio CA, Millican CL, Allen KA, Kalina RE. Aging of the human photoreceptor mosaic: evidence for selective vulnerability of rods in central retina. Invest Ophthalmol Vis Sci. 1993;34(12):3278–96. [PubMed] [Google Scholar]
- 19.Curcio CA, Medeiros NE, Millican CL. Photoreceptor loss in age-related macular degeneration. Invest Ophthalmol Vis Sci. 1996;37(7):1236–49. [PubMed] [Google Scholar]
- 20.Jackson GR, Scott IU, Kim IK, et al. Diagnostic sensitivity and specificity of dark adaptometry for detection of age-related macular degeneration. Invest Ophthalmol Vis Sci. 2014;55(3):1427–31. doi: 10.1167/iovs.13-13745. [DOI] [PMC free article] [PubMed] [Google Scholar]
- 21.Arnold JJ, Sarks SH, Killingsworth MC, Sarks JP. Reticular pseudodrusen. A risk factor in age-related maculopathy. Retina. 1995;15(3):183–91. [PubMed] [Google Scholar]
- 22.Ueda-Arakawa N, Ooto S, Tsujikawa A, et al. Sensitivity and specificity of detecting reticular pseudodrusen in multimodal imaging in Japanese patients. Retina. 2013;33(3):490–7. doi: 10.1097/IAE.0b013e318276e0ae. [DOI] [PubMed] [Google Scholar]
- 23.Lois N, Owens SL, Coco R, et al. Fundus autofluorescence in patients with age-related macular degeneration and high risk of visual loss. Am J Ophthalmol. 2002;133(3):341–9. doi: 10.1016/s0002-9394(01)01404-0. [DOI] [PubMed] [Google Scholar]
- 24.Querques G, Massamba N, Srour M, et al. Impact of reticular pseudodrusen on macular function. Retina. 2014;34(2):321–9. doi: 10.1097/IAE.0b013e3182993df1. [DOI] [PubMed] [Google Scholar]
- 25.Ooto S, Ellabban AA, Ueda-Arakawa N, et al. Reduction of retinal sensitivity in eyes with reticular pseudodrusen. Am J Ophthalmol. 2013;156(6):1184–91. e2. doi: 10.1016/j.ajo.2013.06.036. [DOI] [PubMed] [Google Scholar]
- 26.Wu Z, Ayton LN, Makeyeva G, et al. Impact of reticular pseudodrusen on microperimetry and multifocal electroretinography in intermediate age-related macular degeneration. Invest Ophthalmol Vis Sci. 2015;56(3):2100–6. doi: 10.1167/iovs.14-16210. [DOI] [PubMed] [Google Scholar]
- 27.Alten F, Heiduschka P, Clemens CR, Eter N. Multifocal electroretinography in eyes with reticular pseudodrusen. Invest Ophthalmol Vis Sci. 2012;53(10):6263–70. doi: 10.1167/iovs.12-10094. [DOI] [PubMed] [Google Scholar]
- 28.Hogg RE, Silva R, Staurenghi G, et al. Clinical characteristics of reticular pseudodrusen in the fellow eye of patients with unilateral neovascular age-related macular degeneration. Ophthalmology. 2014;121(9):1748–55. doi: 10.1016/j.ophtha.2014.03.015. [DOI] [PubMed] [Google Scholar]
- 29.Curcio CA, Messinger JD, Sloan KR, et al. Subretinal drusenoid deposits in non-neovascular age-related macular degeneration: morphology, prevalence, topography, and biogenesis model. Retina. 2013;33(2):265–76. doi: 10.1097/IAE.0b013e31827e25e0. [DOI] [PMC free article] [PubMed] [Google Scholar]
- 30.Zhang Y, Wang X, Rivero EB, et al. Photoreceptor perturbation around subretinal drusenoid deposits as revealed by adaptive optics scanning laser ophthalmoscopy. Am J Ophthalmol. 2014;158(3):584–96. e1. doi: 10.1016/j.ajo.2014.05.038. [DOI] [PMC free article] [PubMed] [Google Scholar]
- 31.Johnson PT, Lewis GP, Talaga KC, et al. Drusen-associated degeneration in the retina. Invest Ophthalmol Vis Sci. 2003;44(10):4481–8. doi: 10.1167/iovs.03-0436. [DOI] [PubMed] [Google Scholar]
- 32.Haas P, Esmaeelpour M, Ansari-Shahrezaei S, et al. Choroidal thickness in patients with reticular pseudodrusen using 3D 1060-nm OCT maps. Invest Ophthalmol Vis Sci. 2014;55(4):2674–81. doi: 10.1167/iovs.13-13338. [DOI] [PMC free article] [PubMed] [Google Scholar]
- 33.Querques G, Querques L, Forte R, et al. Choroidal changes associated with reticular pseudodrusen. Invest Ophthalmol Vis Sci. 2012;53(3):1258–63. doi: 10.1167/iovs.11-8907. [DOI] [PubMed] [Google Scholar]
- 34.Garg A, Oll M, Yzer S, et al. Reticular pseudodrusen in early age-related macular degeneration are associated with choroidal thinning. Invest Ophthalmol Vis Sci. 2013;54(10):7075–81. doi: 10.1167/iovs.13-12474. [DOI] [PMC free article] [PubMed] [Google Scholar]
- 35.Sunness JS, Johnson MA, Massof RW, Marcus S. Retinal sensitivity over drusen and nondrusen areas. A study using fundus perimetry. Arch Ophthalmol. 1988;106(8):1081–4. doi: 10.1001/archopht.1988.01060140237032. [DOI] [PubMed] [Google Scholar]
- 36.Takamine Y, Shiraki K, Moriwaki M, et al. Retinal sensitivity measurement over drusen using scanning laser ophthalmoscope microperimetry. Graefes Arch Clin Exp Ophthalmol. 1998;236(4):285–90. doi: 10.1007/s004170050079. [DOI] [PubMed] [Google Scholar]
- 37.Steinmetz RL, Haimovici R, Jubb C, et al. Symptomatic abnormalities of dark adaptation in patients with age-related Bruch's membrane change. Br J Ophthalmol. 1993;77(9):549–54. doi: 10.1136/bjo.77.9.549. [DOI] [PMC free article] [PubMed] [Google Scholar]