

Abstract
Background:
Little attention has been paid to the role of subcortical deep gray matter (SDGM) structures in type 2 diabetes mellitus (T2DM)-induced cognitive impairment, especially hippocampal subfields. Our aims were to assess the in vivo volumes of SDGM structures and hippocampal subfields using magnetic resonance imaging (MRI) and to test their associations with cognitive performance in T2DM.
Methods:
A total of 80 T2DM patients and 80 neurologically unimpaired healthy controls matched by age, sex and education level was enrolled in this study. We assessed the volumes of the SDGM structures and seven hippocampal subfields on MRI using a novel technique that enabled automated volumetry. We used Mini-Mental State Examination and Montreal Cognitive Assessment (MoCA) scores as measures of cognitive performance. The association of glycosylated hemoglobin (HbA1c) with SDGM structures and neuropsychological tests and correlations between hippocampal subfields and neuropsychological tests were assessed by partial correlation analysis in T2DM.
Results:
Bilaterally, the hippocampal volumes were smaller in T2DM patients, mainly in the CA1 and subiculum subfields. Partial correlation analysis showed that the MoCA scores, particularly those regarding delayed memory, were significantly positively correlated with reduced hippocampal CA1 and subiculum volumes in T2DM patients. Additionally, higher HbA1c levels were significantly associated with poor memory performance and hippocampal atrophy among T2DM patients.
Conclusions:
These data indicate that the hippocampus might be the main affected region among the SDGM structures in T2DM. These structural changes in the hippocampal CA1 and subiculum areas might be at the core of underlying neurobiological mechanisms of hippocampal dysfunction, suggesting that degeneration in these regions could be responsible for memory impairments in T2DM patients.
Keywords: Cognitive Impairment, Hippocampus, Type 2 Diabetes Mellitus, Subcortical Deep Gray Matter Structures, Volume
INTRODUCTION
The prevalence of type 2 diabetes mellitus (T2DM) continues to rise in adults worldwide.[1] T2DM is related to decrements in cognition, particularly learning and memory deficits.[2,3] Previous magnetic resonance imaging (MRI) studies[4,5,6,7] have found brain abnormalities, such as cortical and subcortical atrophy and white-matter hyperintensities (WMH) in T2DM patients. These pronounced structural changes have also been associated with the development of dementia.[8] However, the pathophysiological mechanism of T2DM-induced cognitive impairment is still largely unknown.
Previous studies[5,9,10,11,12] have investigated the role of subcortical deep gray matter (SDGM) volume in T2DM-induced cognitive impairment, but conflicting results have been reported. Some studies[5,9] found abnormalities in the subcortical structures of T2DM patients associated with impaired cognitive domains related to the speed of mental processes and memory. We recently reported GM volume reductions in the hippocampus and amygdala of patients with T2DM with mild cognitive impairment.[10] Nevertheless, to date, the majority of morphometric studies of T2DM have been conducted using voxel-based morphometry analysis methods or manual segmentation methods, and a relatively small sample sizes have led to conflicting results about subcortical pathology. For example, some research groups found no structural changes in the hippocampus in T2DM patients.[11,12] In contrast to the problem of tissue segmentation (GM, WM and cerebrospinal fluid [CSF]) on brain MRI for which acceptable solutions have been found, the issue of subcortical structure segmentation has yet to be satisfactorily addressed. Thus, using accurate and robust segmentation methods that are fully automated, quantitative evaluations of SDGM abnormalities in T2DM patients could provide new insights into the pathogenesis of cognitive dysfunction in this disorder.
Here, we applied a novel image analysis technique (FreeSurfer),[13] which is a voxel-based, automated software for brain reconstruction, to investigate the extent of SDGM structures directly. Moreover, this technique reveals the anatomical features of the hippocampal formation at an unprecedented level of detail, providing the basis for hippocampal subfield measurement. In previous neuroimaging investigations, Freesurfer was used successfully to study SDGM and hippocampal subfield structures in conditions such as Alzheimer's disease (AD).[14,15]
The aim of this study was to investigate the characteristics of SDGM structural changes and regional changes in the hippocampal subregions of T2DM patients compared to control subjects. We also examined whether volumetric changes in hippocampal subfields in T2DM were related to cognitive impairment.
METHODS
Participants
This study protocol was approved by the Ethics Committee of Southwest Hospital in Chongqing, China. Written informed consent and complete medical records were obtained from each participant prior to the study. The patients volunteered to participate in this study and were able to express their psychological states.
Two age-, gender- and education-matched groups of participants were studied, including 80 patients diagnosed with T2DM and 80 healthy controls (HCs) subjects. All of the participants were right handed. Patients with T2DM were diagnosed using the criteria recommended by the American Diabetes Association in 2010.[16] All of the patients were recruited from southwest hospital and were being treated with oral hypoglycemic agents, insulin secretagogue agents and metformin at various dosages. In addition, these patients used other nonpharmacologic strategies, including diet control and physical exercise. A group of HC with no history or symptoms of diabetes or psychiatric or neurologic disease was recruited.
The exclusion criteria for all of the participants included central nervous system diseases, including stroke, drug or alcohol dependence; a history of head trauma, major depression (excluded by the Hamilton depression rating scale) or other neurological or psychiatric illnesses (excluded by clinical assessment and case history); contraindications to MRI; and indications of dementia (defined as a Mini-Mental State Exam [MMSE] score of <24). Subjects with major medical illnesses (e.g. cancer, anemia, diabetic ketoacidosis and thyroid dysfunction) and severe visual or hearing loss were also excluded from the current study. Vascular risk factors (hyperlipidemia, hypertension, WMH) were also recorded for inclusion in the analysis.
Neuropsychological tests
In this study, global cognitive function was evaluated using the MMSE and Montreal Cognitive Assessment (MoCA). The MMSE is the most widely used test for cognitive function and has been used to assess possible dementia.[17] The MoCA, Beijing version, was applied to assess the cognitive condition of each participant (including visuospatial, executive, attention, language, delayed recall and orientation domains). Results were scored from 0 to 30, with higher scores indicating better cognition.
Magnetic resonance imaging data acquisition
All of the imaging data were obtained in the Department of Radiology at Southwest Hospital using a Siemens 3Tesla TIM Trio MRI system (Erlangen, Germany) equipped with the standard Siemens eight-channel head coil. In addition to conventional diagnostic sequences, a high-resolution sagittal structural T1-weighted anatomical sequence was acquired using a three-dimensional magnetization-prepared rapid-acquisition gradient echo (repetition time = 1900 ms, echo time = 2.52 ms, flip angle = 9°, slice thickness = 1 mm, field of view = 256 mm × 256 mm, matrix = 256 × 256, voxel size = 1 mm × 1 mm × 1 mm, 176 slices).
Data analysis
Volumetric analysis
For each subject, volume estimation for seven bilateral subcortical structures, including the nucleus accumbens, amygdala, caudate, hippocampus, pallidum, putamen and thalamus, was performed using the Freesurfer image analysis suite (version 5.3.0, Charlestown, MA, USA; http://surfer.nmr.mgh.harvard.edu). Automatic subcortical segmentation of a brain volume is based upon the existence of an atlas containing probabilistic information on the location of structures. The technical details of these procedures are described in the previous publication.[18] Finally, two expert radiologists verified the accuracy of each participant's native-space SDGM segments, and no errors were identified.
To reduce the effects of inter-individual variability in head size, total intracranial volume (TIV, including separate estimates of volumes of GM, WM, CSF) was estimated using tissue segmentation in FreeSurfer.[18]
To focus more on the topic of volumetric changes in SDGM structures in T2DM, the confounding effects of WMH were removed as much as possible. For this purpose, WMH volume measurements for all of the participants are derived automatically using the Freesurfer image analysis suite. Total WMH volume was expressed as a percentage of the intracranial volume (WMHr), as in other studies, to account for differences in subject head size.[19]
Hippocampal subfield segmentation
Automated segmentation of the hippocampus into its respective subfields was performed using Bayesian inference and a statistical model of the medial temporal lobe in Freesurfer. The left and right hippocampi were segmented into seven subfields: CA1, CA2–3, CA4-dentate gyrus (DG), subiculum, presubiculum, fimbria, and hippocampal fissure. The exact algorithm and the technical details of these procedures were described in a previous publication.[20]
Statistical analysis
All of the statistical analyses were performed using the PASW Statistical Software Package, version 18.0 (PASW for Windows, Chicago, IL, USA). The distribution of continuous variables was tested for normality using PASW. The differences in demographic and clinical characteristics between patients and controls were analyzed using independent sample t-tests, and Chi-square test was used for sex differences. The partial correlation test was chosen to examine the relationship between hippocampal subfield volume and MoCA score, and age, sex, education level and TIV were imported as covariates. Furthermore, the partial correlation test was also chosen to examine the association of glycosylated hemoglobin (HbA1c) with SDGM structures and MoCA score. A P < 0.05 was considered as statistically significant.
Significant differences in the size of the SDGM between the groups were estimated by MANCOVA, with each participant's age, sex, education level and TIV as covariates. The MANCOVA model was defined by one between-subject factor and 14 dependent variables (each bilateral of the SDGM). To compare GM, WM and TIV, age, sex and education level were treated as covariates. Post-hoc univariate tests with Bonferroni's correction were performed to follow the significant main effects yielded by MANCOVA (P < 0.05).
Because there were no differences between the left and right sides of each hippocampal subfield in repeated-measures ANOVA, they were combined into a single bilateral region. To compare subfield volumes between controls and T2DM patients, they were entered as dependent variables into a MANCOVA analysis with the group as a factor (age, sex, education level and TIV as covariates). For multiple comparison analysis, Bonferroni's correction was used to perform post-hoc comparisons (P < 0.05 was considered statistically significant).
RESULTS
Demographics, clinical characteristics and neuropsychological data
Table 1 shows the demographic, clinical and neuropsychological test characteristics of the participants included in this study. The patient and control groups did not differ in terms of age, sex or education level. No significant differences were found in total cholesterol level, blood pressure, MMSE score or body mass index between the T2DM group and the control group (both P > 0.05). In terms of cognitive assessment, the T2DM patients had significantly lower MoCA scores than the control subjects, suggesting that their general cognition was impaired (P < 0.001). Partial correlation analysis found that the HbA1c was negatively correlated with the total MoCA score (r = −0.24, P = 0.032), mainly in terms of delayed recall (r = −0.309, P = 0.006) in the T2DM patients.
Table 1.
Demographic, clinical and cognitive characteristics of the study patients and control subjects
| Characteristics | n=80 | t/F/χ2 | P | |
|---|---|---|---|---|
| Control | T2DM | |||
| Sex (male/female) | 29/51 | 35/45 | χ2=0.938 | 0.333 |
| Age (years) | 57.83 (10.31) | 57.49 (9.04) | t=0.220 | 0.826 |
| Education (years) | 10.08 (4.22) | 9.63 (3.94) | t=0.687 | 0.493 |
| Duration of diabetes (years) | NA | 7.00 (6.67) | - | - |
| Age at diagnosis (years) | NA | 50.49 (8.39) | - | - |
| HbA1c (%) | 5.59 (0.37) | 7.59 (1.49) | t= −11.938 | 0.000* |
| Total cholesterol (mmol/L) | 5.2 (1.1) | 5.4 (1.2) | t= −1.226 | 0.222 |
| SBP (mmHg) | 127 (13) | 129 (14) | t= −0.785 | 0.433 |
| DBP (mmHg) | 82 (10) | 83 (12) | t= −0.555 | 0.580 |
| BMI (kg/m2) | 24.10 (2.70) | 24.40 (2.99) | t= −0.667 | 0.506 |
| MMSE | 28.14 (1.66) | 27.89 (1.70) | t=0.942 | 0.348 |
| MoCA | 26.56 (2.49) | 21.71 (4.42) | t=8.545 | 0.000* |
| TIV (cm3) | 1011.08 (98.05) | 1009.49 (104.09) | F=0.616 | 0.434 |
| GM volumes (cm3) | 506.02 (46.92) | 499.56 (47.56) | F=2.877 | 0.092 |
| WM volumes (cm3) | 505.06 (55.10) | 509.93 (59.28) | F=0.002 | 0.969 |
| WMHr (%) | 0.17 (0.12) | 0.19 (0.14) | t= −0.925 | 0.357 |
| Left hippocampal volumes (mm3) | 3599.69 (414.47) | 3485.38 (391.75) | F=4.543 | 0.035* |
| Right hippocampal volumes (mm3) | 3748.90 (435.63) | 3627.81 (298.21) | F=6.081 | 0.015* |
Data are reported as mean (SD); *P<0.05. SD: Standard deviation; HbA1c: Glycosylated hemoglobin (%); BP: Blood pressure; BMI: Body mass index; MMSE: Mini mental state exam; MoCA: Montral cognitive assessment; TIV: Total intracranial volume; GM: Gray matter; WM: White matter; NA: Not applicable; WMHr: Total white matter hyperintensity volume; expressed as a percentage of the intracranial volume; T2DM: Type 2 diabetes mellitus; SBP: Systolic blood pressure; DBP: Diastolic blood pressure.
Total gray matter, white matter, white-matter hyperintensities volume and total intracranial volume
No significant differences were observed in GM (F = 2.877; P = 0.092), WM (F = 0.002; P = 0.969) volume, and WMHr (t = −0.925; P = 0.357) or TIV (F = 0.616; P = 0.434) between the patients and control subjects [Table 1].
Subcortical deep gray matter volume
The normalized volume for the SDGM in cubic millimeters is summarized in Table 2. The total volumes of the left (F = 4.543; P = 0.035) and right (F = 6.081; P = 0.015) hippocampi of the T2DM group were significantly smaller than those of the control group [Table 2]. However, there were no significant volume differences for the nucleus accumbens, amygdala, caudate, pallidum, putamen or thalamus subfields between the T2DM group and control group.
Table 2.
Mean subcortical nuclei volume in cubic centimeters per diagnosis: MANCOVA analysis applied to estimate group differencesa
| Anatomy | Mean volume (SD) (mm3) | F | P | |
|---|---|---|---|---|
| Control | T2DM | |||
| Left accumbens | 481.35 (99.28) | 468.98 (108.93) | 0.966 | 0.327 |
| Left amygdala | 1201.45 (221.40) | 1195.25 (248.98) | 0.115 | 0.734 |
| Left caudate | 3299.41 (405.74) | 3221.89 (331.72) | 2.695 | 0.103 |
| Left hippocampus | 3599.69 (414.47) | 3485.38 (391.75) | 4.543 | 0.035* |
| Left pallidus | 1769.64 (271.21) | 1757.94 (267.26) | 0.307 | 0.580 |
| Left putamen | 4646.98 (580.57) | 4598.01 (533.45) | 0.916 | 0.340 |
| Left thalamus | 7447.18 (671.29) | 7395.41 (687.46) | 0.901 | 0.344 |
| Right accumbens | 372.55 (90.75) | 359.15 (88.26) | 0.877 | 0.350 |
| R amygdala | 1235.04 (233.65) | 1232.38 (226.30) | 0.138 | 0.710 |
| Right caudate | 3400.14 (380.74) | 3337.94 (332.23) | 1.703 | 0.194 |
| Right hippocampus | 3748.90 (435.63) | 3627.81 (298.21) | 6.081 | 0.015* |
| Right pallidus | 1749.59 (254.14) | 1745.94 (278.70) | 0.079 | 0.779 |
| Right putamen | 4653.88 (547.37) | 4645.21 (555.39) | 0.062 | 0.803 |
| Right thalamus | 7235.13 (655.64) | 7158.99 (680.18) | 1.900 | 0.170 |
aAdjusted for age, sex, education years and TIV, *Threshold for statistical significance was set at P<0.05. SD: Standard deviation; T2DM: Type 2 diabetes mellitus; TIV: Total intracranial volume.
Partial correlation analysis found that the HbA1c was negatively correlated with the hippocampal volume (r = −0.267, P = 0.02). However, there were no significant association between the HbA1c and nucleus accumbens (r = −0.191, P = 0.099), amygdala (r = −0.099, P = 0.397), caudate (r = −0.099, P = 0.394), pallidum (r = −0.099, P = 0.396), putamen (r = 0.122, P = 0.295) or thalamus (r = 0.109, P = 0.35) volumes.
Hippocampal subfield volume
In the hippocampal subfield [Table 3], the CA1 (F = 8.126; P = 0.005) and subiculum (F = 5.686; P = 0.018) volumes were significantly smaller in the T2DM group compared with the control group. However, there were no significant volume differences between the T2DM group and control group in the CA2–3 (F = 0.061; P = 0.805), CA4-DG (F = 0.079; P = 0.779), presubiculum (F = 0.042; P = 0.838), fimbria (F = 0.027; P = 0.870) or hippocampal fissure (F = 0.210; P = 0.647) subfields.
Table 3.
Results from the MANCOVA analysis and effect sizes of differences between groups in hippocampal structuresb
| Anatomical region (mm3) | n=80 | F | P | |
|---|---|---|---|---|
| Control | T2DM | |||
| CA1 | 689.55 (64.36) | 663.00 (74.15) | 8.126 | 0.005* |
| CA2-3 | 1997.12 (228.88) | 1997.47 (254.04) | 0.061 | 0.805 |
| CA4-DG | 1136.50 (129.17) | 1136.25 (135.85) | 0.079 | 0.779 |
| Subiculum | 1339.97 (123.02) | 1302.62 (139.82) | 5.686 | 0.018* |
| Presubiculum | 946.31 (102.23) | 949.51 (120.80) | 0.042 | 0.838 |
| Fimbria | 142.78 (35.08) | 141.64 (34.73) | 0.027 | 0.870 |
| Hippocampal fissure | 97.18 (26.63) | 99.61 (25.05) | 0.210 | 0.647 |
bAdjusted for age, sex, education years and TIV, *Indicates threshold for statistical significance was set at P<0.05. DG: Dentate gyrus; T2DM: Type 2 diabetes mellitus; TIV: Total intracranial volume.
Partial correlation analysis revealed that the total volumes of the CA1 and subiculum subfields were positively correlated with the total MoCA score (r = 0.516, P < 0.001, [Figure 1a]; r = 0.307, P = 0.007, [Figure 1b]), mainly in terms of delayed recall (r = 0.430, P < 0.001, [Figure 1c]; r = 0.385, P = 0.001; [Figure 1d]) in the T2DM patients.
Figure 1.
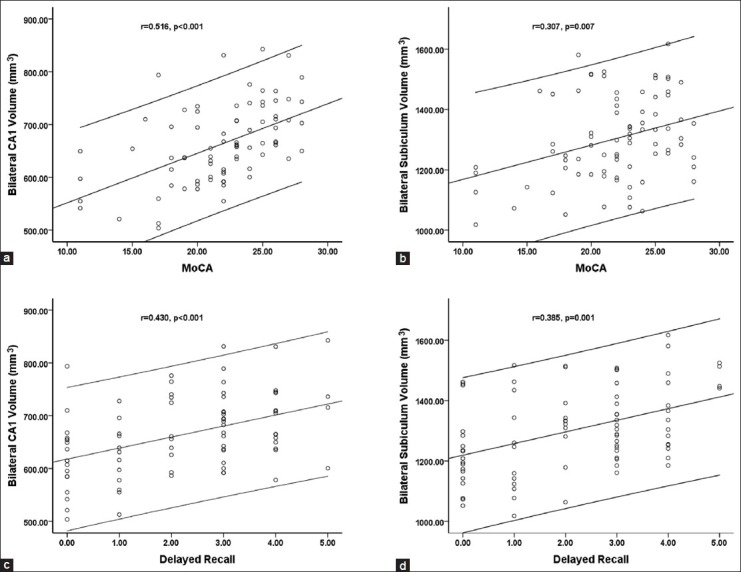
The correlation of the bilateral CA1 volume (a) and the bilateral subiculum volume (b) with the total Montreal Cognitive Assessment (MoCA) score in T2DM patients. The correlation of the bilateral CA1 volume (c) and the bilateral subiculum volume (d) with the delayed recall score in T2DM patients. The error bar represents the 95% confidence interval.
DISCUSSION
The present study examined the volumetric changes in SDGM structures and hippocampal subfields in T2DM patients. Compared to the HC group, we found reduced bilateral hippocampal volume in T2DM patients, mainly in the CA1 and subiculum subfields. Additionally, the MoCA scores, particularly those regarding delayed memory, were significantly positively correlated with the CA1 and subiculum subfields in T2DM patients. Notably, HbA1c levels were significantly negatively correlated with poor memory performance and hippocampal atrophy in T2DM patients.
The hippocampus has been shown to be specifically affected as a result of T2DM,[21,22] both structurally and functionally. In agreement with these previous studies,[10,23] the current study found that compared to the HC group, significant bilateral hippocampal atrophy occurs in T2DM patients. In addition, damaged hippocampal structures are known to impair hippocampus-mediated learning and aspects of memory function, such as recognition memory.[24] Our study also demonstrated that T2DM patients presented significantly reduced MoCA scores compared to matched controls, and higher HbA1c levels were significantly associated with poor memory performance and hippocampal atrophy among T2DM patients. Therefore, hippocampal damage and memory impairments are potentially serious complications in T2DM patients.
Notably, in the present study, other SDGM structures were relatively preserved in T2DM (the nucleus accumbens, amygdala, caudate, hippocampus, pallidum, putamen, and thalamus). In addition, no significant association between the HbA1c and these SDGM structures was found in T2DM patients. These results were likely observed because insulin resistance may be leading to neuronal loss in the hippocampus due to the high concentration of insulin receptors in that region.[25] Thus, degenerative pathology affects hippocampus structures to a greater degree in T2DM than other SDGM areas, which suggests that the hippocampus may serve as the initial mediator of the association between T2DM and cognitive decline.
A previous study in streptozotocin-induced diabetic rats demonstrated widespread damage to the CA1 region of the hippocampus,[26] indicated that despite T2DM possibly having an overall effect on hippocampal volume, there also appeared to be region-specific effects. However, it remains unclear which hippocampus subregions are involved in cognitive dysfunction in T2DM in vivo. In most studies on T2DM, the hippocampus has been assessed as a single structure, without evaluating its various subregions, such as the CA1, CA2–3, CA4-DG and subiculum. Thus, hippocampal subfield analysis could provide a more sensitive marker for T2DM than whole-hippocampal volumetry.
To the best of our knowledge, this was the first study to propose automated segmentation of the hippocampus in T2DM. Among the hippocampal subfields examined, we observed that degeneration within the CA1 and subiculum regions appeared to be more significant in T2DM compared with other components of the hippocampus. The hippocampus is mainly organized as a unidirectional circuit starting at the DG, and this circuit is completed as the CA1 sends projections to the subiculum, which is the major output region of the hippocampus.[27] Therefore, our findings revealed selective involvement of specific hippocampal subregions in T2DM, mainly in the output regions within the hippocampal circuit.
Interestingly, pathologic findings in patients with AD have suggested that severe degeneration of the perforant path, which provides input from layer III of the entorhinal cortex to the CA1 and the subiculum, is a characteristic feature of AD.[28,29] Accumulating studies have shown that T2DM and associated cognitive impairment are each associated with common pathophysiology of the central nervous system,[30,31,32] whilst each is associated with increased mortality, an effect which is cumulative when both features coexist.[33] Compared with the results of the current study, the pattern of neurocognitive and hippocampal volumetric deficits in T2DM populations show considerable similarity to those reported in populations of individuals with AD.
In the correlation analysis, structural abnormalities in the CA1 and subiculum subfields were found to be related to impaired cognitive performance on the MoCA and delayed recall scores in the T2DM group. A functional distinction has previously been reported between subfields, with CA1 pyramidal neurons of the hippocampus serving as an area crucial to the formation and encoding of memories,[34,35] whereas the CA2–3 and DG regions are engaged by learning or the creation of new memories, and the subiculum is engaged specifically in the recall of these memories.[36,37] Our findings emphasized the role of the CA1 and subiculum regions within the hippocampal circuit in learning and memory deficits in these patients.
This study had several limitations. First, the T2DM subjects received various medications that may have produced confounding effects on neurocognitive. Further studies should include medication-naive subjects to exclude this possible bias. Second, our study design was cross-sectional, and longitudinal neuroimaging studies of T2DM patients with dementia should be conducted in the future to determine dynamic effects on hippocampal subfields. Third, there are no diagnostic criteria for diabetes-related cognitive dysfunction, and this lack of objective and specific neurocognitive assessment limited our interpretation of the results. Should such criteria become available, they would help to identify patients who are at risk for the development of dementia and would allow researchers to explore their brain patterns. Finally, patients may complain about their poor memory to their health care providers, and although subjective memory complaints were not a reliable indicator of cognitive impairment in our study, these complaints may be a warning sign that patients’ ability to cope creatively with diabetes problems is reduced.
In conclusion, among the SDGM structures, hippocampal might be the main affected region in T2DM. These structural changes in the hippocampal subiculum and CA1 regions may serve as the main underlying neurobiological mechanisms of hippocampal dysfunction and may, therefore, be highly relevant to memory impairment in T2DM. Furthermore, these characteristics of hippocampal subfields atrophy in T2DM might be very similar to those in AD.
ACKNOWLEDGMENTS
The authors are grateful to the patients for cooperating in this research study.
Footnotes
Edited by: Jian Gao
Source of Support: This study was financially supported by the Innovation Fund for Younger Investigators of Southwest Hospital of the Third Military Medical University (No. SWH2013QN09), and the National Natural Science Foundation of China (No. 81471647).
Conflict of Interest: None declared.
REFERENCES
- 1.Scully T. Diabetes in numbers. Nature. 2012;485:S2–3. doi: 10.1038/485s2a. [DOI] [PubMed] [Google Scholar]
- 2.McCrimmon RJ, Ryan CM, Frier BM. Diabetes and cognitive dysfunction. Lancet. 2012;379:2291–9. doi: 10.1016/S0140-6736(12)60360-2. [DOI] [PubMed] [Google Scholar]
- 3.Zhou H, Liu J, Ren L, Liu W, Xing Q, Men L, et al. Relationship between [corrected] spatial memory in diabetic rats and protein kinase C γ , caveolin-1 in the hippocampus and neuroprotective effect of catalpol. Chin Med J. 2014;127:916–23. [PubMed] [Google Scholar]
- 4.Last D, Alsop DC, Abduljalil AM, Marquis RP, de Bazelaire C, Hu K, et al. Global and regional effects of type 2 diabetes on brain tissue volumes and cerebral vasoreactivity. Diabetes Care. 2007;30:1193–9. doi: 10.2337/dc06-2052. [DOI] [PMC free article] [PubMed] [Google Scholar]
- 5.Manschot SM, Brands AM, van der Grond J, Kessels RP, Algra A, Kappelle LJ, et al. Brain magnetic resonance imaging correlates of impaired cognition in patients with type 2 diabetes. Diabetes. 2006;55:1106–13. doi: 10.2337/diabetes.55.04.06.db05-1323. [DOI] [PubMed] [Google Scholar]
- 6.van Harten B, Oosterman JM, Potter van Loon BJ, Scheltens P, Weinstein HC. Brain lesions on MRI in elderly patients with type 2 diabetes mellitus. Eur Neurol. 2007;57:70–4. doi: 10.1159/000098054. [DOI] [PubMed] [Google Scholar]
- 7.Ryan JP, Fine DF, Rosano C. Type 2 diabetes and cognitive impairment: Contributions from neuroimaging. J Geriatr Psychiatry Neurol. 2014;27:47–55. doi: 10.1177/0891988713516543. [DOI] [PMC free article] [PubMed] [Google Scholar]
- 8.Raz N, Rodrigue KM. Differential aging of the brain: Patterns, cognitive correlates and modifiers. Neurosci Biobehav Rev. 2006;30:730–48. doi: 10.1016/j.neubiorev.2006.07.001. [DOI] [PMC free article] [PubMed] [Google Scholar]
- 9.Akisaki T, Sakurai T, Takata T, Umegaki H, Araki A, Mizuno S, et al. Cognitive dysfunction associates with white matter hyperintensities and subcortical atrophy on magnetic resonance imaging of the elderly diabetes mellitus Japanese Elderly Diabetes Intervention Trial (J-EDIT) Diabetes Metab Res Rev. 2006;22:376–84. doi: 10.1002/dmrr.632. [DOI] [PubMed] [Google Scholar]
- 10.Zhang Y, Zhang X, Zhang J, Liu C, Yuan Q, Yin X, et al. Gray matter volume abnormalities in type 2 diabetes mellitus with and without mild cognitive impairment. Neurosci Lett. 2014;562:1–6. doi: 10.1016/j.neulet.2014.01.006. [DOI] [PubMed] [Google Scholar]
- 11.Chen Z, Li L, Sun J, Ma L. Mapping the brain in type II diabetes: Voxel-based morphometry using DARTEL. Eur J Radiol. 2012;81:1870–6. doi: 10.1016/j.ejrad.2011.04.025. [DOI] [PubMed] [Google Scholar]
- 12.Musen G, Jacobson AM, Bolo NR, Simonson DC, Shenton ME, McCartney RL, et al. Resting-state brain functional connectivity is altered in type 2 diabetes. Diabetes. 2012;61:2375–9. doi: 10.2337/db11-1669. [DOI] [PMC free article] [PubMed] [Google Scholar]
- 13.Patenaude B, Smith SM, Kennedy DN, Jenkinson M. A Bayesian model of shape and appearance for subcortical brain segmentation. Neuroimage. 2011;56:907–22. doi: 10.1016/j.neuroimage.2011.02.046. [DOI] [PMC free article] [PubMed] [Google Scholar]
- 14.Oliveira PP, Jr, Nitrini R, Busatto G, Buchpiguel C, Sato JR, Amaro E., Jr Use of SVM methods with surface-based cortical and volumetric subcortical measurements to detect Alzheimer's disease. J Alzheimers Dis. 2010;19:1263–72. doi: 10.3233/JAD-2010-1322. [DOI] [PubMed] [Google Scholar]
- 15.Lim HK, Hong SC, Jung WS, Ahn KJ, Won WY, Hahn C, et al. Automated segmentation of hippocampal subfields in drug-naïve patients with Alzheimer disease. AJNR Am J Neuroradiol. 2013;34:747–51. doi: 10.3174/ajnr.A3293. [DOI] [PMC free article] [PubMed] [Google Scholar]
- 16.American Diabetes Association. Standards of medical care in diabetes - 2010. Diabetes Care. 2010;33(Suppl 1):S11–61. doi: 10.2337/dc10-S011. [DOI] [PMC free article] [PubMed] [Google Scholar]
- 17.Galea M, Woodward M. Mini-Mental State Examination (MMSE) Aust J Physiother. 2005;51:198. doi: 10.1016/s0004-9514(05)70034-9. [DOI] [PubMed] [Google Scholar]
- 18.Fischl B, Salat DH, Busa E, Albert M, Dieterich M, Haselgrove C, et al. Whole brain segmentation: Automated labeling of neuroanatomical structures in the human brain. Neuron. 2002;33:341–55. doi: 10.1016/s0896-6273(02)00569-x. [DOI] [PubMed] [Google Scholar]
- 19.Smith EE, Egorova S, Blacker D, Killiany RJ, Muzikansky A, Dickerson BC, et al. Magnetic resonance imaging white matter hyperintensities and brain volume in the prediction of mild cognitive impairment and dementia. Arch Neurol. 2008;65:94–100. doi: 10.1001/archneurol.2007.23. [DOI] [PubMed] [Google Scholar]
- 20.Van Leemput K, Bakkour A, Benner T, Wiggins G, Wald LL, Augustinack J, et al. Automated segmentation of hippocampal subfields from ultra-high resolution in vivo MRI. Hippocampus. 2009;19:549–57. doi: 10.1002/hipo.20615. [DOI] [PMC free article] [PubMed] [Google Scholar]
- 21.Gold SM, Dziobek I, Sweat V, Tirsi A, Rogers K, Bruehl H, et al. Hippocampal damage and memory impairments as possible early brain complications of type 2 diabetes. Diabetologia. 2007;50:711–9. doi: 10.1007/s00125-007-0602-7. [DOI] [PubMed] [Google Scholar]
- 22.Bruehl H, Wolf OT, Sweat V, Tirsi A, Richardson S, Convit A. Modifiers of cognitive function and brain structure in middle-aged and elderly individuals with type 2 diabetes mellitus. Brain Res. 2009;1280:186–94. doi: 10.1016/j.brainres.2009.05.032. [DOI] [PMC free article] [PubMed] [Google Scholar]
- 23.Kamiyama K, Wada A, Sugihara M, Kurioka S, Hayashi K, Hayashi T, et al. Potential hippocampal region atrophy in diabetes mellitus type 2: A voxel-based morphometry VSRAD study. Jpn J Radiol. 2010;28:266–72. doi: 10.1007/s11604-009-0416-2. [DOI] [PubMed] [Google Scholar]
- 24.Fontán-Lozano A, Sáez-Cassanelli JL, Inda MC, de los Santos-Arteaga M, Sierra-Domínguez SA, López-Lluch G, et al. Caloric restriction increases learning consolidation and facilitates synaptic plasticity through mechanisms dependent on NR2B subunits of the NMDA receptor. J Neurosci. 2007;27:10185–95. doi: 10.1523/JNEUROSCI.2757-07.2007. [DOI] [PMC free article] [PubMed] [Google Scholar]
- 25.Rasgon NL, Kenna HA, Wroolie TE, Kelley R, Silverman D, Brooks J, et al. Insulin resistance and hippocampal volume in women at risk for Alzheimer's disease. Neurobiol Aging. 2011;32:1942–8. doi: 10.1016/j.neurobiolaging.2009.12.005. [DOI] [PMC free article] [PubMed] [Google Scholar]
- 26.Xue HY, Jin L, Jin LJ, Li XY, Zhang P, Ma YS, et al. Aucubin prevents loss of hippocampal neurons and regulates antioxidative activity in diabetic encephalopathy rats. Phytother Res. 2009;23:980–6. doi: 10.1002/ptr.2734. [DOI] [PubMed] [Google Scholar]
- 27.Small SA, Schobel SA, Buxton RB, Witter MP, Barnes CA. A pathophysiological framework of hippocampal dysfunction in ageing and disease. Nat Rev Neurosci. 2011;12:585–601. doi: 10.1038/nrn3085. [DOI] [PMC free article] [PubMed] [Google Scholar]
- 28.Braak E, Braak H. Alzheimer's disease: Transiently developing dendritic changes in pyramidal cells of sector CA1 of the Ammon's horn. Acta Neuropathol. 1997;93:323–5. doi: 10.1007/s004010050622. [DOI] [PubMed] [Google Scholar]
- 29.Mizutani T, Kasahara M. Hippocampal atrophy secondary to entorhinal cortical degeneration in Alzheimer-type dementia. Neurosci Lett. 1997;222:119–22. doi: 10.1016/s0304-3940(97)13365-1. [DOI] [PubMed] [Google Scholar]
- 30.Biessels GJ, Deary IJ, Ryan CM. Cognition and diabetes: A lifespan perspective. Lancet Neurol. 2008;7:184–90. doi: 10.1016/S1474-4422(08)70021-8. [DOI] [PubMed] [Google Scholar]
- 31.Vagelatos NT, Eslick GD. Type 2 Diabetes as a Risk Factor for Alzheimer's Disease: The Confounders, Interactions, and Neuropathology Associated With This Relationship. Epidemiol Rev. 2013 doi: 10.1093/epirev/mxs012. Epub ahead of print. [DOI] [PubMed] [Google Scholar]
- 32.Peila R, Rodriguez BL, Launer LJ Honolulu-Asia Aging Study. Type 2 diabetes, APOE gene, and the risk for dementia and related pathologies: The Honolulu-Asia Aging Study. Diabetes. 2002;51:1256–62. doi: 10.2337/diabetes.51.4.1256. [DOI] [PubMed] [Google Scholar]
- 33.Xu WL, von Strauss E, Qiu CX, Winblad B, Fratiglioni L. Uncontrolled diabetes increases the risk of Alzheimer's disease: A population-based cohort study. Diabetologia. 2009;52:1031–9. doi: 10.1007/s00125-009-1323-x. [DOI] [PubMed] [Google Scholar]
- 34.Henninger N, Feldmann RE, Jr, Fütterer CD, Schrempp C, Maurer MH, Waschke KF, et al. Spatial learning induces predominant downregulation of cytosolic proteins in the rat hippocampus. Genes Brain Behav. 2007;6:128–40. doi: 10.1111/j.1601-183X.2006.00239.x. [DOI] [PubMed] [Google Scholar]
- 35.Eichenbaum H. A cortical-hippocampal system for declarative memory. Nat Rev Neurosci. 2000;1:41–50. doi: 10.1038/35036213. [DOI] [PubMed] [Google Scholar]
- 36.Eldridge LL, Engel SA, Zeineh MM, Bookheimer SY, Knowlton BJ. A dissociation of encoding and retrieval processes in the human hippocampus. J Neurosci. 2005;25:3280–6. doi: 10.1523/JNEUROSCI.3420-04.2005. [DOI] [PMC free article] [PubMed] [Google Scholar]
- 37.Carr VA, Viskontas IV, Engel SA, Knowlton BJ. Neural activity in the hippocampus and perirhinal cortex during encoding is associated with the durability of episodic memory. J Cogn Neurosci. 2010;22:2652–62. doi: 10.1162/jocn.2009.21381. [DOI] [PubMed] [Google Scholar]