Figure 3.

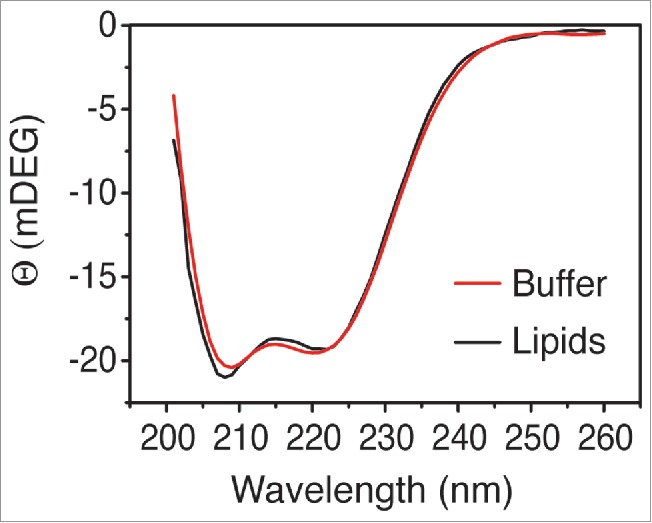
CD spectra of gp15-gp16 in the absence (red line) or presence of liposomes (black line, POPE:POPG 70:30 mol%). A minor, yet distinct change of the CD signal is observed at 208 nm, indicating an increase in α-helical content.

CD spectra of gp15-gp16 in the absence (red line) or presence of liposomes (black line, POPE:POPG 70:30 mol%). A minor, yet distinct change of the CD signal is observed at 208 nm, indicating an increase in α-helical content.