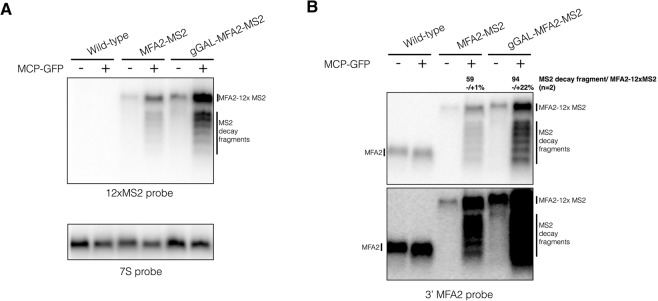
FIGURE 2.
Decay fragments are detectable in MFA2-MS2 genomic constructs. Total RNA was isolated and visualized from strains expressing MFA2-12×MS2 from the chromosome. Grown as described in Haimovich et al. (2016). (A) Total RNA from wild-type, mfa2::MFA2-12×MS2 (MFA2-MS2) and mfa2::GALpromoter-MFA2-12×MS2 (gGAL-MFA2-MS2) plus and minus the pUG36-CP-GFP×3 plasmid was run on a 1.5% formaldehyde agarose gel, probed with 12×MS2 probe, and then stripped and reprobed with 7S probe (5′-GTCTAGCCGCGAGGAAGG-3′). (B) Same as above except visualized with a probe to the 3′ UTR of MFA2 (5′-GATGAGAGAATTGGAATAAATTAGTTTGCCAGC-3′) with a light (top panel) and a dark exposure (bottom panel) of the blot. Quantification of the percentage of decay fragment relative to full-length MS2-tagged mRNA was done using ImageJ to calculate the total intensity of the decay fragments over the total intensity of the full-length mRNA. Both values had the background values subtracted prior to calculation. This percentage represents the average of two biological replicates and its standard deviation.

