

Abstract
The current study identified bacterial factors that may improve management of methicillin-resistant Staphylococcus aureus (MRSA) nosocomial pneumonia. Isolates were obtained from 386 patients enrolled in a randomized, controlled study of antibiotic efficacy. Isolates were screened for production of virulence factors and for vancomycin susceptibility. After adjustment for host factors such as severity of illness and treatment modality, cytotoxic activity was strongly and inversely associated with mortality; however, it had no effect on clinical cure. Isolates having low cytotoxicity, which were derived largely from healthcare-associated clones, exhibited a greater prevalence of vancomycin heteroresistance, and they were recovered more often from patients who were older and frailer. Additionally, a clone with low cytotoxic activity was associated with death and poor clinical improvement. Clone specificity and attenuated virulence appear to be associated with outcome. To our knowledge, these are the first correlations between MRSA virulence and mortality in nosocomial pneumonia.
Keywords: Staphylococcus aureus, MRSA, nosocomial pneumonia, outcome, virulence
(See the editorial commentary by Popovich and Hayden on pages 1857–9.)
Therapy of nosocomial pneumonia (NP) caused by methicillin-resistant Staphylococcus aureus (MRSA) is often ineffective. Mortality rates are around 20%–40%, even when treatment conditions are optimized under experimental protocols [1–3]. A rational approach for improving outcomes has sought to understand microbial factors that distinguish favorable from adverse outcomes. Recently, the role of genetically distinct strains of MRSA of community origin on the outcome of MRSA infection has attracted attention [4–7]. Community-acquired MRSA (CA-MRSA) strains have emerged as a cause of infections inside healthcare settings [8, 9], and they have been linked with differences in virulence profile and clinically significant events, such as NP [9–12]. Explanations for conflicting outcome differences from these studies have been limited by difficulty in establishing the intrinsic virulence of a given bacterial strain. Moreover, the status of the host is critical to the outcome of MRSA infection, and particularly NP, independent of the presence or absence of virulence attributes [13–15]. Thus, the virulence or nonvirulence of a strain cannot be inferred from the outcomes of the patients from which the strain was isolated without specifying factors such as host risk and infection type. The issue is particularly relevant for subsets of NP, such as ventilator-associated pneumonia, that may have no attributable mortality [13, 16, 17].
In the present work, we sought to disentangle characteristics of the bacteria and host that predispose individuals to severe outcomes. The 381 MRSA strains studied composed all available pulmonary isolates obtained at the time of diagnosis during a large prospective clinical trial comparing the efficacy of linezolid and vancomycin in the treatment of NP due to MRSA [18]. Pooled analysis of individual patient-level data were used to discern the impact of treatment strategies on clinical cure and mortality. The analyses took into account host-related factors and organism-related factors, namely virulence and antimicrobial resistance. Analysis included adjustment for the potentially confounding effects of clonality. We measured virulence under normalized conditions, using a combination of relative leukocytotoxic activity (in which individual leukotoxic activities are inseparable) and screening for functionality of the global virulence regulator agr.
METHODS
MRSA Isolates
MRSA strains were obtained during a previously described randomized, double-blinded, international, multicenter clinical trial [18]. Between October 2004 and January 2010, hospitalized patients aged ≥18 years with radiographic and clinical evidence of pneumonia were randomized to treatment with intravenous linezolid or weight-based vancomycin. The study protocol allowed for vancomycin dosage adjustments and pharmacokinetic monitoring according to the local standard of care. Extensive inclusion and exclusion criteria, as well as antimicrobial interventions and assessments, have been described previously [18]. Although invasive, quantitative methods were not required for diagnosis, reflecting common practice in the United States, most diagnoses were made by invasive methods or blood culture. Clinical outcome was assessed within 5 days after the end of treatment, defined as within 72 hours of the last dose of antimicrobial, and at the end of the study, defined as 7–30 days after the last dose.
Overall mortality was assessed at 60 days after therapy. Cultures were obtained at baseline, the end of treatment, and the end of the study. Of the 1225 patients randomized in this study, 448 were included in a modified intention-to-treat analysis of patients who received study drug and received a diagnosis of MRSA NP. Three hundred eighty-one available baseline isolates, from 160 patients with hospital- or healthcare-associated MRSA pneumonia and 221with ventilator-associated pneumonia, were used in the analysis. Primary airway cultures, obtained by several methods, were used in all 381 cases. Five additional patients whose isolates were from blood were not initially available for determination of cytotoxic activity were included in the analysis of outcomes (n = 386) [19]. (Consistent with previous reports [20], genotypic and phenotypic characteristics of pairs of blood and respiratory isolates among the 29 other patients with bacteremic pneumonia for which both isolates were available were always identical [data not shown].) All laboratory work was performed blinded with respect to patient data.
agr Functionality
Hemolytic patterns produced by Staphylococcus on sheep's blood agar by cross-streaking against RN4220, which produces only β-hemolysin, were used to semiquantitatively assay agr functionality [21, 22]. Previous work indicates that completely nonhemolytic strains of S. aureus and Staphylococcus epidermidis harbor inactivating mutations in agr genes in virtually all cases [20, 23–25].
Cytotoxic Activity
Bacteriologically sterile culture filtrate preparations, obtained from early logarithmic-phase (6 hours) growth, were used for differentiating cytotoxic activity, as described elsewhere [26]. Briefly, strains were grown in 96-well, round-bottomed plates containing 150 µL of tryptic soy broth for 16 hours with shaking at 2469g at 37°C. Cultures were diluted 1:75 with fresh Roswell Park Memorial Institute plus casamino acids, and 150 µL of the diluted culture was regrown in 96-well, round-bottomed plates for 6 hours at 2469g at 37°C. Plates were centrifuged to pellet the bacteria, and culture supernatants were collected and stored at −80°C until used. To measure the cytotoxic activity within culture supernatants, we used cells from the human myeloid cell line HL-60 that were differentiated into neutrophil-like cells (PMN-HL60). PMN-HL60 cells have been extensively used to evaluate the cytotoxic activity of S. aureus culture supernatants and have been shown to mimic the sensitivity of primary human neutrophils [26–28]. To measure cell viability, we monitored metabolic activity using CellTiter (Promega), as described by the manufacturer. Twenty microliters of S. aureus supernatant was incubated with approximately 1.0 × 10⁵ PMN-HL60 cells in a final volume of 100 µL (20% v/v supernatants) for 2 hours at 37°C, followed by 2-hour incubation with the CellTiter reagent.
Each sample was assayed in triplicate, and the experiments were repeated at least twice. Variability in the assay was observed, partially as a result of differences in growth rates among the strains, with errors skewed positively at low values and negatively at high (Supplementary Table 1 and data not shown). However, consistently high (or low) cytotoxicity as defined was a stable trait of a given clinical MRSA isolate. Although there are no biologically driven informative break points for cytotoxic activity, use of ≥90% killing of the cells within 2 hours as a marker of highly cytotoxic strains resulted in a convenient and clear-cut parameter that was analyzed dichotomously. Because a dichotomous tool ignores some of the information contained in a scoring system, we also modeled the exposure variables as a stratified score with quartiles, to allow for nonlinear associations and for ease of interpretability (compared with single-unit comparisons). The highest quartile of cytotoxicity (92% killing) closely approximated the cutoff for highly cytotoxic strains and provided a basis for why this value was chosen.
Genotyping
The relatedness of strains from respiratory tract and blood specimens from subjects, as well as variants from mixed agr+ and agr− cultures, was previously determined by DNA sequence analysis of the protein A gene variable repeat region (spa typing), pulsed-field gel electrophoresis, and a variety of additional DNA polymorphisms including staphylococcal cassette chromosome mec (SCCmec), agr specificity group, and the presence or absence of the pvl gene [19]. Clonal complexes (CCs) were assigned on the basis of spa typing results, using the multilocus sequence typing mapping database (http://spa.ridom.de/mlst) or peer-reviewed reports, as described elsewhere [19]. Previously published polymerase chain reaction primers and conditions were used to screen all study isolates for the presence of sasX [29].
Susceptibility Testing
Isolates were previously tested for susceptibility by broth microdilution and Etest and for heterogenous vancomycin resistance by Etest methods [19].
Statistical Analysis
Comparisons of proportions were performed by the Fisher exact test or χ2 analysis, and comparisons of continuous variables were performed by analysis of variance or the t test. Outcomes were modeled using logistic regression with backward elimination and a 1000 bootstrap sample strategy for confirmation. All variables from the parent study were considered for the modeling building process [18] (Table 1). Before model building, covariate reduction techniques were used to adjust for near-zero variance, missingness, and covariate correlations, associations, and clusters. Criteria for entry into and retention within the model were P values of .05 and .10, respectively. No significant interactions were found.
Table 1.
Clinical Data and Bacterial Characteristics Among Patients With Nosocomial Pneumonia Due to Methicillin-Resistant Staphylococcus aureus (MRSA), by Cytotoxicity
| Characteristic | High Cytotoxicitya (n = 108) | Low Cytotoxicity (n = 273) | P Values |
|---|---|---|---|
| Genotypic characteristic | |||
| agr group | |||
| Overall | 2.0 ± 0.2 | 1.3 ± 0.8 | <.0001 |
| I | 83 (76.9) | 68 (24.9) | <.0001 |
| II | 25 (23.1) | 196 (71.8) | <.0001b |
| III | 0 (0.0) | 8 (2.9) | |
| NT | 0 (0.0) | 1 (0.4) | |
| SCCmec type | |||
| I, II, III | 20 (18.5) | 243 (89.0) | <.0001 |
| IV | 88 (81.5) | 30 (11.0) | |
| CC | <.0001 | ||
| 5 | 24 (22.2) | 197 (72.2) | <.0001c |
| 8 | 69 (63.9) | 17 (6.2) | <.0001c |
| 22 | 7 (6.5) | 1 (0.4) | .0008c |
| 45 | 0 (0.0) | 13 (4.8) | .0235c |
| 8/239 | 4 (3.7) | 34 (12.5) | .008c |
| Other | 4 (3.7) | 11 (4.0) | |
| spa type 2 | 11 (10.2) | 112 (41.0) | <.0001 |
| pvl (positive) | 39 (36.1) | 9 (3.3) | <.0001 |
| Phenotypic characteristic | |||
| agr defective | 0 (0.0) | 61 (22.3) | <.0001 |
| agr functionalityd | |||
| 0 | 0 (0.0) | 61 (22.3) | <.0001e |
| 1 | 4 (3.7) | 68 (24.9) | |
| 2 | 104 (96.3) | 144 (52.7) | |
| 0, 1 | 4 (3.7) | 129 (47.3) | <.0001f |
| hVISA | 4 (3.7) | 56 (20.5) | <.0001 |
| Vancomycin MIC | |||
| By the Etest | |||
| >1 | 96 (88.9) | 241 (88.3) | 1 |
| >1.5 | 22 (20.4) | 99 (36.3) | .0032 |
| By an automated method | |||
| 0.5 | 15 (13.9) | 14 (5.1) | .0082 |
| 1 | 87 (80.6) | 231 (84.9) | |
| ≥2 | 6 (5.6) | 27 (9.9) | |
| Linezolid MIC, by the Etest | |||
| 1 | 9 (8.6) | 14 (5.1) | .0594 |
| 2 | 80 (76.2) | 188 (69.1) | |
| 4 | 16 (15.2) | 70 (25.7) | |
| Demographic/clinical characteristic | |||
| Age, y | |||
| Overallg | 56.6 ± 20.2 | 63.5 ± 17.1 | .0008 |
| >65 | 46 (42.6) | 145 (53.1) | .0696 |
| Weight, kgh | 77.3 ± 21.5 | 78.3 ± 22.5 | .6812 |
| Male sex | 76 (70.4) | 167 (61.2) | .0989 |
| Race | |||
| Asian | 11 (10.2) | 48 (17.6) | .0051 |
| Black | 21 (19.4) | 26 (9.5) | |
| White | 75 (69.4) | 184 (67.4) | .7168i |
| Other | 1 (0.9) | 15 (5.5) | |
| Region | |||
| Asia | 8 (7.4) | 43 (15.8) | .0006 |
| Europe | 19 (17.6) | 17 (6.2) | |
| Latin America | 5 (4.6) | 31 (11.4) | |
| Other | 7 (6.5) | 10 (3.7) | |
| United States | 69 (63.9) | 172 (63) | |
| Treatment | |||
| Linezolid | 53 (49.1) | 136 (49.8) | .91 |
| Vancomycin | 55 (50.9) | 137 (50.2) | |
| APACHE II score | |||
| Overallj | 17.0 ± 5.7 | 17.5 ± 6.3 | .4248 |
| ≤20 | 74 (68.5) | 186 (68.1) | .27k |
| >20 | 31 (28.7) | 85 (31.1) | |
| Missing | 3 (2.8) | 2 (0.7) | |
| CPISl | 9.6 (1.9) | 9.4 (2.3) | .4714 |
| Creatinine clearance rate (MDRD)m | 100.4 ± 48.4 | 91.6 ± 58.2 | .1726 |
| ICU stay at baseline | 95 (88.0) | 237 (86.8) | .8658 |
| Vasopressor therapy at baseline | 19 (17.6) | 45 (16.5) | .8792 |
| Corticosteriod therapy at baseline | 19 (17.6) | 63 (23.1) | .2702 |
| Bacteremia | 15 (13.9) | 36 (13.2) | .8681 |
| Chest radiography finding | |||
| Bilateral | 69 (63.9) | 190 (69.6) | .1776 |
| Unilateral | 38 (35.2) | 83 (30.4) | |
| Missing | 1 (0.9) | 0 (0.0) | |
| Pleural effusion | 38 (35.2) | 133 (48.7) | .022 |
| Pneumonia, by type | |||
| Hospital associated | 21 (19.4) | 78 (28.6) | .0034 |
| Healthcare associated | 10 (9.3) | 51 (18.7) | |
| Ventilator associated | 77 (71.3) | 144 (52.7) | |
| Ventilation at baseline | 83 (76.9) | 190 (69.6) | .1674 |
| Infecting pathogen(s) | |||
| MRSA + anaerobe | 0 (0.0) | 2 (0.7) | .4757 |
| MRSA + fungus | 1 (0.9) | 10 (3.7) | |
| MRSA + gram negative | 33 (30.6) | 66 (24.2) | |
| MRSA + gram positive | 10 (9.3) | 21 (7.7) | |
| MRSA + gram positive + gram negative | 5 (4.6) | 15 (5.5) | |
| MRSA only | 59 (54.6) | 159 (58.2) | |
| Gram-negative coverage at baseline | 105 (97.2) | 269 (98.5) | .4097 |
| Anaerobic coverage at baseline | 64 (59.3) | 148 (54.2) | .4234 |
| Service | |||
| Medical | 49 (45.4) | 162 (59.3) | .0012 |
| Surgical | 24 (22.2) | 68 (24.9) | |
| Trauma | 35 (32.4) | 43 (15.8) | |
| Comorbidity | |||
| Cardiac | 54 (50.0) | 175 (64.1) | .0146 |
| Diabetes | 29 (26.9) | 121 (44.3) | .0017 |
| Neoplastic | 12 (11.1) | 29 (10.6) | .8565 |
| Renal/urinary | 30 (27.8) | 124 (45.4) | .0017 |
| Pulmonary | 74 (68.5) | 187 (68.5) | 1 |
| Hepatobiliary | 13 (12.0) | 41 (15.0) | .5168 |
| Gastrointestinal | 61 (56.5) | 157 (57.5) | .9087 |
| LTCF stay at baseline | 4 (3.7) | 12 (4.4) | 1 |
| Outcome | |||
| Clinical response | |||
| At end of treatment | 72 (73.5) | 203 (76.6) | .5815 |
| At end of study | 51 (53.7) | 130 (52.4) | .9039 |
| Mortality | |||
| Overall | 14 (13.0) | 85 (31.1) | .0002 |
| By day 28 | 6 (5.6) | 60 (22.0) | <.0001 |
| By day 60 | 13 (12.0) | 81 (29.7) | .0002 |
Data are no. (%) of patients or mean value ± SD.
Abbreviations: APACHE, Acute Physiology And Chronic Health Evaluation; CPIS, Clinical Pulmonary Infection Score; hVISA, vancomycin-heteroresistant S. aureus; ICU, intensive care unit; LTCF, long-term care facility; MDRD, Mediterranean diet in renal disease; MIC, minimum inhibitory concentration; NT, not typable; SCCmec, staphylococcal cassette chromosome mec.
a Defined as a mean of ≥90% killing of PMN-HL60 cells within 2 hours.
b Compared with data for types I and III combined and for NT.
c Compared with data for the other 4 CCs.
d Semiquantitative scoring of δ-hemolysin on sheep blood agar: 0, nonhemoltyic; 1, weakly hemolytic; 2, strongly hemolytic.
e Compared with data for agr functionality 1 and for agr functionality 2.
f Compared with data for agr functionality 2.
g Data are for 108 in the high cytotoxicity group and 273 in the low cytotoxicity group.
h Data are for 108 in the high cytotoxicity group and 272 in the low cytotoxicity group.
i Compared with data for Asian, Black, and Other combined.
j Data are for 105 in the high cytotoxicity group and 271 in the low cytotoxicity group.
k Compared with data for >20 and for Missing.
l Data are for 81 in the high cytotoxicity group and 185 in the low cytotoxicity group.
m Data are for 104 in the high cytotoxicity group and 268 in the low cytotoxicity group.
RESULTS
Cytotoxic Virulence
Staphylococcal virulence is multifactorial, making it difficult to assess the contribution of specific virulence factors to outcomes in S. aureus infection. A promising approach to address virulence is to assess the role of global regulatory systems that affect a large part of the virulon, such as the quorum-sensing virulence regulator agr [30]. A significant fraction of clinical isolates have genotypic agr defects [20, 23, 24], which raises the possibility of determining the role of this system, and therefore virulence, in disease. However, agr functionality alone does not imply efficient expression of virulence. To more fully capture differences in virulence among isolates, we sought an additional, direct measure of virulence factor production. The leukocytotoxins, agr-regulated pore-forming toxins (bicomponent leukocidins and alpha-hemolysin) [31, 32], and membrane-damaging cytolytic peptides [33] that are found in virtually all staphylococcal isolates are attractive candidates for a wide-ranging virulence factor whose presence can effectively distinguish low- and high-virulence strains.
Comparison of the cytotoxic activity of 381 individual isolates revealed that a majority (n = 273) were not highly cytotoxic (Table 1 and Supplementary Table 1). When cytotoxic activities were linked to the genetic background of the strain, we found that for about 90% of the isolates the 3 major MRSA CCs (CC5, CC8, and CC8/239) displayed a characteristic level (Figure 1A). CC8 strains were consistently the most cytotoxic. In contrast, CC5 variants had no specific pattern of cytotoxicity, and CC8/239 strains were on average weakly cytotoxic. Not surprisingly, the relative level of agr expression by distinct MRSA strains correlated with cytotoxic properties (P < .0001; Table 1 and Figure 1B). However, cytotoxic profiles varied remarkably within each CC and even within the same agr functional group.
Figure 1.
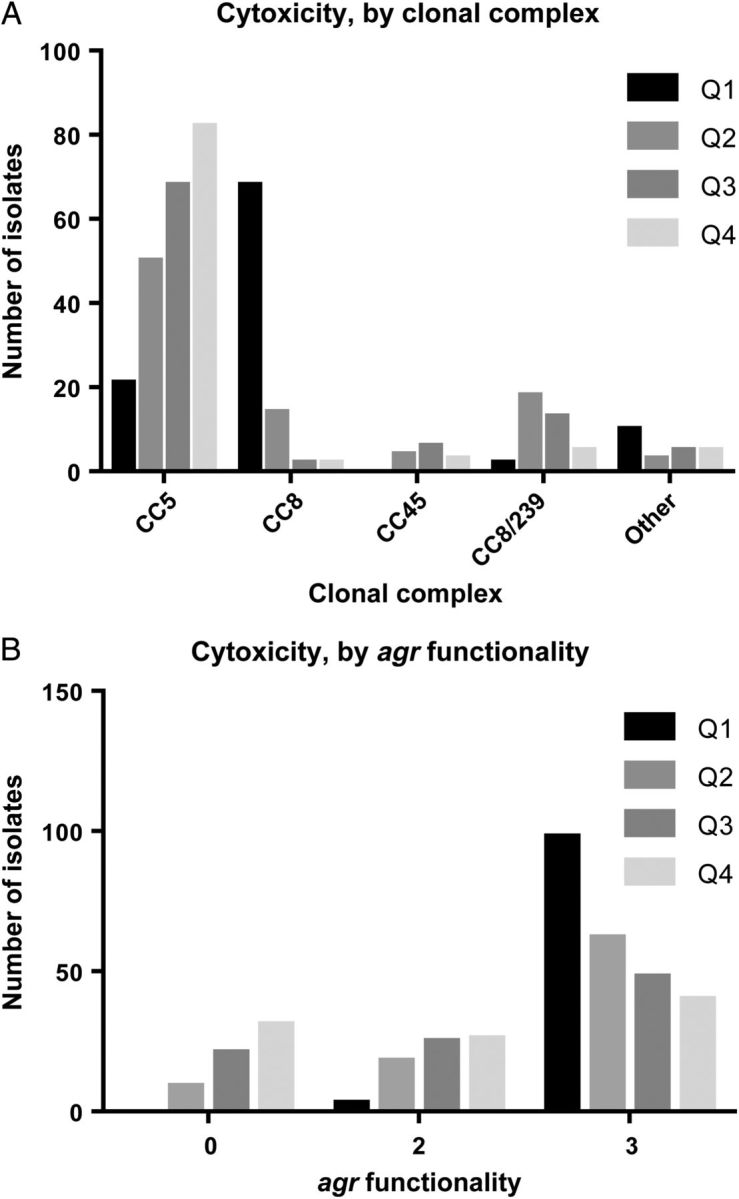
Cytotoxic activity, by major clonal complex (CC; A) and agr functionality (B). CCs are considered major if there are ≥10 strains with the same CC. Cell viability of PMN-HL60 cells with 20 µL of supernatant for 2 hours, measured with the metabolic dye CellTiter. δ-hemolysin semiquantitative scoring on sheep blood agar: 0, nonhemoltyic; 1, weakly hemolytic; 2, strongly hemolytic. Q, quartile range of cytotoxicity, from the upper quartile (Q1) to the lower quartile (Q4).
Antimicrobial Susceptibility and Cytotoxicity
Reduced susceptibility to vancomycin has been linked to clinical failure of vancomycin treatment [34] and agr dysfunction [35, 36]. It may also influence S. aureus pathogenicity independent of agr function [37, 38]. Overall, the vancomycin minimum inhibitory concentrations (MICs) for study isolates were comparable to those of recent series (Table 1 and Supplementary Table 1). Six of 60 vancomycin-heteroresistant S. aureus (hVISA) isolates had a standard Etest MIC of ≤1.0, 27 had an MIC of 1.5, and 27 had had an MIC of ≥ 2 µg/mL. Thus, we observed poor concordance between vancomycin heteroresistance and high MICs. However, an elevated vancomycin MIC (≥1.5 µg/mL) was associated with low cytotoxic activity (36% vs 20%; P = .0032; Table 1) and CC (P = .0022; not shown) but not with agr functionality (31% vs 31%; P = 1.0; data not shown). The MICs of linezolid were below the resistance break point (≤4 μg/mL) for all isolates. More than 90% of the linezolid MICs were identical within 1 dilution (2.0–4.0); thus, the usefulness of linezolid susceptibility as a marker for outcome was limited.
CA-MRSA Genes
MRSA strains prevalent in the community differ from healthcare-associated strains in that they carry a different SCCmec (SCCmecIV), are resistant to fewer antibiotic classes (frequently only β-lactams and erythromycin), and often have genes encoding toxins such as Panton-Valentine leukocidin [39]. Many different strains of CA-MRSA now have a worldwide distribution. In contrast, MRSA strains carrying SCCmec types I, II, and III and their derivatives are usually restricted to hospital-acquired MRSA (HA-MRSA) clones that are not found widely within the healthy population. Strains belonging to SCCmecIV demonstrated high cytotoxic activity (82% vs 11%; P < .0001; Table 1) and high susceptibility to vancomycin (79% vs 63%; P = .0029; data not shown). In contrast, many HA-MRSA strains produced very weak cytotoxic activity, below levels expected to correlate with mortality in animals. Indeed, a number of strains (22/381 [6%] HA-MRSA) produced no detectable cytotoxic activity. Nevertheless, HA-MRSA strains were still the predominant isolate from patients with NP.
Modeling of Mortality
To define potential predictors of mortality, we performed univariate and multivariate logistic regression analyses. Five additional patients whose isolates were from blood specimens and were not available for determination of cytotoxic activity were included in the analysis of outcomes because the MRSA genotypes were previously determined (n = 386) [19]. All variables examined, including baseline patient data from the original studies, are listed in Table 1 and Supplementary Table 1. Results of the multivariate analysis and a comparison with the univariate results are provided in Table 2.
Table 2.
Risk Factors Associated With Mortality Among Patients With Nosocomial Pneumonia Due to Methicillin-Resistant Staphylococcus aureus
| Factor | Univariate Analysis |
Multivariate Analysis |
||
|---|---|---|---|---|
| OR (95% CI) | P Values | OR (95% CI) | P Values | |
| Genotypic characteristic | ||||
| CC8 | 0.80 (.46–1.41) | .4442 | 2.97 (1.20–7.36) | .0183 |
| CC8/239 | 2.59 (1.33–5.07) | .0053 | 3.36 (1.29–8.77) | .0131 |
| SCCmec (type IV vs other) | 0.60 (.35–1.01) | .0544 | … | |
| Cytotoxicity | ||||
| Low (>10 vs ≤10)a | 3.04 (1.64–5.63) | .0004 | 4.36 (1.77–10.76) | .0014 |
| Per 10-unit increase | 1.10 (1.03–1.17) | .0043 | … | |
| Quartileb | .0108 | |||
| Q2 vs Q1 | 2.50 (1.23–5.10) | … | ||
| Q3 vs Q1 | 2.44 (1.21–4.95) | … | ||
| Q4 vs Q1 | 3.13 (1.57–6.23) | … | ||
| Median (>45 vs ≤45) | 1.72 (1.08–2.74) | .0215 | … | |
| Demographic/clinical characteristic | ||||
| Age | ||||
| Per 5-unit increase | 1.20 (1.11–1.30) | <.0001 | 1.19 (1.08–1.31) | .0003 |
| >65 y | 2.89 (1.78–4.69) | <.0001 | … | |
| APACHE II score | ||||
| Per 5-unit increase | 1.71 (1.40–2.10) | <.0001 | 1.70 (1.34–2.16) | <.0001 |
| >20 vs ≤20 | 3.44 (2.13–5.56) | <.0001 | … | |
| Creatinine clearance rate (MDRD) | ||||
| Per 20-unit increase | 0.87 (.79–.95) | .0037 | … | |
| 30–80 vs >80 | 2.78 (1.68–4.61) | <.0001 | … | |
| <30 vs >80 | 3.28 (1.55–6.92) | … | ||
| Bacteremia | 2.06 (1.14–3.72) | .0172 | … | |
| Chest radiography finding (bilateral vs unilateral) | 1.72 (1.02–2.89) | .0413 | … | |
| Vasopressor therapy at baseline | 2.30 (1.32–4.01) | .0033 | … | |
| Service | .0328 | |||
| Surgical vs medical | 0.74 (.43–1.29) | … | ||
| Trauma vs medical | 0.41 (.21–.81) | … | ||
| Nonmedical vs medical | 0.58 (.36–.93) | .0239 | … | |
| Region | .0133 | |||
| Asia vs US | 0.65 (.31–1.37) | 0.62 (.25–1.52) | .0027 | |
| Europe vs US | 0.46 (.17–1.24) | 0.55 (.18–1.72) | ||
| Latin America vs US | 2.56 (1.25–5.22) | 4.55 (1.72–12.07) | ||
| Other vs US | 1.56 (.55–4.39) | 3.79 (.97–14.75) | ||
| Comorbidity | ||||
| Cardiac | 1.97 (1.20–3.21) | .0068 | … | |
| Diabetes | 1.64 (1.04–2.59) | .0345 | … | |
| Neoplastic | 1.96 (1.00–3.84) | .0506 | … | |
| Renal/urinary | 1.88 (1.19–2.97) | .0073 | … | |
| Gastrointestinal | 2.19 (1.35–3.56) | .0016 | 2.51 (1.36–4.61) | .0031 |
Data are only for factors that were statistically significant in univariate or multivariate analysis. The full set of factors included is listed in Table 1.
Abbreviations: APACHE, Acute Physiology and Chronic Health Evaluation; CI, confidence interval; CPIS, Clinical Pulmonary Infection Score; MDRD, Mediterranean diet in renal disease; OR, odds ratio; SCCmec, staphylococcal cassette chromosome mec.
a Defined as a mean of <90% killing of PMN-HL60 cells within 2 hours.
b Defined as the percentage of viable cells after intoxication of PMN-HL60. Q1, <9%; Q2, ≥9% to <45%; Q3, ≥45% to <78%; Q4, ≥78%.
In the univariate analysis, low Acute Physiology and Chronic Health Evaluation (APACHE) II score and 11 patient comorbidities were statistically significantly associated with mortality (P < .05). Among baseline bacterial characteristics, strains having low cytotoxic activity and a non-SCCmecIV phenotype were uniquely and paradoxically associated with lethality. Only 14 of the 108 patients (13%) infected with highly cytotoxic strains died, whereas 85 of 273 (31%) infected with low cytotoxic strains died (P = .0002). Correlation of mortality with low cytotoxic activity was observed across geography, genotypes, and type of pneumonia (ventilator-associated pneumonia or hospital-associated pneumonia; Table 3). Additionally, CC8/239, a clone with low cytotoxic activity, was associated with mortality (odds ratio [OR], 2.6; P = .0053).
Table 3.
Relative Risk of Mortality Among Patients With Nosocomial Pneumonia Due to Methicillin-Resistant Staphylococcus aureus (MRSA), by Isolate and Patient Characteristic
| Covariate | Patients Who Died/Patients Evaluated (%) |
RR (95% CI) | |
|---|---|---|---|
| Low Cytotoxic Activity (n = 273) | High Cytotoxic Activitya (n = 108) | ||
| Genotypic characteristic | |||
| agr group | |||
| I | 27/68 (39.7) | 13/83 (15.7) | 2.54 (1.42–4.52) |
| II | |||
| No (groups I, III) | 27/76 (35.5) | 13/83 (15.7) | 2.27 (1.27–4.07) |
| Yes | 58/196 (29.6) | 1/25 (4.0) | 7.40 (1.07–51.09) |
| III | 0/8 (0.0) | 0/0 (NA) | … |
| NT | 0/1 (0.0) | 0/0 (NA) | … |
| SCCmec type | |||
| I, II, III | 75/243 (30.9) | 1/20 (5.0) | 6.17 (.91–42.09) |
| IV | 10/30 (33.3) | 13/88 (14.8) | 2.26 (1.11–4.60) |
| Clonal complex | |||
| 5 | |||
| No | 27/76 (35.5) | 13/84 (15.5) | 2.30 (1.28–4.12) |
| Yes | 58/197 (29.4) | 1/24 (4.2) | 7.07 (1.02–48.72) |
| 8 | |||
| No | 77/256 (30.1) | 3/39 (7.7) | 3.91 (1.30–11.78) |
| Yes | 8/17 (47.1) | 11/69 (15.9) | 2.95 (1.41–6.19) |
| 22 | |||
| No | 85/272 (31.3) | 14/101 (13.9) | 2.25 (1.34–3.78) |
| Yes | 0/1 (0.0) | 0/7 (0.0) | … |
| 45 | 2/13 (15.4) | 0/0 (NA) | … |
| No | 83/260 (31.9) | 14/108 (13.0) | 2.46 (1.46–4.14) |
| Yes | 2/13 (15.4) | 0/0 (NA) | … |
| 8/239 | 17/34 (50.0) | 1/4 (25.0) | 2.00 (.35–11.29) |
| No | 68/239 (28.5) | 13/104 (12.5) | 2.28 (1.32–3.93) |
| Yes | 17/34 (50.0) | 1/4 (25.0) | 2.00 (.35–11.29) |
| Other | 0/11 (0.0) | 1/4 (25.0) | … |
| spa type 2 | |||
| 2 | 35/112 (31.3) | 0/11 (0.0) | … |
| Other | 50/161 (31.1) | 14/97 (14.4) | 2.15 (1.26–3.68) |
| pvl | |||
| No | 81/264 (30.7) | 7/69 (10.1) | 3.02 (1.46–6.25) |
| Yes | 4/9 (44.4) | 7/39 (17.9) | 2.48 (.92–6.68) |
| Phenotypic characteristic | |||
| agr functionalityb | |||
| 0 | 13/61 (21.3) | 0/0 (NA) | … |
| 1 | 26/68 (38.2) | 1/4 (25.0) | 1.53 (.27–8.58) |
| 2 | 46/144 (31.9) | 13/104 (12.5) | 2.56 (1.46–4.48) |
| 0, 1 | 39/129 (30.2) | 1/4 (25.0) | 1.21 (.22–6.74) |
| 1, 2 | 72/212 (34.0) | 14/108 (13.0) | 2.62 (1.55–4.42) |
| Vancomycin susceptibility | |||
| Heteroresistant | 16/56 (28.6) | 0/4 (0.0) | … |
| Susceptible | 69/217 (31.8) | 14/104 (13.5) | 2.36 (1.40–3.99) |
| Vancomycin MIC, μg/mL | |||
| By the Etest | |||
| ≤1 | |||
| Yes | 7/32 (21.9) | 0/12 (0.0) | … |
| No | 78/241 (32.4) | 14/96 (14.6) | 2.22 (1.32–3.72) |
| ≤1.5 | |||
| Yes | 63/174 (36.2) | 10/86 (11.6) | 3.11 (1.68–5.76) |
| No | 22/99 (22.2) | 4/22 (18.2) | 1.22 (.47–3.19) |
| By an automated method | |||
| 0.5 | 1/14 (7.1) | 0/15 (0.0) | … |
| 1 | 75/231 (32.5) | 12/87 (13.8) | 2.35 (1.35–4.11) |
| ≥2 | 9/27 (33.3) | 2/6 (33.3) | 1.00 (.29–3.49) |
| Linezolid MIC, by the Etest | |||
| 1 | 4/14 (28.6) | 2/9 (22.2) | 1.29 (.29–5.63) |
| 2 | 62/188 (33.0) | 9/80 (11.3) | 2.93 (1.53–5.61) |
| 4 | 19/70 (27.1) | 3/16 (18.8) | 1.45 (.49–4.30) |
| Demographic/clinical characteristic | |||
| Age, y | |||
| ≤65 | 26/128 (20.3) | 5/62 (8.1) | 2.52 (1.02–6.24) |
| >65 | 59/145 (40.7) | 9/46 (19.6) | 2.08 (1.12–3.86) |
| Sex | |||
| Female | 36/106 (34.0) | 4/32 (12.5) | 2.72 (1.05–7.06) |
| Male | 49/167 (29.3) | 10/76 (13.2) | 2.23 (1.20–4.16) |
| Race | |||
| Asian | 10/48 (20.8) | 1/11 (9.1) | 2.29 (.33–16.08) |
| Black | 9/26 (34.6) | 3/21 (14.3) | 2.42 (.75–7.83) |
| White | |||
| No | 22/89 (24.7) | 4/33 (12.1) | 2.04 (.76–5.48) |
| Yes | 63/184 (34.2) | 10/75 (13.3) | 2.57 (1.39–4.73) |
| Other | 3/15 (20.0) | 0/1 (0.0) | … |
| Region | |||
| Asia | 9/43 (20.9) | 1/8 (12.5) | 1.67 (.24–11.46) |
| Europe | 3/17 (17.6) | 2/19 (10.5) | 1.68 (.32–8.86) |
| Latin America | 16/31 (51.6) | 1/5 (20.0) | 2.58 (.43–15.39) |
| Other | 5/10 (50.0) | 1/7 (14.3) | 3.50 (.51–23.81) |
| United States | |||
| Yes | 52/172 (30.2) | 9/69 (13.0) | 2.32 (1.21–4.44) |
| No | 33/101 (32.7) | 5/39 (12.8) | 2.55 (1.07–6.05) |
| Treatment | |||
| Linezolid | 44/136 (32.4) | 8/53 (15.1) | 2.14 (1.08–4.24) |
| Vancomycin | 41/137 (29.9) | 6/55 (10.9) | 2.74 (1.24–6.09) |
| APACHE score | |||
| ≤20 | 42/186 (22.6) | 6/74 (8.1) | 2.78 (1.24–6.27) |
| >20 | 42/85 (49.4) | 8/31 (25.8) | 1.91 (1.02–3.61) |
| Missing | 1/2 (50.0) | 0/3 (0.0) | |
| ICU stay at baseline | |||
| No | 9/36 (25.0) | 1/13 (7.7) | 3.25 (.45–23.22) |
| Yes | 76/237 (32.1) | 13/95 (13.7) | 2.34 (1.37–4.01) |
| Vasopressor therapy at baseline | |||
| No | 64/228 (28.1) | 9/89 (10.1) | 2.78 (1.44–5.33) |
| Yes | 21/45 (46.7) | 5/19 (26.3) | 1.77 (.79–4.00) |
| Corticosteriod therapy at baseline | |||
| No | 61/210 (29.0) | 10/89 (11.2) | 2.59 (1.39–4.81) |
| Yes | 24/63 (38.1) | 4/19 (21.1) | 1.81 (.72–4.57) |
| Bacteremia | |||
| No | 68/237 (28.7) | 11/93 (11.8) | 2.43 (1.34–4.38) |
| Yes | 17/36 (47.2) | 3/15 (20.0) | 2.36 (.81–6.88) |
| Chest radiography finding | |||
| Bilateral | 64/190 (33.7) | 11/69 (15.9) | 2.11 (1.19–3.76) |
| Unilateral | 21/83 (25.3) | 3/38 (7.9) | 3.20 (1.02–10.09) |
| Missing | 0/0 (NA) | 0/1 (0.0) | |
| Pleural effusion | |||
| No | 48/140 (34.3) | 9/70 (12.9) | 2.67 (1.39–5.12) |
| Yes | 37/133 (27.8) | 5/38 (13.2) | 2.11 (.89–5.00) |
| Pneumonia, by type | |||
| Hospital associated | 17/78 (21.8%) | 2/21 (9.5%) | 2.29 (.57–9.13) |
| Healthcare associated | 17/51 (33.3%) | 1/10 (10.0%) | 3.33 (.50–22.27) |
| Ventilator associated | 51/144 (35.4%) | 11/77 (14.3%) | 2.48 (1.37–4.47) |
| Ventilation at baseline | |||
| No | 20/83 (24.1) | 1/25 (4.0) | 6.02 (.85–42.68) |
| Yes | 65/190 (34.2) | 13/83 (15.7) | 2.18 (1.28–3.74) |
| Infecting pathogen(s) | |||
| MRSA + anaerobe | 0/2 (0.0) | 0/0 (NA) | … |
| MRSA + fungus | 5/10 (50.0) | 0/1 (0.0) | … |
| MRSA + gram negative | 20/66 (30.3) | 4/33 (12.1) | 2.50 (.93–6.72) |
| MRSA + gram positive | 6/21 (28.6) | 0/10 (0.0) | … |
| MRSA + gram positive + gram negative | 5/15 (33.3) | 1/5 (20.0) | 1.67 (.25–11.07) |
| MRSA only | 49/159 (30.8) | 9/59 (15.3) | 2.02 (1.06–3.85) |
| MRSA + other | 36/114 (31.6) | 5/49 (10.2) | 3.09 (1.29–7.41) |
| Anaerobic coverage at baseline | |||
| No | 35/125 (28.0) | 4/44 (9.1) | 3.08 (1.16–8.17) |
| Yes | 50/148 (33.8) | 10/64 (15.6) | 2.16 (1.17–3.99) |
| Gram-negative coverage at baseline | |||
| No | 1/4 (25.0) | 0/3 (0.0) | … |
| Yes | 84/269 (31.2) | 14/105 (13.3) | 2.34 (1.39–3.93) |
| Service | |||
| Medical | |||
| Yes | 55/162 (34.0) | 9/49 (18.4) | 1.85 (.99–3.46) |
| No | 30/111 (27.0) | 5/59 (8.5) | 3.19 (1.31–7.79) |
| Surgical | 20/68 (29.4) | 3/24 (12.5) | 2.35 (.77–7.22) |
| Trauma | 10/43 (23.3) | 2/35 (5.7) | 4.07 (.95–17.37) |
| Comorbidity | |||
| Cardiac | |||
| No | 23/98 (23.5) | 5/54 (9.3) | 2.53 (1.02–6.29) |
| Yes | 62/175 (35.4) | 9/54 (16.7) | 2.13 (1.13–3.99) |
| Diabetes | |||
| No | 41/152 (27.0) | 10/79 (12.7) | 2.13 (1.13–4.02) |
| Yes | 44/121 (36.4) | 4/29 (13.8) | 2.64 (1.03–6.75) |
| Neoplastic | |||
| No | 73/244 (29.9) | 10/96 (10.4) | 2.87 (1.55–5.32) |
| Yes | 12/29 (41.4) | 4/12 (33.3) | 1.24 (.50–3.08) |
| Renal/urinary | |||
| No | 37/149 (24.8) | 10/78 (12.8) | 1.94 (1.02–3.68) |
| Yes | 48/124 (38.7) | 4/30 (13.3) | 2.90 (1.14–7.42) |
| Pulmonary | |||
| No | 22/86 (25.6) | 5/34 (14.7) | 1.74 (.72–4.22) |
| Yes | 63/187 (33.7) | 9/74 (12.2) | 2.77 (1.45–5.28) |
| Hepatobiliary | |||
| No | 72/232 (31.0) | 9/95 (9.5) | 3.28 (1.71–6.28) |
| Yes | 13/41 (31.7) | 5/13 (38.5) | 0.82 (.36–1.87) |
| Gastrointestinal | |||
| No | 24/116 (20.7) | 5/47 (10.6) | 1.94 (.79–4.79) |
| Yes | 61/157 (38.9) | 9/61 (14.8) | 2.63 (1.40–4.97) |
| LTCF stay at baseline | |||
| No | 82/261 (31.4) | 13/104 (12.5) | 2.51 (1.47–4.31) |
| Yes | 3/12 (25.0) | 1/4 (25.0) | 1.00 (.14–7.10) |
Data associated with creatinine clearance and Clinical Pulmonary Infection Score are not shown.
Abbreviations: APACHE, Acute Physiology and Chronic Health Evaluation; CI, confidence interval; LTCF, long-term care facility; MIC, minimum inhibitory concentration; NA, not applicable; NT, not typable; RR, relative risk; SCCmec, staphylococcal cassette chromosome mec.
a Defined as a mean of ≥90% killing of PMN-HL60 cells within 2 hours.
b Semiquantitative scoring of δ-hemolysin on sheep blood agar: 0, nonhemoltyic; 1, weakly hemolytic; 2, strongly hemolytic.
The initial multivariate logistic regression analysis identified low cytotoxic activity and clonality as the only significant (and negative) bacterial predictors within the candidate predictor pool, which included all univariate predictor variables. Attenuated cytotoxic activity was more frequently observed in isolates from patients with comorbidities, such as cardiac and renal/urinary disease (Table 1). However, modeling data indicated that the importance of cytolysin for NP did not vary much by genotype, host comorbidity, or age. As noted above, there was a very clear correlation between low cytotoxicity and the presence of non-SCCmecIV type, which suggests that the relationship between cytotoxicity and mortality is based in part on a strain's association with the healthcare environment. However, when SCCmec and cytotoxic activity were entered into a multivariate logistic regression model, low cytotoxic activity appeared as a strong predictor of mortality, whereas SCCmec appeared as a weak predictor. These findings are consistent with several reports indicating that the presence of CA-MRSA and pvl per se do not confer a worse clinical course in all forms of infection caused by S. aureus [10–12, 40, 41]. Finally, analysis of treatment showed that the deleterious effect of low cytotoxic activity (reduced probability of survival) was seen in both patients treated with vancomycin and patients treated with linezolid (relative risk, 1.08 [95% confidence interval {CI}, .76–1.54]; Supplementary Table 2).
Overall mortality did not differ significantly among patients infected with CC8 strains and those infected with other strains. However, when mortality was adjusted for an overall high level of cytotoxic activity by using logistic regression, CC8 isolates were associated with increased mortality. Thus, differences in cytotoxic activity and genotype may both affect mortality, with one countering the other. The effect of genotype on mortality was also apparent for patients infected with CC8/239 isolates. A recent study suggested that the acquisition of a virulence factor, sasX, by ST239 (a major sequence type of CC239) resulted in enhanced virulence and an epidemiological outbreak in eastern China [29]. However, mortality distinctions between the sasX CC239–positive subgroup (n = 19) and the sasX CC239–negative subgroup (n = 19) were not observed in our population (OR, 1.71 [95% CI, .65–4.48]; P = .2728).
Previous studies have reported an association between reduced virulence, reduced vancomycin susceptibility, and outcomes [34]; the present work supports such an interaction between these 3 important variables. However, high vancomycin MIC and vancomycin heteroresistance were not risk factors for mortality or poor clinical outcome, even in patients treated with vancomycin.
Modeling of Clinical Cure
Mortality modeling suggests that invasive virulence is not key to outcome in nosocomial NP, unless there are alternate pathways that selectively activate cytolysin genes in vivo. However, it is possible that cytotoxic activity correlates directly with clinical outcome from pneumonia and that the onset of its action is too rapid to be measured by mortality at the end of study. We therefore studied clinical outcomes at end of treatment and the end of the study (Supplementary Table 3). In contrast to mortality, cytotoxic activity was not associated with clinical cure at any time point. Consistent with this observation, cytotoxicity was not associated with severity of illness score (APACHE II or Clinical Pulmonary Infection Score), bacteremia, or vasopressor use (Table 1). However, the association of a cytotoxin, PVL, with a particular CA-MRSA strain predominant in the United States (USA300) correlated with poor outcomes at the end of treatment (OR, 0.34 [95% CI, .17–.69]; P = 0.0025) and at the end of the study (OR, 0.37 [95% CI, .15–.92]; P = .0318). Additionally, CC8/239 and SCCmecIV were significantly associated with poor outcome at the end of the study. Thus, both virulence profiles and the genetic background provide discriminatory power for outcomes of MRSA NP. Finally, as in the parent study, treatment with linezolid was associated with improved outcome at the end of treatment (OR, 1.85 [95% CI, 1.10–3.12]; P = .02; Supplementary Table 3).
DISCUSSION
The results show that crude mortality rates for adequately treated patients with MRSA NP due to strains of low cytotoxic activity was 4-fold higher than that for patients infected with strains of high virulence, even after multivariate logistic regression analysis with careful adjustment for bacterial and host factors. The high prevalence of strains with low cytotoxic activity and their association with HA-MRSA and mortality suggests that these strains are, paradoxically, more virulent than other strains, at least under some circumstances. Elevated mortality may be due to the presence of unmeasured cytolysins or other factors. An alternative but nonmutually exclusive hypothesis is that cytolysins act as positive virulence factors but also enhance or trigger activation of the immune system [42–44].
Although it is not possible to state definitively that enhanced virulence does not play a role in mortality associated with strains having repressed cytotoxic activity, 3 observations suggest that such strains are actually less virulent. First, in contrast to mortality, low cytotoxic activity did not modify the effect of MRSA NP on clinical outcome. The treatment effect for an end point such as clinical failure should be larger than that seen with a mortality end point. Second, MRSA strains of hospital origin were significantly less cytotoxic than strains of community origin, and such strains are generally less virulent than those of community clades in most animal models of infection [45–47]. Finally, substantial differences in clinical characteristics (eg, age and comorbidities) were observed between the group with low cytolysin levels and the group with high cytolysin levels. These data suggest that infections due to the former occur in sicker patients. Collectively, these observations suggest that the discrepancies in clinical outcome and survival of low virulence strains stem from confounding factors related to differences in populations of patients infected with highly cytotoxic and weakly cytotoxic MRSA. In this scenario, cytotoxic activity is a proxy for a subtle factor that makes hospitalized patients more susceptible to infection with bacteria of low virulence. We call that factor “host quality.”
In contrast to results for cytotoxic activity, both mortality and poor clinical cure were concentrated within CC8/239, a weakly cytotoxic lineage. One potential explanation for the observed link between outcome and phylogeny is the importance of compatibility between genomes and virulence genes for the emergence of a virulent clone. For example, in the case of CC 8/239, compensatory mutations that help maintain virulence not measured by cytotoxic activity may have appeared in this lineage, which initially may not have been particularly adaptive for its repertoire of virulence genes. Indeed, CC 8/239 is a hybrid clone [48] resulting from the integration of a genomic fragment from CC30, which is associated with invasive infection and poor outcome [49], into a CC8 parent strain. Thus, integration of CC30 genes may have been an evolutionary route to a hypervirulence that kills patients at high frequency.
The present work has several limitations. First, correlations between bacterial factors and outcome may reflect factors we did not account for, such as duration of stay or mechanical ventilation before diagnosis of NP. Second, our data are limited to NP; whether cytotoxic patterns predict outcome in different syndromes will need to be tested. Third, the diagnosis of pneumonia was based on clinical criteria despite the fact that lower respiratory tract specimens were collected for culture from all patients before antibiotic therapy. Using clinical criteria for the diagnosis of NP may lead to overdiagnosis, potentially increasing the rate of overall disease detected and the proportion of low virulence strains that may be linked to mortality. Finally, the diagnosis was based on analysis of respiratory samples, including sputum and tracheal aspirates; the use of samples other than bronchoalveolar lavage to characterize the etiology of pneumonia may also have resulted in inclusion of patients colonized but not infected with MRSA.
In conclusion, we identified low cytotoxic activity as a predictor of mortality in MRSA NP, but deeper investigation revealed it to be a marker of the host. Although it may not be possible to identify what information is embedded in cytotoxic activity and exactly why it is associated with mortality, the results provide a framework with which to further explore the relationship between strain variation in MRSA and clinical outcomes. The issue is that patients who are infected with low virulence MRSA are inherently different from those infected with virulent MRSA and, in turn, that both the natural history of disease and treatment effects between some drugs may be different in these patients. Thus, if additional studies substantiate these results, future outcome studies should be designed so that this factor is assessed and evenly balanced between study groups.
Supplementary Data
Supplementary materials are available at The Journal of Infectious Diseases online (http://jid.oxfordjournals.org). Supplementary materials consist of data provided by the author that are published to benefit the reader. The posted materials are not copyedited. The contents of all supplementary data are the sole responsibility of the authors. Questions or messages regarding errors should be addressed to the author.
Notes
Acknowledgments. We thank Karl Drlica, for critical comments on the manuscript, Cynthia Portal and Sean Cloonan, for manuscript preparation and Angelina Labella, for technical assistance.
Financial support. This work was supported by Pfizer and the National Institutes of Health (R01-AI103268 to B. S. and V. J. T; T32-AI7647 to D. R. A.).
Potential conflicts of interest. H. R., R. S. H., D. S. S., J. M. K., V. J. T., and B. S. are employees of the NYU School of Medicine, which received financial support from Pfizer in connection with the development of the manuscript. G. A. W. is a former employee of the NYU School of Medicine. M. W. is an employee of Pfizer. R. E. M. is an employee of JMI Laboratories, a consultant for Pfizer. D. R. A. certifies no potential conflicts.
All authors have submitted the ICMJE Form for Disclosure of Potential Conflicts of Interest. Conflicts that the editors consider relevant to the content of the manuscript have been disclosed.
References
- 1.Gonzalez C, Rubio M, Romero-Vivas J, Gonzalez M, Picazo JJ. Bacteremic pneumonia due to Staphylococcus aureus: A comparison of disease caused by methicillin-resistant and methicillin-susceptible organisms. Clin Infect Dis 1999; 29:1171–7. [DOI] [PubMed] [Google Scholar]
- 2.Rello J, Torres A, Ricart M, et al. Ventilator-associated pneumonia by Staphylococcus aureus. Comparison of methicillin-resistant and methicillin-sensitive episodes. Am J Respir Crit Care Med 1994; 150:1545–9. [DOI] [PubMed] [Google Scholar]
- 3.Rubinstein E, Kollef MH, Nathwani D. Pneumonia caused by methicillin-resistant Staphylococcus aureus. Clin Infect Dis 2008; 46(suppl 5):S378–85. [DOI] [PubMed] [Google Scholar]
- 4.Francis JS, Doherty MC, Lopatin U, et al. Severe community-onset pneumonia in healthy adults caused by methicillin-resistant Staphylococcus aureus carrying the Panton-Valentine leukocidin genes. Clin Infect Dis 2005; 40:100–7. [DOI] [PubMed] [Google Scholar]
- 5.Gonzalez BE, Hulten KG, Dishop MK, et al. Pulmonary manifestations in children with invasive community-acquired Staphylococcus aureus infection. Clin Infect Dis 2005; 41:583–90. [DOI] [PubMed] [Google Scholar]
- 6.Hageman JC, Uyeki TM, Francis JS, et al. Severe community-acquired pneumonia due to Staphylococcus aureus, 2003–04 influenza season. Emerg Infect Dis 2006; 12:894–9. [DOI] [PMC free article] [PubMed] [Google Scholar]
- 7.Naimi TS, LeDell KH, Como-Sabetti K, et al. Comparison of community- and health care-associated methicillin-resistant Staphylococcus aureus infection. JAMA 2003; 290:2976–84. [DOI] [PubMed] [Google Scholar]
- 8.Seybold U, Kourbatova EV, Johnson JG, et al. Emergence of community-associated methicillin-resistant Staphylococcus aureus USA300 genotype as a major cause of health care-associated blood stream infections. Clin Infect Dis 2006; 42:647–56. [DOI] [PubMed] [Google Scholar]
- 9.Popovich KJ, Weinstein RA, Hota B. Are community-associated methicillin-resistant Staphylococcus aureus (MRSA) strains replacing traditional nosocomial MRSA strains? Clin Infect Dis 2008; 46:787–94. [DOI] [PubMed] [Google Scholar]
- 10.Chen SY, Liao CH, Wang JL, et al. Methicillin-resistant Staphylococcus aureus (MRSA) staphylococcal cassette chromosome mec genotype effects outcomes of patients with healthcare-associated MRSA bacteremia independently of vancomycin minimum inhibitory concentration. Clin Infect Dis 2012; 55:1329–37. [DOI] [PubMed] [Google Scholar]
- 11.Lalani T, Federspiel JJ, Boucher HW, et al. Associations between the genotypes of Staphylococcus aureus bloodstream isolates and clinical characteristics and outcomes of bacteremic patients. J Clin Microbiol 2008; 46:2890–6. [DOI] [PMC free article] [PubMed] [Google Scholar]
- 12.Sharma-Kuinkel BK, Ahn SH, Rude TH, et al. Presence of genes encoding Panton-Valentine leukocidin is not the primary determinant of outcome in patients with hospital-acquired pneumonia due to Staphylococcus aureus. J Clin Microbiol 2012; 50:848–56. [DOI] [PMC free article] [PubMed] [Google Scholar]
- 13.Chastre J, Trouillet JL, Vuagnat A, et al. Nosocomial pneumonia in patients with acute respiratory distress syndrome. Am J Respir Crit Care Med 1998; 157:1165–72. [DOI] [PubMed] [Google Scholar]
- 14.Luna CM, Niederman MS. What is the natural history of resolution of nosocomial pneumonia? Semin Respir Crit Care Med 2002; 23:471–9. [DOI] [PubMed] [Google Scholar]
- 15.Torres A, Aznar R, Gatell JM, et al. Incidence, risk, and prognosis factors of nosocomial pneumonia in mechanically ventilated patients. Am Rev of Respir Dis 1990; 142:523–8. [DOI] [PubMed] [Google Scholar]
- 16.Bregeon F, Ciais V, Carret V, et al. Is ventilator-associated pneumonia an independent risk factor for death? Anesthesiology 2001; 94:554–60. [DOI] [PubMed] [Google Scholar]
- 17.Papazian L, Bregeon F, Thirion X, et al. Effect of ventilator-associated pneumonia on mortality and morbidity. Am J Respir Crit Care Med 1996; 154:91–7. [DOI] [PubMed] [Google Scholar]
- 18.Wunderink RG, Niederman MS, Kollef MH, et al. Linezolid in methicillin-resistant Staphylococcus aureus nosocomial pneumonia: a randomized, controlled study. Clin Infect Dis 2012; 54:621–9. [DOI] [PubMed] [Google Scholar]
- 19.Mendes RE, Deshpande LM, Smyth DS, Shopsin B, Farrell DJ, Jones RN. Characterization of methicillin-resistant Staphylococcus aureus strains recovered from a phase IV clinical trial for linezolid versus vancomycin for the treatment of nosocomial pneumonia. J Clin Microbiol 2012; 50:3694–702. [DOI] [PMC free article] [PubMed] [Google Scholar]
- 20.Smyth DS, Kafer JM, Wasserman GA, et al. Nasal Carriage as a Source of agr-Defective Staphylococcus aureus Bacteremia. J Infect Dis 2012; 206:1168–77. [DOI] [PMC free article] [PubMed] [Google Scholar]
- 21.Cheung GY, Duong AC, Otto M. Direct and synergistic hemolysis caused by Staphylococcus phenol-soluble modulins: implications for diagnosis and pathogenesis. Microbes Infect 2012; 14:380–6. [DOI] [PMC free article] [PubMed] [Google Scholar]
- 22.Elek SD, Levy E. Distribution of haemolysins in pathogenic and non-pathogenic staphylococci. J Pathol Bacteriol 1950; 62:541–54. [DOI] [PubMed] [Google Scholar]
- 23.Shopsin B, Eaton C, Wasserman GA, et al. Mutations in agr do not persist in natural populations of methicillin-resistant Staphylococcus aureus. J Infect Dis 2010; 202:1593–9. [DOI] [PubMed] [Google Scholar]
- 24.Traber KE, Lee E, Benson S, et al. agr function in clinical Staphylococcus aureus isolates. Microbiology 2008; 154:2265–74. [DOI] [PMC free article] [PubMed] [Google Scholar]
- 25.Vuong C, Kocianova S, Yao Y, Carmody AB, Otto M. Increased colonization of indwelling medical devices by quorum-sensing mutants of Staphylococcus epidermidis in vivo. J Infect Dis 2004; 190:1498–505. [DOI] [PubMed] [Google Scholar]
- 26.DuMont AL, Yoong P, Day CJ, et al. Staphylococcus aureus LukAB cytotoxin kills human neutrophils by targeting the CD11b subunit of the integrin Mac-1. Proc Natl Acad Sci U S A 2013; 110:10794–9. [DOI] [PMC free article] [PubMed] [Google Scholar]
- 27.Dumont AL, Nygaard TK, Watkins RL, et al. Characterization of a new cytotoxin that contributes to Staphylococcus aureus pathogenesis. Mol Microbiol 2011; 79:814–25. [DOI] [PMC free article] [PubMed] [Google Scholar]
- 28.Morinaga N, Nagamori M, Kato I. Changes in binding of staphylococcal leukocidin to HL-60 cells during differentiation induced by dimethyl sulfoxide. Infect Immun 1988; 56:2479–83. [DOI] [PMC free article] [PubMed] [Google Scholar]
- 29.Li M, Du X, Villaruz AE, et al. MRSA epidemic linked to a quickly spreading colonization and virulence determinant. Nat Med 2012; 18:816–9. [DOI] [PMC free article] [PubMed] [Google Scholar]
- 30.Novick RP. Autoinduction and signal transduction in the regulation of staphylococcal virulence. Mol Microbiol 2003; 48:1429–49. [DOI] [PubMed] [Google Scholar]
- 31.Alonzo F, III, Torres VJ. Bacterial survival amidst an immune onslaught: the contribution of the Staphylococcus aureus leukotoxins. PLoS Pathog 2013; 9:e1003143. [DOI] [PMC free article] [PubMed] [Google Scholar]
- 32.Vandenesch F, Lina G, Henry T. Staphylococcus aureus hemolysins, bi-component leukocidins, and cytolytic peptides: a redundant arsenal of membrane-damaging virulence factors? Front Cell Infect Microbiol 2012; 2:12. [DOI] [PMC free article] [PubMed] [Google Scholar]
- 33.Cheung GY, Joo HS, Chatterjee SS, Otto M. Phenol-soluble modulins - critical determinants of staphylococcal virulence. FEMS Microbiol Rev 2014; 38:698–719. [DOI] [PMC free article] [PubMed] [Google Scholar]
- 34.van Hal SJ, Fowler VG., Jr Is it time to replace vancomycin in the treatment of methicillin-resistant Staphylococcus aureus infections? Clin Infect Dis 2013; 56:1779–88. [DOI] [PMC free article] [PubMed] [Google Scholar]
- 35.Sakoulas G. The accessory gene regulator (agr) in methicillin-resistant Staphylococcus aureus: role in virulence and reduced susceptibility to glycopeptide antibiotics. Drug Discov Today 2006; 3:287–94. [Google Scholar]
- 36.Sakoulas G, Eliopoulos GM, Moellering RC, Jr, et al. Accessory gene regulator (agr) locus in geographically diverse Staphylococcus aureus isolates with reduced susceptibility to vancomycin. Antimicrob Agents Chemother 2002; 46:1492–502. [DOI] [PMC free article] [PubMed] [Google Scholar]
- 37.Cameron DR, Ward DV, Kostoulias X, et al. Serine/threonine phosphatase Stp1 contributes to reduced susceptibility to vancomycin and virulence in Staphylococcus aureus. J Infect Dis 2012; 205:1677–87. [DOI] [PMC free article] [PubMed] [Google Scholar]
- 38.Peleg AY, Monga D, Pillai S, Mylonakis E, Moellering RC, Jr, Eliopoulos GM. Reduced susceptibility to vancomycin influences pathogenicity in Staphylococcus aureus infection. J Infect Dis 2009; 199:532–6. [DOI] [PMC free article] [PubMed] [Google Scholar]
- 39.DeLeo FR, Otto M, Kreiswirth BN, Chambers HF. Community-associated meticillin-resistant Staphylococcus aureus. Lancet 2010; 375:1557–68. [DOI] [PMC free article] [PubMed] [Google Scholar]
- 40.Bae IG, Tonthat GT, Stryjewski ME, et al. Presence of genes encoding the panton-valentine leukocidin exotoxin is not the primary determinant of outcome in patients with complicated skin and skin structure infections due to methicillin-resistant Staphylococcus aureus: results of a multinational trial. J Clin Microbiol 2009; 47:3952–7. [DOI] [PMC free article] [PubMed] [Google Scholar]
- 41.Peyrani P, Allen M, Seligson D, et al. Clinical outcomes of osteomyelitis patients infected with methicillin-resistant Staphylococcus aureus USA-300 strains. Am J Orthop (Belle Mead NJ) 2012; 41:117–22. [PubMed] [Google Scholar]
- 42.Malachowa N, Kobayashi SD, Braughton KR, et al. Staphylococcus aureus leukotoxin GH promotes inflammation. J Infect Dis 2012; 206:1185–93. [DOI] [PMC free article] [PubMed] [Google Scholar]
- 43.Malachowa N, Kobayashi SD, Freedman B, Dorward DW, DeLeo FR. Staphylococcus aureus leukotoxin GH promotes formation of neutrophil extracellular traps. J Immunol 2013; 191:6022–9. [DOI] [PMC free article] [PubMed] [Google Scholar]
- 44.Yoong P, Pier GB. Immune-activating properties of Panton-Valentine leukocidin improve the outcome in a model of methicillin-resistant Staphylococcus aureus pneumonia. Infect Immun 2012; 80:2894–904. [DOI] [PMC free article] [PubMed] [Google Scholar]
- 45.Li M, Cheung GY, Hu J, et al. Comparative analysis of virulence and toxin expression of global community-associated methicillin-resistant Staphylococcus aureus strains. J Infect Dis 2010; 202:1866–76. [DOI] [PMC free article] [PubMed] [Google Scholar]
- 46.Voyich JM, Braughton KR, Sturdevant DE, et al. Insights into mechanisms used by Staphylococcus aureus to avoid destruction by human neutrophils. J Immunol 2005; 175:3907–19. [DOI] [PubMed] [Google Scholar]
- 47.Wang R, Braughton KR, Kretschmer D, et al. Identification of novel cytolytic peptides as key virulence determinants for community-associated MRSA. Nat Med 2007; 13:1510–4. [DOI] [PubMed] [Google Scholar]
- 48.Robinson DA, Enright MC. Evolution of Staphylococcus aureus by large chromosomal replacements. J Bacteriol 2004; 186:1060–4. [DOI] [PMC free article] [PubMed] [Google Scholar]
- 49.Fowler VG, Jr, Nelson CL, McIntyre LM, et al. Potential associations between hematogenous complications and bacterial genotype in Staphylococcus aureus infection. J Infect Dis 2007; 196:738–47. [DOI] [PubMed] [Google Scholar]
Associated Data
This section collects any data citations, data availability statements, or supplementary materials included in this article.