

Abstract
Background
Although many studies have documented the dramatic declines in heart disease mortality in the United States at the national level, little attention has been given to the temporal changes in the geographic patterns of heart disease mortality.
Methods and Results
Age-adjusted and spatially smoothed county-level heart disease death rates were calculated for 2-year intervals from 1973 to 1974 to 2009 to 2010 for those aged ≥35 years. Heart disease deaths were defined according to the International Classification of Diseases codes for diseases of the heart in the eighth, ninth, and tenth revisions of the International Classification of Diseases. A fully Bayesian spatiotemporal model was used to produce precise rate estimates, even in counties with small populations. A substantial shift in the concentration of high-rate counties from the Northeast to the Deep South was observed, along with a concentration of slow-decline counties in the South and a nearly 2-fold increase in the geographic inequality among counties.
Conclusions
The dramatic change in the geographic patterns of heart disease mortality during 40 years highlights the importance of small-area surveillance to reveal patterns that are hidden at the national level, gives communities the historical context for understanding their current burden of heart disease, and provides important clues for understanding the determinants of the geographic disparities in heart disease mortality.
Keywords: epidemiology, heart diseases, mapping, mortality
Surveillance studies of heart disease mortality in the United States have documented important temporal trends by race, sex, and age group during the past 4 decades.1–3 Little attention, however, has been given to temporal changes in the geographic patterns of heart disease mortality during this time period. The earliest published map, depicting heart disease death rates by state during the early 1950s, documents geographic disparities with the highest rates located primarily in the Northeast.4 Subsequent studies that use a variety of geographic units (eg, county, state economic area, health service area, state) have documented geographic disparities in the rates and the rates of decline in heart disease mortality at various times,4–13 but no studies have systematically monitored changes in the pattern of geographic disparities in heart disease mortality among US communities during this extended time period. Small-area surveillance of heart disease mortality is important because it can reveal patterns that are masked at the national level, give communities the historical context for understanding their current burden of heart disease, and inform the development of hypotheses regarding the geographic disparities in heart disease mortality.
The ability to generate statistically stable rates for geographic units with small populations has been a challenge to small-area surveillance of heart disease mortality. Relatively recent developments in statistical methodologies, in particular, the application of Bayesian techniques,14 have enhanced the ability to produce statistically rigorous and stable heart disease mortality estimates at the local level. In this study, we use a spatiotemporal Bayesian model to examine the geographic patterns of heart disease mortality among US counties from 1973 to 2010. A similar model was used by Quick and colleagues15 in an analysis of asthma hospitalization rates in California counties. We document 3 dimensions of the spatiotemporal trends in county-level heart disease mortality in the United States: (1) changing geographic patterns of heart disease mortality over time; (2) geographic variation in rates of declining heart disease mortality; and (3) changing magnitude of disparity in heart disease mortality among counties.
Methods
Data Sources
The study population includes all residents of the contiguous United States aged ≥35 years. Annual numbers of heart disease deaths per county were obtained from the National Vital Statistics System of the National Center for Health Statistics. We analyzed data from 1973 to 2010, because this period ensures complete rather than sampled death records. Deaths from heart disease were defined as those for which the underlying cause of death was diseases of the heart according to the of the International Classification of Diseases, Eighth, Ninth, and Tenth Revision (ICD-8, ICD-9, and ICD-10; ICD-8 [1973–1978]: 390–398, 402, 404, 410–429; ICD-9 [1979–1998]: 390–398, 402, 404, 410–429; ICD-10 [1999–present]: I00–I09, I11, I13, I20–I51).16,17 The comparability ratios between each ICD revision are very close to unity for diseases of the heart; therefore, no adjustments for ICD coding changes were necessary (ie, comparability ratios=1.0126 and 0.9858 for ICD-8–9 and ICD-9–10, respectively).16,17 Annual population counts were obtained from the bridged-race files produced by the US Census Bureau and National Center for Health Statistics.18 Heart disease death rates per 100 000 were calculated and directly age-standardized to the 2000 US Standard Population by using 10-year age groups.19
Calculating Heart Disease Death Rates and Percentage Change
The county is the unit of analysis. Given changes in some county definitions during the study period, a single set of 3099 counties from the contiguous 48 states was used for the entire study period. To enhance statistical stability, we aggregated county-level, age-standardized counts, and populations into 2-year intervals (eg, from 1973–1974 to 2009–2010).
To further improve the statistical stability of estimated heart disease death rates, we used a fully Bayesian spatiotemporal model to estimate age-standardized, county-level heart disease death rates. By borrowing strength across both space and time, Bayesian models can produce precise rate estimates, even in areas with sparse populations. Our model, which accounts for temporal correlation of rates within a given county and spatial correlation of rates across adjacent counties, estimates heart disease death rates as a function of spatiotemporally evolving model parameters (see online-only Data Supplement). Because Bayesian models output posterior distributions for each model parameter, we were able to calculate the posterior distribution for the expected heart disease death rate for each county at each 2-year interval. From these posterior distributions, we then obtained the posterior median (ie, the frequentist point estimate) and the 95% Bayesian credible interval (the Bayesian analog of a classical 95% confidence interval) for each county and each 2-year interval. Details about our model, including the specification of prior distributions and details for its implementation in a Markov chain Monte Carlo algorithm, are provided in the online-only Data Supplement.
To quantify county-specific temporal changes in heart disease death rates for the entire study period, we also used the posterior distributions of the parameter estimates to calculate percentage decline from 1973 to 2010. County-level percentage declines were considered statistically significant if the 95% Bayesian credible interval for percentage decline excluded zero.
Quantifying Geographic Disparities in Heart Disease Death Rates
To assess statistically significant spatial disparities among counties, we generated local indicators of spatial association (LISA) statistics for county rates within each time interval and for county percentage declines for the entire study period.20 As a local correlate of the Moran I, the LISA statistics indicate the degree to which counties with higher (or lower) than expected death rates tend to cluster with neighboring counties that also have higher (lower) than expected death rates. Thus, the LISA statistics highlight patterns of local and regional spatial clustering in the heart disease death rates, with statistically significant clustering being identified by counties whose 95% Bayesian credible interval for the LISA statistic excludes 0. For ease of visualizing spatial patterns, we present maps of both the modeled heart disease death rates and the LISA statistics for the beginning and end of the study period (Figures 1 and 2). Finally, we measured temporal change in relative geographic inequality in heart disease mortality among counties by using the coefficient of variation (CoV).21 We calculated the CoV because it uses the full distribution of county-specific rates to measure the amount of geographic inequality rather than relying on the tails of the distribution for calculating a disparity ratio. The CoV is defined as the standard deviation of county-level heart disease death rates for each 2-year time interval divided by the mean rate for the respective time period. A large CoV indicates more inequality in the rates among counties. We then assessed the temporal change (measured as percent change) in the CoV for the entire study period.
Figure 1.

Age-standardized heart disease death rates, ages ≥35, by county and quintile ranking for the beginning (1973–1974, A) and end (2009–2010, B) of the study period.
Figure 2.

Clusters of county-level age-standardized heart disease death rates, ages ≥35 for the beginning (1973–1974, A) and end (2009–2010, B) of the study period.
The Bayesian statistical model used in this analysis to generate the county rates and the LISA statistics was implemented using R statistical software, the maps were created using ESRI ArcMap software (version 10.1), and data management was performed using SAS.22–24 Details for computing all the summary statistics can be found in the online-only Data Supplement.
Results
At the beginning of the study period (1973–1974), the largest concentration of high-rate counties (defined as counties in the top quintile) formed an arc stretching from the Northeast through much of Appalachia and into the Midwest (Figure 1A). High-rate counties were also concentrated along the coastal areas of North Carolina, South Carolina, and Georgia. An East-West gradient was apparent with nearly all top-quintile counties located in the eastern half of the country and the majority of bottom-quintile counties in the western half. However, small groups of low-rate counties were also observed in Alabama, Florida, and parts of Mississippi. By the end of the study period in 2009 to 2010, the strong concentration of high-rate counties in the Northeast had dissipated, and a large concentration of high-rate counties emerged in the South and southern Appalachia (Figure 1B). The East-West gradient was still largely intact with low-rate counties found primarily in the West. The declines in heart disease death rates that occurred during the study period are reflected in the lower quintile cut points in 2009/2010 in comparison with 1973/1974.
LISA maps depicting statistically significant spatial clusters of high- and low-rate counties further reveal the shift of the high-rate counties from the Northeast to the South (Figure 2). Whereas most of the high-rate clusters were in the Northeast and Midwest at the beginning of the study period, by 2009 to 2010, the vast majority of high-rate clusters were south of the Mason-Dixon line. Geographic changes in the low-rate clusters also occurred, with the disappearance of many low-rate clusters from Texas and New Mexico and the appearance of low-rate clusters in New England. Low-rate clusters in Florida and parts of the Pacific Northwest were maintained during the study period.
Video animation of temporal changes in the geographic pattern of heart disease mortality for each of the 19 2-year periods in this study demonstrates the progression of high-rate counties from the Northeast to the South, and is available in Figure I in the online-only Data Supplement.
Temporal changes in the percentage of all counties that were in the highest quintile by US Census region also demonstrate the transition of high-rate counties from the Northeast to the South (Figure 3). Although the percentage of high-quintile counties located in the North dropped dramatically from 48% at the beginning of the study to 4% by the end, and a similar trend was observed in the Midwest (from 17% to 6%), the opposite trend was observed in the South—the percentage of high-quintile counties increased from 24% to 38%.
Figure 3.

Percentage of counties in the top quintile of heart disease mortality by region for the beginning (1973–1974), middle (1991–1992), and end (2009–2010) of the study period.
Substantial geographic variation in declining heart disease death rates was observed during the study period, with percentage declines ranging from 9.2% to 83.4% among US counties (Figure 4). Counties in the quintile with the slowest declines (9.2%–49.6%) were concentrated primarily in the southern states of Alabama, Mississippi, Louisiana, Arkansas, Oklahoma, and parts of Texas. Counties in the quintile with the fastest declines (64.1%–83.4%) were located largely in the northern half of the country with the exception of fast declines among counties in Florida and South Carolina. The average percentage decline for the United States was 61.6%. The LISA map of declining heart disease death rates depicts a large southern concentration of counties with slow declines and a prominent concentration of fast declines in the Northeast (Figure 5).
Figure 4.

Percentage decline in age-standardized heart disease death rates, ages ≥35, by county, from 1973–1974 to 2009–2010.
Figure 5.

Clusters of county-level declines in age-standardized heart disease death rates, ages ≥35 from the beginning (1973–1974) to the end (2009–2010) of the study period.
The magnitude of relative geographic disparity in heart disease death rates among counties, as measured by the coefficient of variation, increased briefly during the late 1970s and then rose steadily from 1985 to 2010 (Figure 6). The coefficient of variation increased by an average of 3.62% each year, and the magnitude of geographic inequality doubled from the beginning to the end of the study period.
Figure 6.
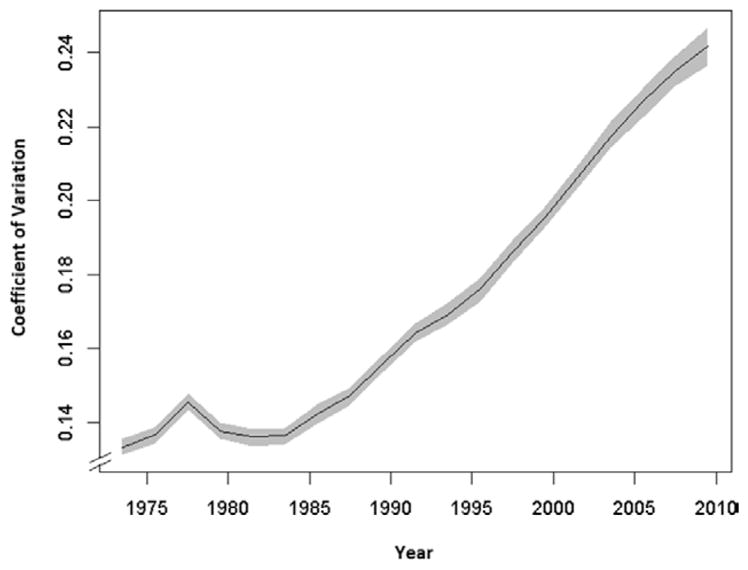
Temporal trend of the coefficient of variation (CoV) for age-standardized county-level heart disease death rates, United States, from 1973–1974 to 2009–2010. Larger CoV indicates greater geographic disparity in heart disease death rates among counties.
Discussion
This spatiotemporal study of heart disease mortality in the United States (1973–2010) documents a substantial shift in the concentration of high-rate counties from the Northeast to the South. The shift was accompanied by geographic disparities in the rates of declining heart disease mortality (with the slowest declines concentrated primarily among southern counties), and a 2-fold increase in the magnitude of geographic disparities among US counties. These observations highlight the importance and power of studies of small-area surveillance data to identify patterns that are masked at the national level, generate hypotheses regarding determinants of the changing geographic patterns, and provide information that can be used to tailor heart disease prevention programs and policies to communities with the greatest burden.
Previous studies provide snapshots of geographic disparities in heart disease mortality at various points in time using a variety of geographic units, age groups, and definitions of heart disease.4,6–10 The one consistent pattern is the East-West gradient, with higher rates concentrated in the East and lower rates in the West. Only one other study that we are aware of compared the patterns of geographic disparities in heart disease mortality over time.10 Similar to our findings, but using Health Service Areas and for a shorter time period (1979/1981–1991/1993), Pickle and Gillum10 reported a southwesterly shift in coronary heart disease death rates for white men from West Virginia to the southern sections of the Mississippi River Valley. Our study also expands on a rich literature documenting geographic disparities in rates of declining heart disease mortality in the United States for selected time intervals. Studies have documented state-level disparities in declining heart disease death rates from 1999 to 2007,8 geographic disparities among state economic areas in the onset of declining heart disease mortality in the 1960s and 1970s,12 slower rates of declines among Metropolitan Statistical Areas for black women and men in comparison with white women and men from 1985 to 1995,5 the impact of model choice on measuring spatiotemporal disparities in heart disease mortality at the county level,11 and the timing of declines by race and sex.25
In our study, the observed combination of a steady progression of high-rate counties from the Northeast to the South, together with the southern concentration of counties with the slowest declines in heart disease mortality, suggest these patterns did not occur randomly. Instead, the results emphasize the importance of place for health outcomes26 and suggest that there may have been systematic spatiotemporal changes in conditions that affect heart disease death rates. Studies have identified many interwoven dimensions of place that have implications for the burden of heart disease, including social and economic conditions,27–29 the built environment,30 healthy public policies,31 prevalence of biomedical and behavioral risk factors,32,33 and access to quality health care.34,35 Hypotheses for understanding the contributing factors to the observed spatiotemporal trends in heart disease mortality will need to consider spatiotemporal trends in these conditions, and migration patterns, as well.
Spatiotemporal studies of risk factor prevalences associated with heart disease mortality are scarce, in large part because of the lack of historical risk factor data at the local level. Only 3 studies that we are aware of examined temporal changes in the following 4 county-level risk factor prevalences (albeit for much shorter time periods than our study): cigarette smoking (1996–2012),36 hypertension (2001–2009),37 obesity (2001–2011),38 and physical activity (2001–2011).38 Each study used small-area estimation statistical techniques to generate county-level estimates from data that were collected at the state or national levels. Temporal changes in the geographic pattern of cigarette smoking showed similarities to the changes we observed for heart disease mortality. For instance, counties in the Northeast started out with high prevalences of cigarette smoking in 1996, but by 2012 the Northeast counties had predominantly low prevalences of cigarette smoking.36 In general, however, these studies reported little change in the geographic patterns of these risk factors over time. For hypertension, obesity, and physical activity, counties with the highest prevalences tended to be concentrated in the South at both the beginning and end of the study periods.37,38 The absence of changes in the geographic patterning of these risk factors could reflect the following: (1) study periods that are too short to capture meaningful change in geographic patterns, (2) imprecision of the statistical techniques, or (3) a true absence of change in the geographic patterns of these risk factors.
Spatial and temporal variations in the enactment of healthy public policies, ranging from tobacco control to housing and transportation, are important to consider given the widespread implications these policies have for creating and sustaining heart-healthy living and working conditions.31 Although historical data about the timing of state and local policy implementation can be challenging to locate, they can be very informative. For instance, state-level implementation of smoke-free indoor air legislation and increases in excise tax rates on cigarettes were both implemented initially in Northeastern and Western states during the early 2000s, but by 2014 there was still weak or no implementation of these policies in the South.39 Smoke-free environments may be particularly relevant given evidence that secondhand smoke affects nonsmokers’ risk, and thus, population variation could arise independent of the overall smoking prevalence.
The time period of this study coincides with major regional transitions in labor and industrialization policies in the United States. Historians have noted that many of the federal and state policies to increase the industrial base in the South often had negative implications for the social and economic conditions of the region.40,41 Given the well-documented associations between socioeconomic conditions and heart disease outcomes and risk factors,27–30 further study is warranted to examine the potential contributions of spatiotemporal changes in socioeconomic conditions to the spatiotemporal changes observed in heart disease mortality.
The near doubling of the magnitude of geographic inequality in heart disease mortality among US counties is concerning, especially in light of the Healthy People 2020 goals to reduce disparities in heart disease mortality.42 Increases in relative geographic disparity were initially reported by Wing et al for coronary heart disease mortality from 1962 to 1982,43 and have been reported for cardiovascular disease and all-cause mortality in the United States and Britain.44–46 Phelan and Link47 demonstrate that widening sociodemographic and geographic gaps occur when there are large declines in diseases for which successful prevention activities have been established, as is true for heart disease. They argue that the ability to benefit from advances in disease prevention policies and programs is unequally distributed according to the social and economic standing of individuals and communities, thereby leading to differential rates of decline and subsequent widening of disparities. The potential for high-risk strategies for heart disease prevention (ie, interventions aimed at individual-level changes in knowledge, motivation, and behavior) to increase disparities in the burden of heart disease has been noted given the differential resources available to individuals and communities to make and sustain such changes.48
Strengths
An important strength of this study is the use of a fully Bayesian spatiotemporal model to produce county-level estimates of heart disease mortality during an extended time period. By borrowing statistical strength across both space (neighboring counties) and time (the preceding and subsequent time intervals), the Bayesian model produces county estimates and variances for smaller populations that are more precise than other statistical methods.11 Our use of the LISA statistic provides an additional measure of statistical significance for documenting the spatiotemporal trends in heart disease mortality. Furthermore, this study is the first consistent and comparable long-term analysis of geographic disparities in heart disease mortality from the early 1970s through 2010.
Limitations
The reliance on death certificates for studies of geographic disparities in mortality poses several limitations. One limitation is the potential for misclassification caused by inaccuracy in the cause of death as reported on the death certificate. By using the broadest ICD category, diseases of the heart,17 we substantially minimized the potential for misclassification that exists when death certificates are used to study subtypes of heart disease.49,50 Furthermore, the comparability ratios between ICD revisions for diseases of the heart are near 1.0, indicating no bias from ICD coding changes over time.17 In contrast, the comparability ratios for several subtypes of heart disease reflect changes in the definitions, especially in the early years, which introduces bias into the temporal trends. For example, the comparability ratio for coronary heart disease was only 0.87 between ICD-8 and ICD-9, and, because of even larger changes in the definition of heart failure, no comparability ratio for heart failure was reported between ICD-8 and ICD-9.
However, the use of the broad category, diseases of the heart, also introduces a limitation—the inability to examine whether spatiotemporal trends in heart disease subtypes (eg, coronary heart disease [CHD] and heart failure) contributed differentially to the overall changes in the geographic pattern of heart disease mortality. Variations in the etiology and strength of risk factors by heart disease subtype could have implications for the determinants of the patterns observed in this study. However, given that CHD accounts for the majority of declines in diseases of the heart (94% of declines in all diseases of the heart from 2000 to 2010 were attributable to declines in CHD),51 that CHD and heart failure share important risk factors and that CHD itself is a very strong risk factor for heart failure,52,53 the category diseases of the heart is the most practical and reliable definition for studying spatiotemporal changes over nearly 40 years.
Another limitation related to the use of death certificates in this study is the inability to distinguish between geographic changes in case fatality versus incidence. Changes in case fatality would signal the relative importance of secondary prevention and access to quality care; changes in incidence would point to the relative importance of primary prevention. Nationally, >50% of the decline in heart disease mortality is estimated to be attributable to primary prevention54; however, the proportions could vary regionally and locally.
Finally, a limitation of the coefficient of variation is that it may be sensitive to potential changes in the skewness of the distribution of mortality over time. To test this, we calculated the coefficient of dispersion (Q3-Q1/median) and observed a nearly identical pattern over time, supporting the use of the coefficient of variation for this study.
Conclusion
The sweeping geographic changes in heart disease mortality observed over a relatively short period of time, with a shift of high-rate counties from the Northeast to the Deep South, suggest that systematic changes may have occurred in a variety of biomedical, behavioral, and socioenvironmental factors. The accompanying regional disparities in declining rates of heart disease mortality (with the slowest declines occurring predominantly in the South), and a nearly 2-fold increase in the geographic gap of heart disease mortality, highlight the importance of identifying conditions that are contributing to these disparities. Comprehensively documenting spatiotemporal patterns of heart disease mortality among communities in the United States, and exploring new hypotheses regarding the correlates of the changing geographic patterns, will enhance our ability to ensure that all communities experience optimal declines in heart disease mortality and that we narrow the existing geographic disparities in heart disease mortality.
Supplementary Material
Figure 1. Quintile maps of the expected mortality rate for each time-interval. Each time-interval map has approximately the same number of counties in each shade of red. This animation highlights how the region with the worst rates at the beginning of the study period (the Northeast) is different than the region with the worst rates at the end of the study period (the Deep South). To increase (decrease) the speed of the animation, you may click the “+” (“—”) button under the maps.
Acknowledgments
We thank Greg Schwartz for his valuable contributions to the initial spatial statistical approaches for generating rigorous county-level estimates of heart disease mortality rates and his work on the development of the database, along with Elvira McIntyre for her assistance with producing the final high-resolution maps in this article.
Sources of Funding
This research was supported in part by appointments for Dr Kramer and Adam Vaughan to the Research Participation Program at the Centers for Disease Control and Prevention administered by the Oak Ridge Institute for Science and Education through an interagency agreement between the US Department of Energy and CDC. Dr Kramer was also supported by the Eunice Kennedy Shriver National Institute of Child Health & Human Development of the National Institutes of Health under Award Number K01HD074726. The findings and conclusions in this report are those of the authors and do not necessarily represent the official position of the Centers for Disease Control and Prevention.
Footnotes
The online-only Data Supplement is available with this article at http://circ.ahajournals.org/lookup/suppl/doi:10.1161/CIRCULATIONAHA.115.018663/-/DC1.
Disclosures
None.
References
- 1.Greenlund K, Giles W, Keenan N, Malarcher A, Zheng Z, Casper M, Heath G, Croft J, Ward J, Warren C. Heart disease and stroke mortality in the twentieth century. In: Ward JW, Warren C, editors. Silent Victories: The History and Practice of Public Health in Twentieth-Century America. New York, NY: Oxford University Press; 2007. pp. 381–400. [Google Scholar]
- 2.Kramer MR, Valderrama AL, Casper ML. Decomposing black-white disparities in heart disease mortality in the U.S., 1973–2010: an age-period-cohort analysis. Am J Epidemiol. 2015;182:302–312. doi: 10.1093/aje/kwv050. Epub 2015 Jul 20. [DOI] [PMC free article] [PubMed] [Google Scholar]
- 3.Sempos C, Cooper R, Kovar MG, McMillen M. Divergence of the recent trends in coronary mortality for the four major race-sex groups in the United States. Am J Public Health. 1988;78:1422–1427. doi: 10.2105/ajph.78.11.1422. [DOI] [PMC free article] [PubMed] [Google Scholar]
- 4.Enterline PE, Stewart WH. Geographic patterns in deaths from coronary heart disease. Public Health Rep. 1956;71:849–855. [PMC free article] [PubMed] [Google Scholar]
- 5.Barnett E, Halverson J. Local increases in coronary heart disease mortality among blacks and whites in the United States, 1985–1995. Am J Public Health. 2001;91:1499–1506. doi: 10.2105/ajph.91.9.1499. [DOI] [PMC free article] [PubMed] [Google Scholar]
- 6.Interactive Atlas of Heart Disease and Stroke. Atlanta, GA: Centers for Disease Control and Prevention; 2015. [Accessed May 11, 2015]. http://nccd.cdc.gov/dhdspatlas. [Google Scholar]
- 7.Davis WB, Hayes CG, Knowles M, Riggan WB, Van Bruggen J, Tyroler HA. Geographic variation in declining ischemic heart disease mortality in the United States, 1968–1978. I. Rates and change, whites aged 35–74 years. Am J Epidemiol. 1985;122:657–672. doi: 10.1093/oxfordjournals.aje.a114145. [DOI] [PubMed] [Google Scholar]
- 8.Gillum RF, Mehari A, Curry B, Obisesan TO. Racial and geographic variation in coronary heart disease mortality trends. BMC Public Health. 2012;12:410. doi: 10.1186/1471-2458-12-410. [DOI] [PMC free article] [PubMed] [Google Scholar]
- 9.Leaverton PE, Feinleib M, Thom T. Coronary heart disease mortality rates in United States blacks, 1968–1978: interstate variation. Am Heart J. 1984;108(3 Pt 2):732–737. doi: 10.1016/0002-8703(84)90666-5. [DOI] [PubMed] [Google Scholar]
- 10.Pickle LW, Gillum RF. Geographic variation in cardiovascular disease mortality in US blacks and whites. J Natl Med Assoc. 1999;91:545–556. [PMC free article] [PubMed] [Google Scholar]
- 11.Vaughan AS, Kramer MR, Waller LA, Schieb LJ, Greer S, Casper M. Comparing methods of measuring geographic patterns in temporal trends: an application to county-level heart disease mortality in the United States, 1973 to 2010. Ann Epidemiol. 2015;25:329–335.e3. doi: 10.1016/j.annepidem.2015.02.007. [DOI] [PMC free article] [PubMed] [Google Scholar]
- 12.Wing S, Barnett E, Casper M, Tyroler HA. Geographic and socioeconomic variation in the onset of decline of coronary heart disease mortality in white women. Am J Public Health. 1992;82:204–209. doi: 10.2105/ajph.82.2.204. [DOI] [PMC free article] [PubMed] [Google Scholar]
- 13.Vaughan AS, Kramer MR, Casper M. Geographic disparities in declining rates of heart disease mortality in the southern United States, 1973–2010. Prev Chronic Dis. 2014;11:E185. doi: 10.5888/pcd11.140203. [DOI] [PMC free article] [PubMed] [Google Scholar]
- 14.Besag J, York J, Mollié A. Bayesian image restoration, with two applications in spatial statistics. Ann Inst Stat Math. 1991;43:1–20. [Google Scholar]
- 15.Quick H, Banerjee S, Carlin BP. Modeling temporal gradients in regionally aggregated California asthma hospitalization data. Ann Appl Stat. 2013;7:154–176. doi: 10.1214/12-AOAS600. [DOI] [PMC free article] [PubMed] [Google Scholar]
- 16.Klebba AJ, Scott JH. Estimates of selected comparability ratios based on dual coding of 1976 death certificates by the Eighth and Ninth Revisions of the International Classification of Diseases. Mon Vital Stat Rep. 1980;28:1–19. [Google Scholar]
- 17.Anderson RN, Minino AM, Hoyert DL, Rosenberg HM. Comparability of cause of death between ICD-9 and ICD-10: preliminary estimates. Natl Vital Stat Rep. 2001;49:1–32. [PubMed] [Google Scholar]
- 18.National Center for Health Statistics. Bridged-race intercensal estimates of the resident population of the United States. [Accessed February 25, 2013];Prepared under a collaborative arrangement with the US Census Bureau. /nchs/nvss/bridged_race.htm.
- 19.Klein RJ, Schoenborn CA. Age-Adjustment Using the 2000 Projected US Population. Hyattsville, MD: U.S. Department of Health and Human Services, Centers for Disease Control and Prevention, National Center for Health Statistics; 2001. [PubMed] [Google Scholar]
- 20.Anselin L. Local indicators of spatial association - Lisa. Geogr Anal. 1995;27:93–115. [Google Scholar]
- 21.Harper S, Lynch J. Methods for measuring cancer disparities: using data relevant to Healthy People 2010 cancer-related objectives. Bethesda, MD: National Cancer Institute; 2005. NCI Cancer Surveillance Monograph Series, Number 6. NIH publication 05-5777. [Google Scholar]
- 22.R: A language and environment for statistical computing [computer program] Vienna, Austria: R Foundation for Statistical Computing; 2014. [Accessed September 1, 2014]. http://www.R-project.org/ [Google Scholar]
- 23.ArcMap 10.0 [computer program] Redlands, CA: ESRI; 2010. [Google Scholar]
- 24.SAS 9.1.3 [computer program] Cary, NC: SAS Institute Inc; 2005. [Google Scholar]
- 25.Vaughan AS, Quick H, Pathak EB, Kramer MR, Casper M. Disparities in temporal and geographic patterns of declining heart disease mortality by race and sex in the United States, 1973–2010. J Am Heart Assoc. 2015;4:e002567. doi: 10.1161/JAHA.115.002567. [DOI] [PMC free article] [PubMed] [Google Scholar]
- 26.Dunn JR, Cummins S. Placing health in context. Soc Sci Med. 2007;65:1821–1824. [Google Scholar]
- 27.Chaix B. Geographic life environments and coronary heart disease: a literature review, theoretical contributions, methodological updates, and a research agenda. Annu Rev Public Health. 2009;30:81–105. doi: 10.1146/annurev.publhealth.031308.100158. [DOI] [PubMed] [Google Scholar]
- 28.Diez Roux AV, Merkin SS, Arnett D, Chambless L, Massing M, Nieto FJ, Sorlie P, Szklo M, Tyroler HA, Watson RL. Neighborhood of residence and incidence of coronary heart disease. N Engl J Med. 2001;345:99–106. doi: 10.1056/NEJM200107123450205. [DOI] [PubMed] [Google Scholar]
- 29.Tonne C, Schwartz J, Mittleman M, Melly S, Suh H, Goldberg R. Long-term survival after acute myocardial infarction is lower in more deprived neighborhoods. Circulation. 2005;111:3063–3070. doi: 10.1161/CIRCULATIONAHA.104.496174. [DOI] [PubMed] [Google Scholar]
- 30.Diez Roux AV, Kershaw K, Lisabeth L. Neighborhoods and cardiovascular risk: beyond individual-level risk factors. Curr Cardiovasc Risk Rep. 2008;2:175–180. [Google Scholar]
- 31.Schoeni RF, House JS, Kaplan GA, Pollack H. Making Americans Healthier: Social and Economic Policy as Health Policy. New York: Russell Sage Foundation; 2008. [Google Scholar]
- 32.Ahluwalia IB, Mack KA, Murphy W, Mokdad AH, Bales VS. State-specific prevalence of selected chronic disease-related characteristics–Behavioral Risk Factor Surveillance System, 2001. MMWR Surveill Summ. 2003;52:1–80. [PubMed] [Google Scholar]
- 33.Greenlund KJ, Zheng ZJ, Keenan NL, Giles WH, Casper ML, Mensah GA, Croft JB. Trends in self-reported multiple cardiovascular disease risk factors among adults in the United States, 1991–1999. Arch Intern Med. 2004;164:181–188. doi: 10.1001/archinte.164.2.181. [DOI] [PubMed] [Google Scholar]
- 34.Yamashita T, Kunkel SR. The association between heart disease mortality and geographic access to hospitals: county level comparisons in Ohio, USA. Soc Sci Med. 2010;70:1211–1218. doi: 10.1016/j.socscimed.2009.12.028. [DOI] [PubMed] [Google Scholar]
- 35.Kirby JB, Kaneda T. Neighborhood socioeconomic disadvantage and access to health care. J Health Soc Behav. 2005;46:15–31. doi: 10.1177/002214650504600103. [DOI] [PubMed] [Google Scholar]
- 36.Dwyer-Lindgren L, Mokdad AH, Srebotnjak T, Flaxman AD, Hansen GM, Murray C. Cigarette smoking prevalence in US counties: 1996–2012. Popul Health Metr. 2014:12. doi: 10.1186/1478-7954-12-5. [DOI] [PMC free article] [PubMed] [Google Scholar]
- 37.Olives C, Myerson R, Mokdad AH, Murray CJ, Lim SS. Prevalence, awareness, treatment, and control of hypertension in United States counties, 2001–2009. PLoS One. 2013;8:e60308. doi: 10.1371/journal.pone.0060308. [DOI] [PMC free article] [PubMed] [Google Scholar]
- 38.Dwyer-Lindgren L, Freedman G, Engell RE, Fleming TD, Lim SS, Murray CJ, Mokdad AH. Prevalence of physical activity and obesity in US counties, 2001–2011: a road map for action. Popul Health Metr. 2013;11:7. doi: 10.1186/1478-7954-11-7. [DOI] [PMC free article] [PubMed] [Google Scholar]
- 39.Centers for Disease Control and Prevention. [Accessed April 6, 2015];State Tobacco Activities Tracking and Evaluation (STATE) System. http://apps.nccd.cdc.gov/statesystem/InteractiveReport/InteractiveReports.aspx.
- 40.Cobb JC. The South and America Since World War II. New York, NY: Oxford University Press; 2010. [Google Scholar]
- 41.Schulman BJ. From Cotton Belt to Sunbelt: Federal Policy, Economic Development, and the Transformation of the South, 1938–1980. Durham, NC: Duke University Press; 1994. [Google Scholar]
- 42.U.S. Department of Health and Human Services. Office of Disease Prevention and Health Promotion. [Accessed April 30, 2015];Healthy People 2020. http://www.healthypeople.gov/
- 43.Wing S, Casper M, Davis W, Hayes C, Riggan W, Tyroler HA. Trends in the geographic inequality of cardiovascular disease mortality in the United States, 1962–1982. Soc Sci Med. 1990;30:261–266. doi: 10.1016/0277-9536(90)90181-q. [DOI] [PubMed] [Google Scholar]
- 44.Singh GK, Siahpush M. Increasing inequalities in all-cause and cardiovascular mortality among US adults aged 25–64 years by area socioeconomic status, 1969–1998. Int J Epidemiol. 2002;31:600–613. doi: 10.1093/ije/31.3.600. [DOI] [PubMed] [Google Scholar]
- 45.Singh GK. Area deprivation and widening inequalities in US mortality, 1969–1998. Am J Public Health. 2003;93:1137–1143. doi: 10.2105/ajph.93.7.1137. [DOI] [PMC free article] [PubMed] [Google Scholar]
- 46.Asaria P, Fortunato L, Fecht D, Tzoulaki I, Abellan JJ, Hambly P, de Hoogh K, Ezzati M, Elliott P. Trends and inequalities in cardiovascular disease mortality across 7932 English electoral wards, 1982–2006: Bayesian spatial analysis. Int J Epidemiol. 2012;41:1737–1749. doi: 10.1093/ije/dys151. discussion 1750. [DOI] [PMC free article] [PubMed] [Google Scholar]
- 47.Phelan JC, Link BG. Controlling disease and creating disparities: a fundamental cause perspective. J Gerontol B Psychol Sci Soc Sci. 2005;60(spec no 2):27–33. doi: 10.1093/geronb/60.special_issue_2.s27. [DOI] [PubMed] [Google Scholar]
- 48.Capewell S, Graham H. Will cardiovascular disease prevention widen health inequalities? PLoS Med. 2010;7:e1000320. doi: 10.1371/journal.pmed.1000320. [DOI] [PMC free article] [PubMed] [Google Scholar]
- 49.Ives DG, Samuel P, Psaty BM, Kuller LH. Agreement between nosologist and cardiovascular health study review of deaths: implications of coding differences. J Am Geriatr Soc. 2009;57:133–139. doi: 10.1111/j.1532-5415.2008.02056.x. [DOI] [PMC free article] [PubMed] [Google Scholar]
- 50.Lloyd-Jones DM, Martin DO, Larson MG, Levy D. Accuracy of certificates for coding coronary heart disease as the cause of death. Ann Intern Med. 1998;129:1020–1026. doi: 10.7326/0003-4819-129-12-199812150-00005. [DOI] [PubMed] [Google Scholar]
- 51.Ritchey MD, Loustalot F, Bowman BA, Hong Y. Trends in mortality rates by subtypes of heart disease in the United States, 2000–2010. JAMA. 2014;312:2037–2039. doi: 10.1001/jama.2014.11344. [DOI] [PMC free article] [PubMed] [Google Scholar]
- 52.He J, Ogden LG, Bazzano LA, Vupputuri S, Loria C, Whelton PK. Risk factors for congestive heart failure in US men and women: NHANES I epidemiologic follow-up study. Arch Intern Med. 2001;161:996–1002. doi: 10.1001/archinte.161.7.996. [DOI] [PubMed] [Google Scholar]
- 53.Mensah GA, Brown DW, Croft JB, Greenlund KJ. Major coronary risk factors and death from coronary heart disease: baseline and follow-up mortality data from the Second National Health and Nutrition Examination Survey (NHANES II) Am J Prev Med. 2005;29(5 suppl 1):68–74. doi: 10.1016/j.amepre.2005.07.030. [DOI] [PubMed] [Google Scholar]
- 54.Young F, Capewell S, Ford ES, Critchley JA. Coronary mortality declines in the U.S. between 1980 and 2000 quantifying the contributions from primary and secondary prevention. Am J Prev Med. 2010;39:228–234. doi: 10.1016/j.amepre.2010.05.009. [DOI] [PubMed] [Google Scholar]
Associated Data
This section collects any data citations, data availability statements, or supplementary materials included in this article.
Supplementary Materials
Figure 1. Quintile maps of the expected mortality rate for each time-interval. Each time-interval map has approximately the same number of counties in each shade of red. This animation highlights how the region with the worst rates at the beginning of the study period (the Northeast) is different than the region with the worst rates at the end of the study period (the Deep South). To increase (decrease) the speed of the animation, you may click the “+” (“—”) button under the maps.