

Abstract
Epidermal growth factor receptor (EGFR, also known as ErbB-1 or HER-1) is a membrane bound protein that has been associated with a variety of solid tumors and the control of cell survival, proliferation and metabolism. Quantification of EGFR expression level in cells membrane and the interaction kinetics with drugs are thus important for cancer diagnosis and treatment. Here we report mapping of the distribution and interaction kinetics of EGFR in their native environment with a surface plasmon resonance imaging (SPRi) technique. Monoclonal anti-EGFR antibody was used as a model drug in this study. The binding of the antibody to EGFR overexpressed A431 cells was monitored in real time, which was found to follow the first-order kinetics with association rate constant (ka) and dissociation rate constant (kd) to be (2.7 ± 0.6)×105 M-1s-1 and (1.4 ± 0.5)×10-4 s-1, respectively. The dissociation constant (KD) was determined to be (0.53 ± 0.26) nM with up to seven folds variation among different individual A431 cells. In addition, the averaged A431 cell surface EGFR density was found to be 636/μm2 with an estimation of 5×10⁵ EGFR per cell. Additional measurement also revealed different EGFR positive cell lines (A431, HeLa and A549) show receptor density dependent anti-EGFR binding kinetics. The results demonstrate that SPRi is a valuable tool for direct quantification of membrane protein expression level and ligand binding kinetics at single cell resolution. Our findings show that the local environment affects the drug-receptor interactions and in-situ measurement of membrane protein binding kinetics is important.
Molecular targeting therapy is an advanced cancer therapy, which can improve tumor-targeting specificity compared with the traditional chemotherapy and radiotherapy. Among all the identified targets, one promising molecular target is the epidermal growth factor receptor (EGFR, also known as ErbB-1 or HER-1) in cell membrane. EGFR plays an essential role in regulating normal cell signaling, and the mutation of EGFR leads to cell proliferation, angiogenesis, invasion, metastasis and inhibition of apoptosis, accounting for the pathogenesis and progression of cancer cells.1-5 Therefore, in situ quantification of EGFR expression level in cell membrane, and ligand binding kinetics and affinity are of great importance for cancer diagnosis and treatment.
EGFR is a transmembrane protein, which consists of three major functional domains: an extracellular binding domain, a hydrophobic transmembrane domain and an intracellular tyrosine kinase domain.6-9 When an epidermal growth factor (EGF) or transforming growth factor (TGF) ligands bind to the extracellular domain, EGFR undergoes a transition to form receptor homodimers or heterodimers with neighboring ErbB receptors, which activates the intrinsic receptor tyrosine kinase domain for signal transduction. Mutations that cause EGFR overexpression and constant activation often lead to uncontrolled cell dividing.10-15 Therefore, quantification of EGFR expression density in cell membrane is a critical step for cancer diagnosis. Currently, the most used approach for receptor density measurement is radio-labeling assay16,17, which involves synthesis of radio-ligand and requires special training and safety protection. A label-free method is desired for rapid quantification of receptor density.
In order to prevent the unwanted downstream effects of EGFR signaling, two kinds of inhibitors have been proposed for cancer treatment: tyrosine kinase inhibitors targeting the intracellular domain and monoclonal antibodies targeting the extracellular domain. The binding of these inhibitors to EGFR slows down or stops tumor cell growth.18-25 Monoclonal antibodies targeting the extracellular domain of EGFR have been in various stages of pre-clinical development, and have shown good therapeutic efficacy for treatment of a number of cancers that have up-regulated EGFR expression levels.1,2,22,26,27 The kinetic constants of the binding of these antibody drugs to EGFR are the key parameters to characterize the efficacy of these drugs.
Binding kinetic constants determine how fast a drug and its receptor associate and dissociate, providing valuable information for drug screening and optimization.28,29 A widely used method to measure the binding kinetics is to isolate the target proteins from cell membrane for direct or indirect binding with antibodies for target specific drug screening, among which the enzyme linked immunosorbent assay (ELISA) is mostly used in protein study.30-34 ELISA uses an enzyme labelled antibody for signal amplification, which has high sensitivity and selectivity. However, this method involves the extraction and purification of target proteins, which is laborious. A more serious drawback is that the purified proteins may lose their original structures and functions after isolated from the native membrane environment. Other methods, such as radiolabeling and fluorescent labeling, have been used to measure molecular interactions of the membrane proteins in their native membrane environment with high sensitivity,35-37 but they are end point assays, and cannot provide kinetic constants required to quantify the molecular interactions.38,39 A label-free method for in situ measurement of binding kinetics of membrane proteins in intact cells is needed for rapid and accurate drug screening.
Surface plasmon resonance (SPR) is a label-free technique to measure the kinetics of molecular interaction.40 Surface plasmon resonance imaging (SPRi) extend SPR measurement to microarray 33,41-45 and enable direct measurement of molecular binding kinetics on the surface of mammalian cells46,47 and bacteria.48 In this paper, we report quantification of EGFR expression density and antibody binding kinetics to EGFR on cell surface, as an effort to establish a cell based label-free SPRi platform for in situ quantification of drug-target interactions. A monoclonal antibody, anti-EGFR, was used to study the binding kinetics and affinity in EGFR overexpressed cells with single cell resolution and the ability to mapping cell-to-cell heterogeneity. Furthermore, the binding kinetics of cell lines with different EGFR-expressing levels were compared, which reveals microenvironment in the cell membranes affecting the drug-receptor interactions.
Materials and Methods
Materials
Anti-EGFR monoclonal antibody (Cat. No. 05-101) was purchased from EMD Millipore, which was dissolved as a 1 mg/mL stock solution, and stored in frozen aliquots. Anti-EGFR solutions used in the experiments were prepared by diluting the stock solution with phosphate buffer solution (PBS). Alexa Fluor 488 Goat Anti-Mouse IgG1 (γ1) Antibody (Cat. No. A-21121) was obtained from Life technologies. All reagents were analytical grade, purchased from Sigma-Aldrich, except those stated. Deionized water was used to prepare all the buffers.
SPRi set-up
The details of the SPRi setup was described elsewhere.47 Briefly, a collimated p-polarized light from a 680 nm light-emitting diode (LED) was directed through a triangular prism onto the gold-coated glass coverslip placed on the prism. The reflected beam was captured by a CCD camera (AVT Pike F032B) at a frame rate of 11 frames per second (fps) through a 10× variable zoom lens (Navitar) with a spatial resolution of ∼5 μm. A Flexi-Perm silicon chamber (SARSTEDT) was placed on top of the gold chip to serve as a cell-culture well. A schematic diagram of the set-up is shown in Fig. 1.
Fig 1.
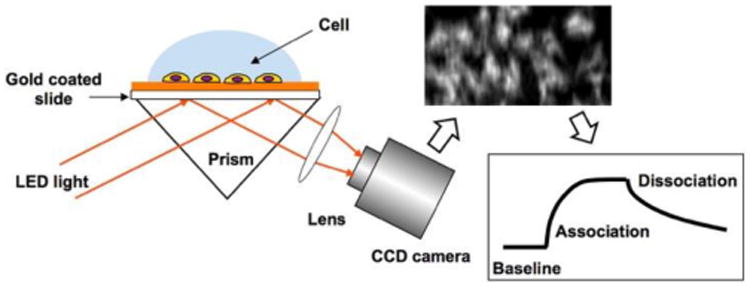
Schematic diagram of the SPRi setup with cells on the surface of gold-coated glass chip.
A gravity-based multichannel drug perfusion system (SF-77B, Warner Instruments, Connecticut) was used to deliver solutions to the target cells. The typical transition time between different solutions was about 1–2 seconds.46,47
Cell culture
A431, A549, HeLa and HEK293 cell lines were obtained from the American Type Culture Collection (Rockville, MD). All the cells were cultured in a humidified incubator at 37°C with 5% CO2 and 70% relative humidity. A431, HeLa and HEK293 cells were grown in Dulbecco Modified Eagle Medium (DMEM) (Lonza, Walkersville, MD USA) with 10% Fetal Bovine Serum (FBS) and 1% penicillin and streptomycin. A549 cells were cultured in Ham's F-12K (Kaighn's) Medium (Lonza, Walkersville, MD USA) with 10% FBS and 1% penicillin and streptomycin. Cells were passaged with 0.25% trypsin and 0.02% ethylenediaminetetraacetic acid in a Hank's balanced salt solution (Sigma-Aldrich, St Louis, Missouri) when they were approximately 75% confluent.
In order to promote cell adhesion, the gold surface of the chips was incubated with 10 μg/mL collagen for 2 hours. The collagen-coated chips were rinsed with PBS buffer twice prior to seeding. Each chip was seeded with 5,000 cells in 300 μl of growth medium and was incubated for 1 day to allow the cells to attach and grow. The growth medium was replaced with PBS buffer solution prior to the experiment. The viability of cells on the chips was visually inspected prior experiment using a tissue culture microscope. A total of more than 50 chips were tested and all cells showed consistent high viability similar to cells in a tissue culture plate. Cells were fixed by incubating in 4% paraformaldehyde solution for 10 minutes at room temperature prior to measurement.
Immunofluorescence
The immunofluorescence images were obtained with an inverted fluorescence microscope at 10× magnification (Olympus IX81). A 150 W mercury lamp was used as the light source. For EGFR staining, the fixed cells were incubated with 10 μg/mL anti-EGFR solution for 30 minutes, followed by 30 minutes incubation with Alexa Fluor 488 Goat Anti-Mouse IgG1 (γ1) after 3 times of rinses with PBS buffer. The fluorescence image was captured after rinsing the well twice with PBS buffer. The following optical filters were used to obtain the fluorescence image: excitation filter 420-480 nm, emission filter 515 nm.
Results and Discussion
In situ quantification of anti-EGFR and EGFR interaction kinetics on the surface of A431 cell
A431 cell is a model cell line (Epidermoid Carcinoma) that overexpresses EGFR in the cell membrane. To investigate the molecular interaction of EGFR in their native environment, we grew and fixed A431 cells on gold-coated glass coverslips and measured binding kinetics and affinity of anti-EGFR, the specific monoclonal antibody inhibitor targeted at the extracellular domain of EGFR, using a prism based SPRi setup. When anti-EGFR antibody binds to EGFR on the cell membrane, the mass (36 kDa for anti-EGFR) induced refractive index change was recorded as SPR image intensity changes, and presented in the form of SPR sensorgram. Three gold chips with different batches of cells were measured to validate repeatability of the technique. Non-specific binding signals were quantified in the cell-free gold area and were subtracted from the raw signals to obtain the specific binding signals (Fig. S1).
Fig. 2a shows a representative SPR image of A431 cells, in which the bright spots represent individual or clusters of cells. A431 cells tend to aggregate. The following steps were performed to measure the EGFR binding kinetics. First, PBS buffer was flowed over the cells for 300 seconds at a flow rate of 350 μL/min to record the baseline. Next, 2 μg/mL anti-EGFR was introduced to the cells for 350 seconds to record the association process. Last, PBS buffer was reintro-duced to the cells for 400 seconds to measure the dissociation of the antibody. During the association process, obvious increases in SPR intensity at all cell regions were observed, as shown in the differential image (Fig. 2b). The differential image maps the SPR intensity changes in each pixel by subtracting the original SPR image prior adding the antibody (t = 300th second) from the SPR image at the end of association phase (t = 650th second). Apart from the obvious intensity increase in all cell regions compared to the gold area, the image intensity changes at different cell regions were different, which indicated the heterogeneity of EGFR express level among individual cells.
Fig 2.
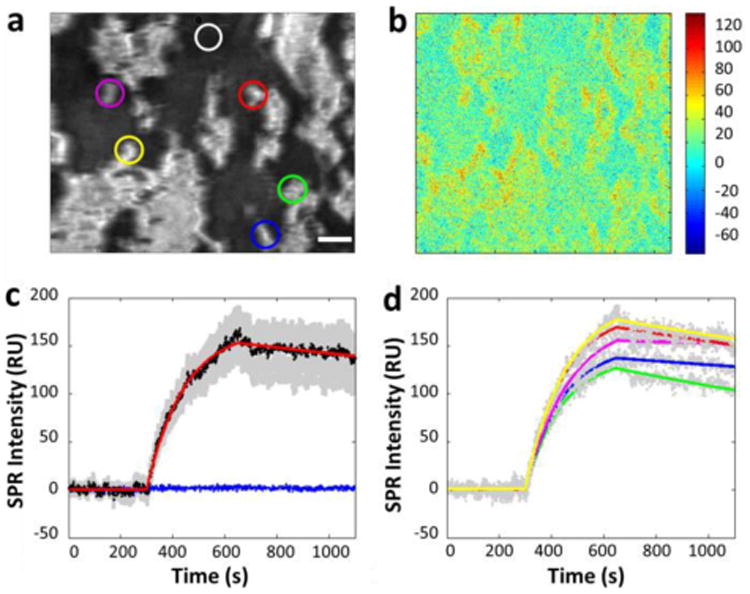
(a) A typical SPR image of a few tens of A431 cells adhered on the gold-coated glass slide. (b) Differential SPR image shows the maximum SPR intensity increase due to anti-EGFR binding to the surface of A431 cells. (c) The average SPR sensorgrams of all cells in view (black curves: average SPR sensorgram, red curve: curve fitting, gray background: cell-to-cell variation) and the surrounding regions without cell coverage (blue curve). (d) The SPR sensorgrams of five individual cells of different regions (gray dotted curves: individual SPR sensorgram, colored curve: corresponding fitting curves). All the plots shown are subtracted the non-specific binding response (in the white cycle region of (a)) in gold area from the raw response signals. Scale bar, 50 μm.
Quantitative binding kinetics are extracted from the SPR image sequences, and plotted as sensorgrams, with a representative result shown in Fig. 2c. A maximum averaged increase of 168 RU was found in the SPR sensorgram shown in Fig. 2c, where the black curve represents the averaged response of all the cells in Fig. 2a and the gray background area shows the response from individual cells or clusters. The binding kinetics of anti-EGFR in A431 cells were determined by fitting the averaged response curve with a 1:1 Langmuir binding model (the red curve). From three independent measurements, the corresponding association rate constant (ka), dissociation rate constant (kd) and dissociation constant (KD) were calculated and showed in Table 1 as the mean value of three chips. These results validated the repeatability of the measurements, and indicated a fast and strong binding. The flat blue curve in Fig. 2c shows that there is no response from the gold area without cells, and confirms the specificity of the antibody binding.
Table 1. Measured EGFR binding kinetic constants.
| ka (M-1s-1) | kd (s-1) | KD (nM) | |
|---|---|---|---|
| Cell 1 (red curve) | 6.0×10⁵ | 2.6×10⁻⁴ | 0.43 |
| Cell 2 (blue curve) | 6.4×10⁵ | 1.5×10⁻⁴ | 0.23 |
| Cell 3 (green curve) | 6.2×10⁵ | 44×10-4 | 0.70 |
| Cell 4 (yellow curve) | 5.5×10⁵ | 2.7×10⁻⁴ | 0.49 |
| Cell 5 (purple curve) | 5.3×10⁵ | 5.5×10⁻⁵ | 0.10 |
| Mean value of 3 chips | 6.7×10⁵ | 3.3 × 10⁻⁴ | 0.41 |
Heterogeneous binding kinetics of individual cells
An important capability of imaging based measurement is to quantify the heterogeneous responses of anti-EGFR interaction from individual cells, which is important for identifying tumor specificity therapy development, since tumor tissue sample often mixed with normal cells. Fig. 2d shows the association and dissociation processes of five individual cells selected from different regions of the chip, where the color curves are first order kinetic fitting to the data (gray dots). The corresponding cells are marked with corresponding colored circles in Fig. 2a. From the sensorgrams, we can conclude that maximum association varies from cell to cell. Furthermore, the kinetic constants (Table 1) obtained from the fitting exhibit up to seven folds of variations, significantly larger than the measurement error (variation from different tests). These results reveal cell-to-cell heterogeneity in the binding of drugs to the cells, which underscores the importance of measuring binding kinetics at single cell level.
Dose response, global and equilibrium fitting
To measure the dose response of EGFR to the antibody drug, anti-EGFR solutions with concentration increasing from 0.5 to 10 μg/mL were sequentially introduced to A431 cells on a sensor chip to record the association and dissociation kinetics. For each new dose of anti-EGFR, the cell surface was regenerated with 100 mM NaOH for 30 seconds. SPR sensorgrams for different doses of anti-EGFR were plotted in Fig. 3a (black curves). Both the association rate constant and maximum SPR response increase with anti-EGFR concentration, which are expected for first order kinetics. The red lines are the global fitting results of the sensorgrams based on 1:1 binding kinetics model. The kinetic constants obtained from the global fitting are ka = (2.7 ± 0.6) × 105 M-1s-1, kd = (1.4 ± 0.5) × 10-4 s-1, and KD = 0.53 ± 0.26 nM, and are in consistent with the single concentration fitting result (mean value in table 1).
Fig 3.
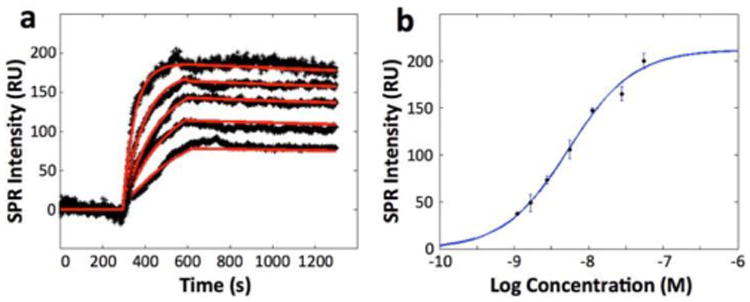
(a) SPR sensorgrams of a cell at different concentrations of anti-EGFR and the corresponding global fitting (red curves). Anti-EGFR concentrations are 0.5, 1, 2, 5 and 10 μg/mL from bottom to top curve, respectively. All the plots shown are subtracted the non-specific binding response in gold area from the raw response signals. (b) The equilibrium-fitting curve. The anti-EGFR concentration (plotted in log scale) was 0.2, 0.3, 0.5, 1, 2, 5 and 10 μg/mL, respectively. The equilibrium response values at different concentrations are obtained by fitting association section of sensorgrams with first order kinetics. At least 3 independent measurements were performed for each concentration.
In addition to the kinetic analysis, equilibrium-fitting curve was plotted based on the equilibrium binding responses obtained at seven different concentrations (Fig. 3b), and the obtained dissociation constant, KD, was determined to be 5.1 nM, in the range of reported value.49 KD value obtained from the equilibrium-fitting curve is depending on the ligand (anti-EGFR) concentration. In general, KD value will increase as the concentration of the ligand increases,50 which may account for the difference between the global fitting result and equilibrium fitting result. As the concentrations of anti-EGFR used in our experiments are all bigger than the dissociation constant calculated in global fitting, it is reasonable that the KD obtained from the equilibrium-fitting curve is larger than the KD obtained from kinetic response curves.
Determination of EGFR expression level
In addition to determination of binding kinetics, the SPR signal can also be used to quantify the expression level of EGFR in A431 cell membrane. In SPR sensorgram, the equilibrium response represented the saturated amount of anti-EGFR bound to A431 cells, from which we can estimate EGFR receptor density by assuming the 1:1 binding between anti-EGFR and EGFR on cell surface. With 10 μg/mL anti-EGFR stimulation, the equilibrium response was calculated to be 190 RU increase in SPR intensity, which can be used for receptor density calculation. Assume 1 RU SPR response corresponds to 1 pg/mm2 mass application, the binding of anti-EGFR induced 190 pg/ mm2 in the cell surface, which corresponds to ∼636 receptors/μm2. Given the average diameter of 25 μm for suspended A431 cells, the average number of EGFR receptors is around 5×10⁵ per cell. This number is in consistent with the results measured by flow cytometry and fluorescent labeling.51 This result shows that cell-based SPRi is able to quantify membrane receptor density without any labeling, and is a potentially a valuable tool for biomarker discovery and cancer diagnosis.
EGFR binding kinetics and expression levels in different cell lines
To investigate how the native cellular microenvironment affects the drug-receptor interactions, binding kinetics of anti-EGFR to EGFR in four cell lines with different expression levels were studied. These cell lines include EGFR-positive A431, HeLa and A549, and EGFR-negative HEK293 as a negative control. Fig. 4a shows the SPR images of different cell lines before the antibody administration. Differential SPR images in Fig. 4b shows the SPR intensity increase due to anti-EGFR binding. Obvious increase was observed in A431 cells, while HeLa cell and A549 cells showed much smaller responses. Fig. 4c shows the averaged responses curves of a few tens of cells (black lines) and the kinetic fitting curves (red lines). The gray area represents the distribution, which measures the heterogeneity for each cell line. Typical association and dissociation curves observed in HeLa and A549 cell with reduced responses compare with A431. No specific response from EGFR-negative HEK293 cells was observed, confirming that the specific anti-EGFR and EGFR interactions were responsible for the SPR responses in cell regions. From the equilibrium binding responses, EGFR density in HeLa and A549 were found to be 270 and 142 recep-tors/μm2, respectively, corresponding to 0.21 and 0.11 million per cell, much lower than A431.
Fig 4.
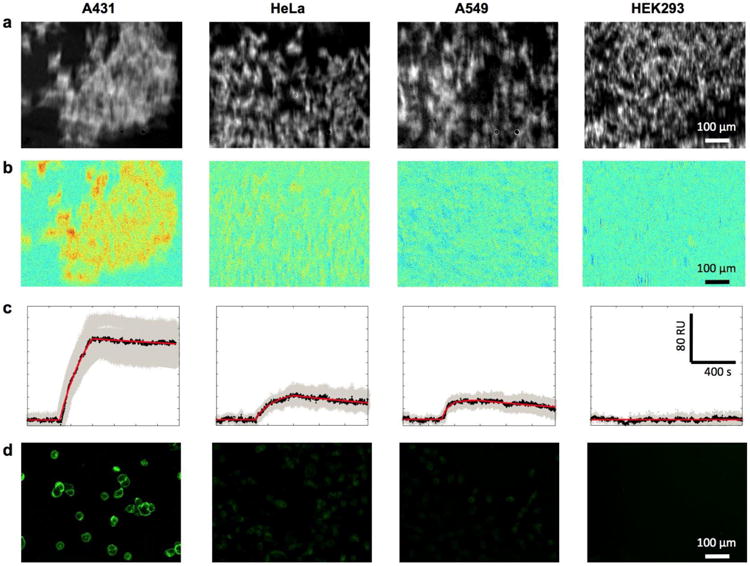
Anti-EGFR interactions with EGFR-positive (A431, HeLa and A549) and EGFR-negative (HEK 293) cell lines. (a) SPR images before anti-EGFR binding. (b) Differential SPR images after anti-EGFR binding. (c) The SPR sensorgrams of 2 μg/mL anti-EGFR binding. All the plots shown are subtracted the non-specific binding response in gold area from the raw response
For cross validation, the EGFR expression levels in different cell lines were confirmed by immunofluorescence imaging. Fig. 4d shows the fluorescence image of the four cell lines stained with anti-EGFR antibody followed by a fluorescence-labeled secondary antibody. The intensity of fluorescent signal is proportional to the EGFR abundance. In consistence with SPRi results, A431 cell has the highest fluorescence intensity, while HeLa and A549 cells exhibit lower emission, and HEK293, the negative control, shows no detectable fluorescent signal.
The kinetic constants in the three EGFR-positive cell lines were determined from fitting the averaged cell responses with first order kinetics. Table 2 listed the EGFR density and binding kinetics of the three cell lines we measured. The table shows a trend of increased rate constants (ka and kd) and stronger affinity (lower KD) with lower receptor density, which could be caused by steric hindrance effect. This observation show that the membrane microenvironment of the EGFR receptors may plays an important role in drug/receptor interactions, and this information could not be obtained by traditional approaches that study proteins isolated from the cells.
Table 2. EGFR densities and binding kinetic constants with anti-EGFR in different cell lines.
| Cell line | EGFR density (Molecules/μm2) | ka (M-1s-1) | kd (s-1) | KD (nM) |
|---|---|---|---|---|
| A431 | 636 | 2.7×10⁵ | 1.4×10⁻⁴ | 0.53 |
| Hela | 270 | 5.4×10⁵ | 2.4×10⁻⁴ | 0.45 |
| A549 | 142 | 2.4×10⁶ | 7.0×10⁻⁴ | 0.29 |
Conclusions
We have quantified the binding kinetics of monoclonal anti-EGFR antibody to its membrane bound target receptor EGFR in cultured cells with SPRi. The imaging capability of this label-free method enables mapping of individual cell responses. The real time detection capability provides quantitative information on the membrane bound receptor density and ligand interaction kinetics. While the averaged kinetic constants in consistent with the literature data, we have observed several folds of cell-to-cell variations in kinetic constants. Furthermore, we found a correlation between EGFR density and binding kinetics among different EGFR positive cell lines. Our results demonstrated that SPRi is able to directly quantify the membrane bound receptor expression level and ligand binding kinetics without the need of labeling. Our findings also underscore the importance of in situ study of drug/receptors interaction in intact cells.
Supplementary Material
Acknowledgments
Financial support from National Institute of Health (1R01GM107165-01A1 and 1R44GM106579-01) is acknowledged.
Footnotes
Supporting Information: Non-specific binding and correction method. This material is available free of charge via the Internet at http://pubs.acs.org
Notes: The authors declare no competing financial interest.
References
- 1.Mendelsohn J, Baselga J. Oncogene. 2000;19:6550–6565. doi: 10.1038/sj.onc.1204082. [DOI] [PubMed] [Google Scholar]
- 2.Nicholson RI, Gee JMW, Harper ME. European Journal of Cancer. 2001;37:S9–S15. doi: 10.1016/s0959-8049(01)00231-3. [DOI] [PubMed] [Google Scholar]
- 3.Press MF, Lenz HJ. Drugs. 2007;67:2045–2075. doi: 10.2165/00003495-200767140-00006. [DOI] [PubMed] [Google Scholar]
- 4.Johnston JB, Navaratnam S, Pitz MW, Maniate JM, Wiechec E, Baust H, Gingerich J, Skliris GP, Murphy LC, Los M. Curr Med Chem. 2006;13:3483–3492. doi: 10.2174/092986706779026174. [DOI] [PubMed] [Google Scholar]
- 5.Arteaga CL. Oncologist. 2002;7:31–39. doi: 10.1634/theoncologist.7-suppl_4-31. [DOI] [PubMed] [Google Scholar]
- 6.Dutta PR, Malty A. Cancer Lett. 2007;254:165–177. doi: 10.1016/j.canlet.2007.02.006. [DOI] [PMC free article] [PubMed] [Google Scholar]
- 7.Harari PM. Endocr-Relat Cancer. 2004;11:689–708. doi: 10.1677/erc.1.00600. [DOI] [PubMed] [Google Scholar]
- 8.Olayioye MA, Neve RM, Lane HA, Hynes NE. Embo J. 2000;19:3159–3167. doi: 10.1093/emboj/19.13.3159. [DOI] [PMC free article] [PubMed] [Google Scholar]
- 9.Yarden Y. European Journal of Cancer. 2001;37:S3–S8. doi: 10.1016/s0959-8049(01)00230-1. [DOI] [PubMed] [Google Scholar]
- 10.Arteaga CL, Baselga J. Clin Cancer Res. 2003;9:1579–1589. [PubMed] [Google Scholar]
- 11.Baselga J. Oncologist. 2002;7:2–8. doi: 10.1634/theoncologist.7-suppl_4-2. [DOI] [PubMed] [Google Scholar]
- 12.Grandis JR, Sok JC. Pharmacol Therapeut. 2004;102:37–46. doi: 10.1016/j.pharmthera.2004.01.002. [DOI] [PubMed] [Google Scholar]
- 13.Yarden Y, Sliwkowski MX. Nat Rev Mol Cell Bio. 2001;2:127–137. doi: 10.1038/35052073. [DOI] [PubMed] [Google Scholar]
- 14.Grandis JR, Foon KA. Oncology-Ny. 2004;18:1767–+. [Google Scholar]
- 15.Normanno N, De Luca A, Bianco C, Strizzi L, Mancino M, Maiello MR, Carotenuto A, De Feo G, Caponigro F, Salomon DS. Gene. 2006;366:2–16. doi: 10.1016/j.gene.2005.10.018. [DOI] [PubMed] [Google Scholar]
- 16.Kang DSDS, Leeb-Lundberg LMF. Mol Pharmacol. 2002;62:762–762. doi: 10.1124/mol.62.2.281. [DOI] [PubMed] [Google Scholar]
- 17.Krupnick JG, Santini F, Gagnon AW, Keen JH, Benovic JL. J Biol Chem. 1997;272:32507–32512. doi: 10.1074/jbc.272.51.32507. [DOI] [PubMed] [Google Scholar]
- 18.Arteaga CL, Johnson DH. Curr Opin Oncol. 2001;13:491–498. doi: 10.1097/00001622-200111000-00012. [DOI] [PubMed] [Google Scholar]
- 19.Ciardiello F. Drugs. 2000;60:25–32. doi: 10.2165/00003495-200060001-00003. [DOI] [PubMed] [Google Scholar]
- 20.Herbst RS. Oncology-Ny. 2002;16:19–24. [PubMed] [Google Scholar]
- 21.Herbst RS, Hong WK. Semin Oncol. 2002;29:1–2. doi: 10.1053/sonc.2002.35644. [DOI] [PubMed] [Google Scholar]
- 22.Herbst RS, Hong WK. Semin Oncol. 2002;29:18–30. doi: 10.1053/sonc.2002.35644. [DOI] [PubMed] [Google Scholar]
- 23.Krause DS, Van Etten RA. New Engl J Med. 2005;353:172–187. doi: 10.1056/NEJMra044389. [DOI] [PubMed] [Google Scholar]
- 24.Paez JG, Janne PA, Lee JC, Tracy S, Greulich H, Gabriel S, Herman P, Kaye FJ, Lindeman N, Boggon TJ, Naoki K, Sasaki H, Fujii Y, Eck MJ, Sellers WR, Johnson BE, Meyerson M. Science. 2004;304:1497–1500. doi: 10.1126/science.1099314. [DOI] [PubMed] [Google Scholar]
- 25.Normanno N, Gullick WJ. Endocr-Relat Cancer. 2006;13:3–6. doi: 10.1677/erc.1.01185. [DOI] [PubMed] [Google Scholar]
- 26.Adams GP, Weiner LM. Nat Biotechnol. 2005;23:1147–1157. doi: 10.1038/nbt1137. [DOI] [PubMed] [Google Scholar]
- 27.Herbst RS, Shin DM. Cancer. 2002;94:1593–1611. doi: 10.1002/cncr.10372. [DOI] [PubMed] [Google Scholar]
- 28.Copeland RA, Pompliano DL, Meek TD. Nat Rev Drug Discov. 2006;5:730–739. doi: 10.1038/nrd2082. [DOI] [PubMed] [Google Scholar]
- 29.Swinney DC. Curr Opin Drug Disc. 2009;12:31–39. [PubMed] [Google Scholar]
- 30.Berggard T, Linse S, James P. Proteomics. 2007;7:2833–2842. doi: 10.1002/pmic.200700131. [DOI] [PubMed] [Google Scholar]
- 31.Butcher EC. Nat Rev Drug Discov. 2005;4:461–467. doi: 10.1038/nrd1754. [DOI] [PubMed] [Google Scholar]
- 32.Hopkins AL, Groom CR. Nat Rev Drug Discov. 2002;1:727–730. doi: 10.1038/nrd892. [DOI] [PubMed] [Google Scholar]
- 33.Chen Y, Nakamoto K, Niwa O, Corn RM. Langmuir. 2012;28:8281–8285. doi: 10.1021/la300656c. [DOI] [PMC free article] [PubMed] [Google Scholar]
- 34.Gan SD, Patel KR. J Invest Dermatol. 2013;133:E10–E12. doi: 10.1038/jid.2013.287. [DOI] [PubMed] [Google Scholar]
- 35.Chudakov DM, Lukyanov S, Lukyanov KA. Trends Biotechnol. 2005;23:605–613. doi: 10.1016/j.tibtech.2005.10.005. [DOI] [PubMed] [Google Scholar]
- 36.Giepmans BNG, Adams SR, Ellisman MH, Tsien RY. Science. 2006;312:217–224. doi: 10.1126/science.1124618. [DOI] [PubMed] [Google Scholar]
- 37.Medintz IL, Uyeda HT, Goldman ER, Mattoussi H. Nat Mater. 2005;4:435–446. doi: 10.1038/nmat1390. [DOI] [PubMed] [Google Scholar]
- 38.Malmqvist M. Biochem Soc T. 1999;27:335–340. doi: 10.1042/bst0270335. [DOI] [PubMed] [Google Scholar]
- 39.Haab BB. Proteomics. 2003;3:2116–2122. doi: 10.1002/pmic.200300595. [DOI] [PubMed] [Google Scholar]
- 40.Schasfoort RBM, Tudos AJ. Handbook of surface plasmon resonance. Royal Society of Chemistry; Cambridge: 2008. [Google Scholar]
- 41.Li Y, Lee HJ, Corn RM. Anal Chem. 2007;79:1082–1088. doi: 10.1021/ac061849m. [DOI] [PMC free article] [PubMed] [Google Scholar]
- 42.Zhou WJ, Halpern AR, Seefeld TH, Corn RM. Anal Chem. 2012;84:440–445. doi: 10.1021/ac202863k. [DOI] [PubMed] [Google Scholar]
- 43.Seefeld TH, Halpern AR, Corn RM. J Am Chem Soc. 2012;134:12358–12361. doi: 10.1021/ja304187r. [DOI] [PMC free article] [PubMed] [Google Scholar]
- 44.Liang WB, Wang SP, Festa F, Wiktor P, Wang W, Magee M, LaBaer J, Tao NJ. Anal Chem. 2014;86:9860–9865. doi: 10.1021/ac5024556. [DOI] [PMC free article] [PubMed] [Google Scholar]
- 45.MacGriff C, Wang SP, Wiktor P, Wang W, Shan XN, Tao NJ. Anal Chem. 2013;85:6682–6687. doi: 10.1021/ac400475z. [DOI] [PubMed] [Google Scholar]
- 46.Wang W, Yang YZ, Wang SP, Nagaraj VJ, Liu Q, Wu J, Tao NJ. Nat Chem. 2012;4:846–853. doi: 10.1038/nchem.1434. [DOI] [PMC free article] [PubMed] [Google Scholar]
- 47.Wang W, Yin LL, Gonzalez-Malerva L, Wang SP, Yu XB, Eaton S, Zhang ST, Chen HY, LaBaer J, Tao NJ. Sci Rep-Uk. 2014;4 doi: 10.1038/srep06609. [DOI] [PMC free article] [PubMed] [Google Scholar]
- 48.Syal K, Wang W, Shan XN, Wang SP, Chen HY, Tao NJ. Biosens Bioelectron. 2015;63:131–137. doi: 10.1016/j.bios.2014.06.069. [DOI] [PubMed] [Google Scholar]
- 49.Zhou Y, Goenaga AL, Harms BD, Zou H, Lou JL, Conrad F, Adams GP, Schoeberl B, Nielsen UB, Marks JD. Mol Cancer Ther. 2012;11:1467–1476. doi: 10.1158/1535-7163.MCT-11-1038. [DOI] [PMC free article] [PubMed] [Google Scholar]
- 50.Hulme EC, Trevethick MA. Brit J Pharmacol. 2010;161:1219–1237. doi: 10.1111/j.1476-5381.2009.00604.x. [DOI] [PMC free article] [PubMed] [Google Scholar]
- 51.Kurai J, Chikumi H, Hashimoto K, Yamaguchi K, Yamasaki A, Sako T, Touge H, Makino H, Takata M, Miyata M, Nakamoto M, Burioka N, Shimizu E. Clin Cancer Res. 2007;13:1552–1561. doi: 10.1158/1078-0432.CCR-06-1726. [DOI] [PubMed] [Google Scholar]
Associated Data
This section collects any data citations, data availability statements, or supplementary materials included in this article.