Abstract
Epidemiological studies suggest that diabetics may be more susceptible to the adverse health effects from exposure to high ambient concentrations of ozone, the primary oxidant gas in photochemical smog. While increased morbidity and mortality from ozone inhalation has been linked to disruption of normal cardiovascular and airway functions, potential effects on glucose and insulin homeostasis are not understood. We tested the hypothesis that ozone exposure would worsen metabolic homeostasis in KKAy mice, a genetic diabetic animal model. Male KKAy mice were exposed to 0.5 ppm ozone for thirteen consecutive weekdays, and then assessed for airway, adipose and systemic inflammation, glucose homeostasis, and insulin signaling. Ozone exposure caused increased plasma TNFα, as well as expression of VCAM-1, iNOS and IL-6 in both pulmonary and adipose tissues. Pro-inflammatory CD11b+Gr-1lo7/4hi macrophages were increased 200% in adipose tissue but unchanged in blood. Interestingly, glucose levels were not significantly different in the insulin tolerance test between air and ozone-expose mice, whereas fasting insulin levels and HOMA-IR in ozone-exposed animals were significantly reduced. These changes were accompanied by increased insulin signaling in skeletal muscle and liver, but not adipose tissues. Ozone also caused decreases in body weight and plasma leptin. Our results show that in addition to marked local and systemic inflammation, ozone increases insulin sensitivity that may be related to weight loss/leptin sensitization-dependent mechanisms in KKAy mice, warranting further study on the role of hyperglycemia in mediating cardiometabolic effects of ozone inhalation.
Keywords: ozone, inhalation exposure, inflammation, insulin sensitivity
Introduction
Type 2 diabetes mellitus (T2DM) is one of the fastest growing epidemics around the world, primarily due to impairments in insulin signaling and/or secretion. A number of studies have demonstrated that air pollution is a significant risk factor for T2DM (Liu et al., 2013). As one of the criteria air pollutants, ozone is primarily produced by photochemical reactions between oxides of nitrogen (NOx) and volatile organic compounds (VOCs). Increased ambient ozone levels have been shown to be significantly associated with insulin resistance in the Korean Elderly Environmental Panel study (Kim and Hong, 2012). In addition, several epidemiological studies have linked ozone inhalation to increased risk of death in diabetic patients (Zanobetti and Schwartz, 2011, Stafoggia et al., 2010). However, a significant number of other reports failed to demonstrate associations of ozone inhalation with diabetic mortality (Goldberg et al., 2013) or acute complications of diabetes (Dales et al., 2012, Tolbert et al., 2007, Lee et al., 2008, Chiu and Yang, 2009), suggesting that in contrast to its well-established adverse effects on the respiratory system, how ozone inhalation affects the development of T2DM and its complications has yet to be determined.
Over the last decade, a consensus has emerged that inflammation plays a central role in the pathogenesis of diverse cardiometabolic diseases encompassing T2DM. One recent controlled human exposure study showed that inhalation exposure to ozone causes increases in vascular markers of inflammation, changes in markers of fibrinolysis, and markers that affect autonomic control of heart rate and repolarization in healthy young volunteers (Devlin et al., 2012), supporting that ozone inhalation may cause adverse cardiometabolic effects through induction of systemic and/or local inflammations. Inhalation exposure to ozone has also been shown to induce glucose intolerance and systemic metabolic effects in young and aged Brown Norway rats (Bass et al., 2013). More recently, Vella et al reported that inhalation exposure to ozone triggers insulin resistance through muscle c-Jun N-terminal Kinases (JNKs) activation in rats (Vella et al., 2014). These studies together provide compelling evidence that ozone inhalation may be implicated in the pathogenesis of T2DM through the induction of insulin resistance.
It is noteworthy that these aforementioned controlled human exposure and toxicological studies all used normoglycemic subjects. Interestingly, there are several studies showing that hyperglycemic animals have increased pulmonary injury and inflammation in response to ozone inhalation (Johnston et al., 2008, Johnston et al., 2006, Shore, 2007, Shore et al., 2003, Shore et al., 2008), indicating that hyperglycemia may modulate the response to ozone inhalation. Given the continuously increasing number of T2DM patients around the world, there is an urgent need of assessing the effects of inhalation exposure to ozone on insulin sensitivity and glucose homeostasis in the context of T2DM. KKAy mice are a model of obese type II diabetes, which develop severe hyperglycemia, hyperinsulinemia, and insulin resistance in early life (Iwatsuka et al., 1970). In the present study, to determine the effects of ozone inhalation on glucose homeostasis in the context of diabetes, KKAy mice were subjected to 3 weeks (13 consecutive weekdays) of inhalation exposure to ozone, and the effects of ozone inhalation on insulin sensitivity/glucose homeostasis were assessed by multiple measurements.
Materials and Methods
Animals
Michigan State University (MSU) is an AAALAC accredited institution. All procedures of this study were approved by the Institutional Animal Care and Use Committee (IACUC) at MSU, and all the animals were treated humanely and with regard for alleviation of suffering. Male KKAy mice (4–5 weeks old) were purchased from The Jackson Laboratory (Stock # 002468, Bar Harbor, ME) and were allowed to acclimate for two weeks in animal facilities at the Michigan State University before beginning inhalation exposure protocols.
Ozone Exposure
Inhalation exposures to ozone were conducted at MSU’s University Research Containment Facility. Mice (8/group) were exposed to filtered air (Air), or ozone (O3; 0.5 ppm) 4 hours/day from 8:00 am-12:00 pm, for 13 consecutive weekdays. Previous study demonstrated that exposure to 0.8 ppm O3 significantly induced insulin resistance in rats (Vella et al. 2014). Given that the respiratory ratio (l.min−1.kg−1) of rats is 63% of mouse’s (www.dtic.mil/cgi-bin/GetTRDoc?AD=ADA33 6351), 0.5 (=0.8 * 63%) ppm O3 were used in the present study. In addition, considering the severe hyperglycemia developed in KKAy mice by the age of 9 weeks as shown in a preliminary study, which even made it difficult to perform IPGTT, the exposure duration of 13 consecutive weekdays (5 days/first 2 weeks and 3 days/third week, 4h/day, with no exposures over the intervening weekends) was selected. During the exposure procedures, mice were individually housed and exposed to ozone in whole body inhalation exposure chambers (H-1000; Lab Products Maywood, NJ). Ozone-exposed mice received 0.496 ± 0.001 ppm ozone (mean daily concentrations ± standard error of the mean) over the 13 consecutive weekdays. Filtered-air exposed mice received the same exposure regimen, but at ozone chamber concentrations below 0.01 ppm. Average chamber temperature and humidity during these exposures were 71.6 ± 0.1°F and 43.4 ± 1.0%, respectively. Ozone was generated with an OREC 03V1 Clone ozone generator (Ozone Research and Equipment Corp., AZ) using compressed air as a source of oxygen, and monitored with a Dasibi 1003 AH ambient air ozone monitor (Dasibi Environmental Corp., Glendale, CA) during daytime. All mice were euthanized 22 hours after the last exposure.
Intraperitoneal Insulin Tolerance Test (ITT)
Two hours after the last exposure (thus fasted for 6 hours in total), baseline blood glucose and body weights were measured. Baseline blood was collected by tail vein puncture, and plasma was isolated and immediately kept at −80 °C for insulin assessment. Insulin levels were determined using an Ultra Sensitive Mouse Insulin ELISA Kit (Crystal Chem Inc., Downers Grove, IL). After intraperitoneal injection of 5.2 nmol/kg body weight Novalin insulin (Novo Norkisk, Denmark), blood was collected by tail vein puncture and glucose was measured at 15, 30, 60, 90, 120, and 130 min by a Contour Blood Glucose Meter (Bayer, Mishawaka, IN).
Tissue Collection and In Vitro Insulin Treatment
After anesthetized, whole blood was collected from heart and centrifuged at 3000 rpm for 5 minutes. Plasma was stored in −80 °C immediately and the precipitated cells were re-suspended in 1X red blood cells lysis buffer (Biolegend, San Diego, CA) for flow cytometry. After removing the heart and lung, the tracheobronchial and mediastinal nodes were exposed and collected in DMEM (Gibco, Pittsburg, PA). Then pulmonary lymph nodes were dissociated and filtered through 100um cell strainer to prepare for single cell suspension. Liver, left epididymal fat pad, brown adipose tissue from interscapular depot and skeletal muscle from gastrocnemius were then isolated. A thin slice of tissue (0.5 cm X 0.5 cm X 0.2 cm) was incubated in DMEM, 5% FCS with insulin (3.4 nmol/L) for 5 minutes in 37 ºC, 5% CO2 incubator. All tissues were kept at −80 °C until the indicated assessment was performed.
Adipose Stromal Vascular Fraction (SVF) Isolation
At necropsy, the stromal vascular fraction (SVF) was immediately isolated from epididymal fat by digesting with collagenase type II. Briefly, around 1g adipose tissues were extensively rinsed in PBS, minced and then digested with 1 mg/mL collagenase type II from Clostridium histolyticum (Sigma, St. Louis, MO) in DMEM with 5% FCS at 37 °C water bath with a shaking speed of 140 rpm for 30 min. The mix was then filtered through a 100 μm nylon cell strainer (BD Biosciences, San Jose, CA), followed by centrifugation at 300 × g for 5 min. The cells were then lysed with 1× RBC lysing buffer (Sigma, St. Louis, MO) for 5 min to get rid of contaminating red blood cells. After washing with PBS, the resulting pellets (SVF) were re-suspended with PBS and analyzed with flow cytometry.
Flow Cytometry
All antibodies used in flow cytometry were purchased from BioLegend (San Diego, CA) or BD (San Jose, CA). 100 μL cell suspension containing 1 × 10⁶ cells were pre-incubated with anti-mouse CD16/32 Fcγ III/II receptor (BD, San Jose, CA) at 4 °C for 15 min, and then stained with the indicated antibodies at 4°C for 30 min. After washing with PBS, cells were analyzed on a BD LSRII cytometer (BD, San Jose, CA).
Western Blot Analysis: Tissues or cell lysates were prepared using radioimmunoprecipitation analysis (RIPA) buffer (Sigma, St. Louis, MO) supplemented with protease and phosphatase inhibitors. Protein samples were then separated by 10% SDS-polyacrylamide gel electrophoresis and electroblotted onto polyvinylidene fluoride membranes. Target proteins were detected by primary antibodies as follows: mouse anti-β-actin (Sigma, St. Louis, MO), mouse anti-eNOS (BD, Franklin Lakes, NJ), rabbit anti-phospho-eNOS (Ser1177) (Cell Signaling, Boston, MA), rabbit anti-phospho-Akt (Thr308) (Cell Signaling, Boston, MA), and rabbit anti-heme oxygenase-1 (HO-1; Abcam, Cambridge, MA). Secondary antibodies conjugated with horseradish peroxidase and chemiluminescence reagent (Amersham, Marlborough, MA) were used to visualize the target proteins. Densities of target protein bands were determined with Quantity One 4.4.1 (Bio-Rad, Hercules, CA). The internal control, β-actin, was used to normalize loading variations.
Real-Time PCR
Total RNAs were isolated from the indicated tissues of FA or O3-exposed mice using Trizol® Reagent (Life Technologies, Grand Island, NY). The first strand DNA was synthesized from mRNA using a High Capacity cDNA Reverse Transcriptase Kit (Life Technologies, Grand Island, NY) according to the manufacturer’s instruction. The quantitative real-time PCR analysis was performed on a light 480 real-time PCR System (Roche Applied Science, Indianapolis, IN) following the standard procedure. Target genes were amplified using a LightCycler® 480 SYBR Green I Master kit (Roche Applied Science, Indianapolis, IN). The primers used for real-time PCR are described here: glyceraldehyde-3-phosphate dehydrogenase (GAPDH): sense, 5′-TGA ACG GGA AGC TCA CTG G-3′, antisense, 5′-TCC ACC ACC CTG TTG CTG TA-3′; tumor necrosis factor-α (TNFα): sense, 5′-GGC ACC ACT AGT TGG TTG TCT TTG-3′, antisense, 5′-AGA AAT GCA GTC AGC ACC ATC AAG-3′; interleukin-6 (IL-6): sense, 5′-TGA TGC TGG TGA CAA CCA CGG C-3′, antisense, 5′-TAA GCC TCC GAC TTG TGA AGT GGT A-3′); E-selectin: sense, 5′-GGC CAG CGC AGG TTG AAT GC-3′, antisense, 5′-ATG TTG CCC TGC TGT GGC GC-3′; intercellular adhesion molecule 1 (ICAM-1): sense, 5′-CCG GTC CTG ACC CTG AGC CA-3′, antisense, 5′-ATT GGA CCT GCG GGG TGG GT-3′;iNOS
Sense,5′-CTG CTG GTG GTG ACA AGC ACA TTT-3′,antisense5′ ATG TCA TGA GCA AAG GCG CAG AAC-3′ and vascular cell adhesion molecule 1 (VCAM-1): sense, 5′-GGA GAC CTG TCA CTG TCA ACT G-3′, antisense, 5′-TCC ATT TCA CCA CTG TGT AAC C-3′. Fold changes of mRNA levels were determined after normalization to internal control β-actin RNA levels.
ELISA for Plasma Cytokines and Hormones
After 6-hour fasting, plasma was prepared from anti-coagulated whole blood by centrifugation at 2000 g for 15 min. Plasma insulin, adiponectin, and leptin levels were measured using a Mouse Insulin ELISA kit (Crystal Chem Inc., Downers Grove, IL), Quantikine® Mouse Leptin Immunoassay kit, and Quantikine® Mouse Leptin Immunoassay kit (R&D Systems, Minneapolis, MN) as instructed by the manufacturer.
Homeostasis Model Assessment-Insulin Resistance (HOMA-IR) Calculation
The HOMA-IR index of each mouse was calculated using the values of fasting plasma glucose (FPG) and plasma insulin (PI) as follows: HOMA-IR = FPG×PI×172.1/22.5, with FPG expressed as mmol/L and PI as ng/ml.
Statistical Analysis
Data are expressed as mean ± SEM. The results were analyzed by unpaired t test using Graphpad Prism v5.0 (GraphPad Software, San Diego, CA). A P value of < 0.05 was considered as statistically significant.
Results
The effect of inhalation exposure to ozone on insulin sensitivity
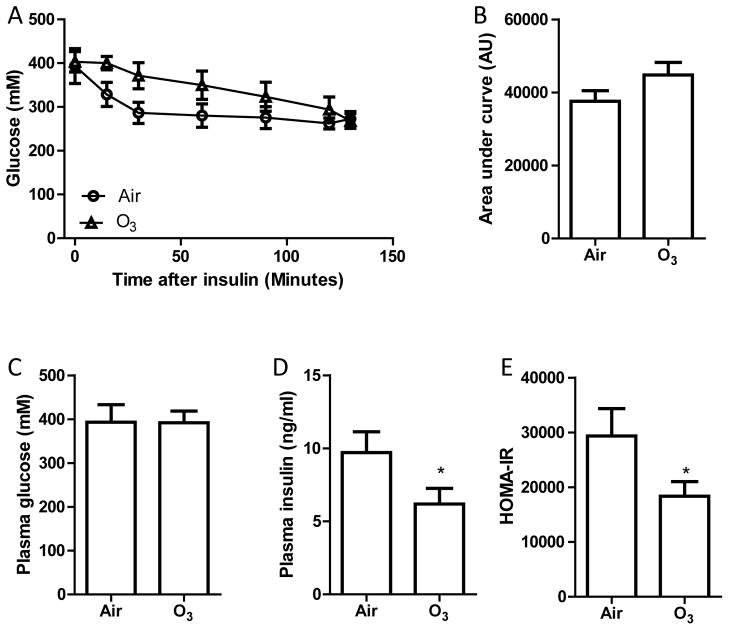
In a preliminary study, we found that because of the severe hyperglycaemia and insulin resistance in KKAy mice, the plasma glucose levels after intraperitoneal injection of one frequently used dosage of glucose (2 grams/kg body mass) were far beyond the test range of glucometer. Therefore, after 13 days of inhalation exposure to filter air (Air) or ozone (O3), KKAy mice were subjected to ITT to assess the effects of ozone inhalation on insulin sensitivity and glucose metabolism. Figures 1A and B show that inhalation exposure to ozone did not significantly change the response of KKAy mice to exogenous insulin. Consistently, Figure 1C reveals that 13 days of ozone inhalation did not significantly alter fasting plasma glucose. However, as shown in Figures 1D and E, ozone inhalation significantly decreased the fasting plasma insulin levels and HOMA-IR, suggesting that subacute ozone inhalation may ameliorate systemic insulin resistance in hyperglycemic KKAy mice.
Figure 1. Ozone inhalation increases insulin sensitivity in KKAy mice.
KKAy mice were exposed to air or ozone for 13 days. After 6-hour fasting (2 hours after the last exposure), these mice were subjected to ITT. A, the plasma glucose levels at different time points after intraperitoneal injection of insulin. B, the area under curve of ITT. C, fasting blood glucose levels. D, fasting plasma insulin levels. E, HOMA-IR. *p<0.05 vs Air, student’s t test. n=8/group.
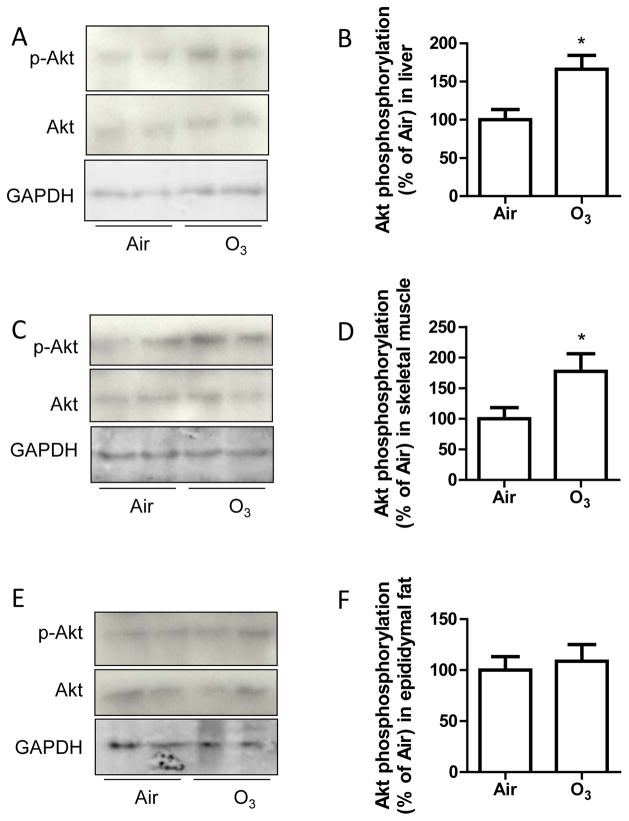
Akt phosphorylation is a key downstream marker in the intracellular signal transduction of insulin. To verify the effects of inhalation exposure to ozone on insulin sensitivity, liver, skeletal muscle, and adipose tissues were collected from Air- or ozone-exposed animals and treated with insulin for 5 minutes. Figure 2 reveals that ozone-exposed animals had significantly increased Akt phosphorylation levels in liver and skeletal muscle, but not in adipose tissues, recapitulating that ozone exposure increases insulin sensitivity in hyperglycemic KKAy mice.
Figure 2. Ozone inhalation enhances insulin-induced Akt phosphorylation in tissues.
KKAy mice were exposed to air or ozone for 13 days, and liver, skeletal muscle, and epididymal fat tissues were collected and treated with insulin (0.5 U/ml) for 5 minutes. Akt ser473 phosphorylation levels in liver (A and B), skeletal muscle (C and D), and epididymal adipose tissues (E and F) were analysed by western blot. *p<0.05 vs Air, student’s t test. n=8/group.
Inhalation exposure to ozone reduces gain of body weight
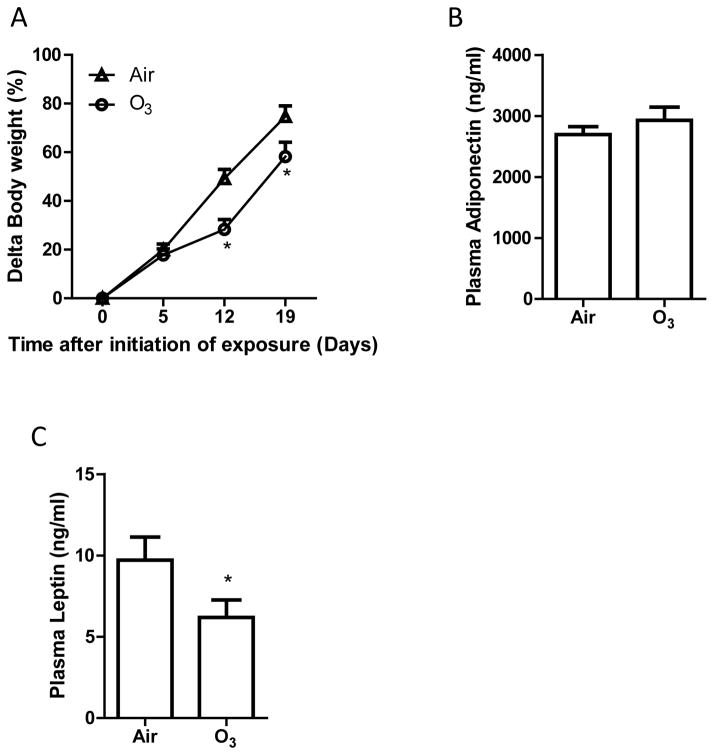
It has been well established that body weight is associated with insulin sensitivity in both animal models and human beings (Shulman, 2014). Figure 3A demonstrates that after 9 days of inhalation exposure to ozone, weight gain of ozone-exposed KKAy mice was significantly less than that of Air-exposed control animals, and this difference was maintained throughout the remaining duration of exposure. In contrast, we did not observe any significant difference in the weights of inducible brown adipose tissues (Air versus O3 in mean ± SEM: 157 ± 5 versus 131 ± 7 mg. p > 0.05, student’s t test, n = 8/group) and epididymal adipose tissues (Air versus O3 in mean ± SD: 1.39 ± 0.04 versus 1.17 ± 0.09 g. p > 0.05, student’s t test, n = 8/group).
Figure 3. Ozone inhalation reduces weight gain and decreases plasma leptin levels.
The body weights of Air- and ozone-exposed KKAy mice were measured weekly, and the body weight gain is presented. *p<0.05 vs Air, two way ANOVA. n=8/group. B and C: After 13 days of inhalation exposure to ozone or air, KKAy mice were euthanized, and the levels of adiponectin (B) and leptin (C) were assessed by ELISA. *p<0.05 vs Air, student’s t test. n=8/group.
Inhalation exposure to ozone decreases plasma leptin levels
Both adiponectin and leptin are associated with body weight and play a critical role in regulation of insulin sensitivity and glucose metabolism (Shulman, 2014). Consistent with its effects on body weight, Figure 3C shows that inhalation exposure to ozone significantly decreased plasma leptin levels. In contrast, ozone exposure did not significantly change plasma adiponectin levels (Figure 3B).
Inhalation exposure to ozone increases pro-inflammatory macrophages in adipose tissues
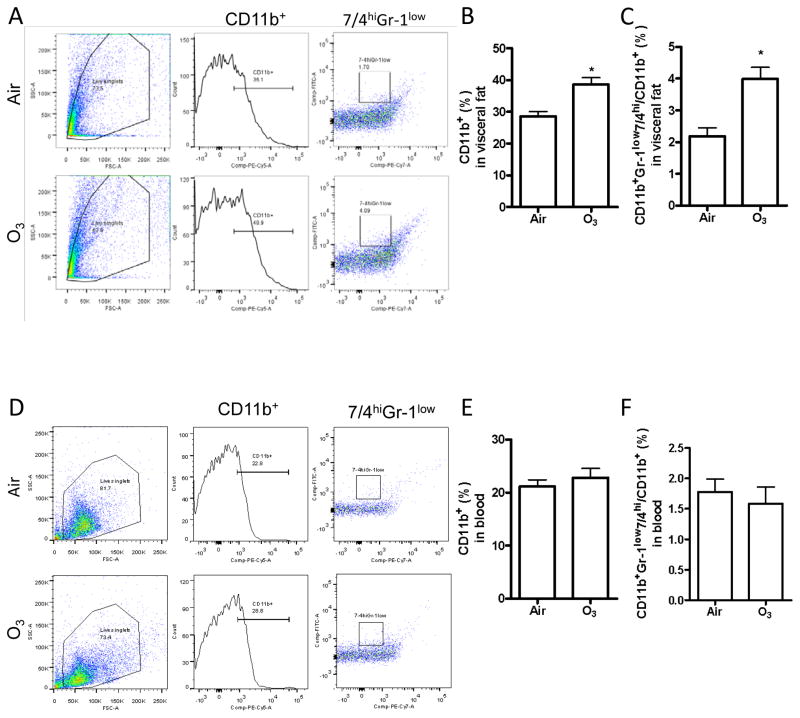
It has been well established that inflammation, in particular in adipose tissues, plays a central role in obesity-associated insulin resistance, and the macrophage is central in these inflammatory responses (Shulman, 2014). Figures 4B and E demonstrate that inhalation exposure to ozone significantly increased macrophage (CD11b+ cells) infiltration in epididymal adipose tissues but not in blood. Because the diversity of macrophages has been well established and CD11b+Gr-1lo7/4hi cells are believed to be the primary pro-inflammatory macrophages, we next profiled the subsets of macrophages in epididymal adipose tissues. Figures 4C and F reveal that inhalation exposure to ozone also significantly increased the infiltration of CD11b+Gr-1lo7/4hi cells in epididymal adipose tissue but not in blood.
Figure 4. Ozone inhalation induces inflammation in adipose tissues.
After exposure to air or ozone for 13 days, macrophage infiltration and activation in response to ozone exposure was assessed by flow cytometry. Cells were isolated from epididymal adipose tissues (A–C) and blood (D–F). Both representative plots of flow cytometric analysis (A and C) and the richness of total (CD11b+, B and E) and pro-inflammatory (CD11b+Gr-1low7/4hi, C and F) macrophages are presented. *p<0.05 vs Air, student’s t test. n=8/group.
Inhalation exposure to ozone induces local and systemic inflammation
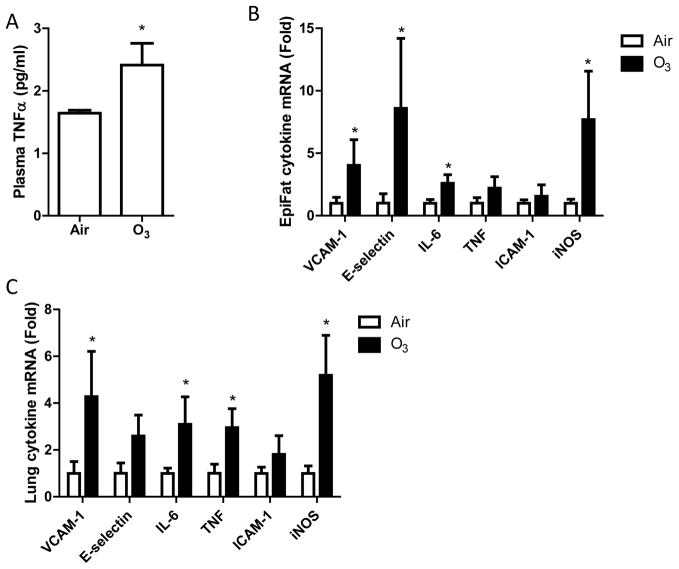
Since inhalation exposure to ozone has been shown to induce marked inflammation (Devlin et al., 2012), which may affect insulin sensitivity, we assessed the pro-inflammatory cytokine level in blood and other organs. Figure 5A shows that exposure to ozone markedly increased plasma TNFα protein levels. Consistently, exposure to ozone significantly increased the mRNA expression levels of pro-inflammatory genes including VCAM-1, E-selectin, IL-6, and iNOS in epididymal adipose tissues (Figure 5B) and VCAM-1, IL-6, TNFα, and iNOS in lung (Figure 5C), demonstrating that exposure to ozone induces both systemic and local inflammations.
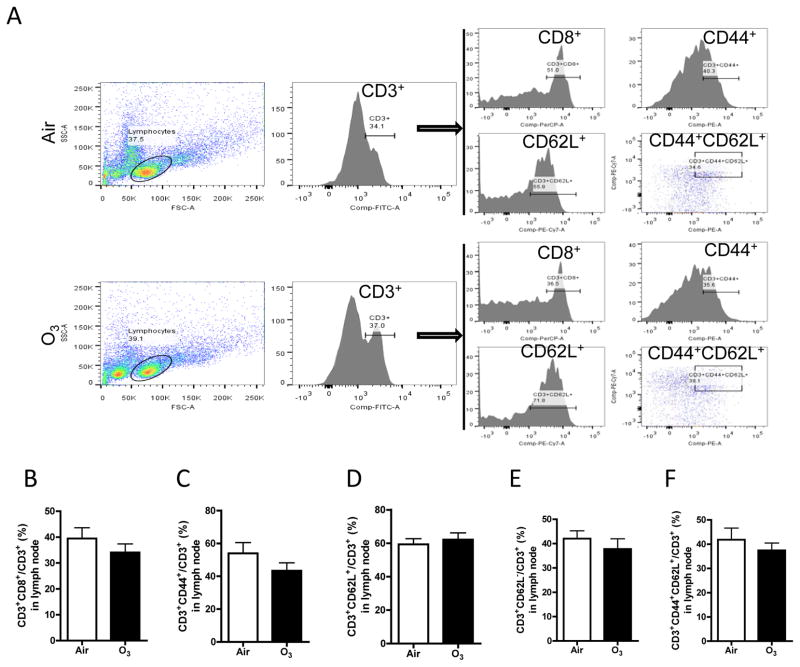
Figure 5. Ozone inhalation does not change the profile of T cell subsets.
After exposure to air or ozone for 13 days, mediastinal lymph nodes were collected, and T cell subsets were profiled with flow cytometry. A, representative plots of flow cytometric analysis. B–F, the richness of T cell subsets defined by the expression of indicated surface markers.
Inhalation exposure to ozone does not change T cell profile
T cells are professional immune cells that play a key role in the regulation of inflammatory responses and thus glucose homeostasis. A number of studies have demonstrated that T cell profile is associated with inflammation and insulin sensitivity. Figure 6 shows that exposure to ozone did not significantly change the profile of T cells isolated from pulmonary lymph nodes, suggesting that the role of T cells in ozone-induced inflammation may be trivial in our model.
Figure 6. Ozone inhalation induces extra-pulmonary inflammation.
After exposure to air or ozone for 13 days, pro-inflammatory cytokine levels in blood, epididymal fat tissues, and lung were assessed. A, plasma TNFα protein levels, measured by ELISA. *p<0.05 vs Air, student’s t test. n=8/group. B and C, pro-inflammatory gene mRNA expression in epididymal fat tissues (B) and lung (C), assessed by real-time RT-PCR. *p<0.05 vs Air, one way ANOVA. n=8/group.
Discussion
In direct contrast to our results, previous toxicological studies have demonstrated that ozone inhalation can induce insulin resistance in several animal models (Bass et al., 2013, Vella et al., 2014). Notably, all these animal models do not have pre-existing hyperglycaemia and generally have a lean phenotype. Thus, our results also called attention to the role of obesity and/or hyperglycaemia in the determination of the effects of ozone inhalation on insulin sensitivity. It has been demonstrated that ozone inhalation induced exaggeration of pulmonary inflammatory responses in obese human subjects (Alexeeff et al., 2007, Bennett et al., 2007) and obese diabetic animals including ob/ob, db/db, Cpefat and high fat diet (HFD)-fed mice (Johnston et al., 2008, Johnston et al., 2006, Shore, 2007, Shore et al., 2003, Shore et al., 2008), strongly supporting that obesity and/or hyperglycaemia play a role in determining the effects of ozone inhalation. Along with these studies, our data warrant further studies on the role of obesity and/or hyperglycaemia in determining the effects of ozone inhalation on insulin sensitivity.
Body weight is inversely associated with insulin sensitivity (Shulman, 2014). The present data show that coinciding with the increased insulin sensitivity, ozone inhalation significantly decreased body weight gain. This is consistent with one previous report showing that 72 hours of inhalation exposure to 0.3 ppm ozone significantly decreased body weight of wildtype and IL-6 knockout mice (Shore et al., 2009). Interestingly, this study further show that IL-6 deficiency significantly reduced ozone inhalation-induced pulmonary inflammation and injury but not ozone inhalation-induced decrease in body weight, suggesting that they are two independent effects of ozone inhalation. It is also consistent with 5 days exposure to 0.5 ppm study in rats (Cottet-Emard et al., 1997), which showed weight loss in initial two days and slower weight gain. Leptin is closely correlated to body weight, and plays an important role in glucose homeostasis (Moon et al., 2013). Consistent with the body weight effect, our data show that ozone inhalation significantly reduced plasma leptin levels. It is notable that although leptin is believed to have the capability of ameliorating insulin sensitivity, administration of leptin improves insulin sensitivity and glucose homeostasis only in a context that leptin is low or deficient (Moon et al., 2013). Administration of exogenous leptin in human patients or animal models with hyperleptinemia does not decrease body weight or ameliorate hyperglycemia, known as leptin resistance. Interestingly, compared to the level of leptin in wildtype mice (Saravanan and Pari, 2015), our data reveal that KKAy mice have marked hyperleptinemia (9.72 ± 3.04 pg/ml in KKAy versus 1.23 ± 0.09 pg/ml in C57Bl/6j, Figure 3C). Therefore, the decrease in plasma leptin level in response to ozone inhalation may not only reflect that ozone inhalation ameliorates leptin resistance but also may contribute to the effect of ozone inhalation on insulin sensitivity. In agreement with this notion, leptin has been shown to reduce the effects of ozone inhalation on pulmonary mechanics and airway responsiveness but not pulmonary inflammation (Johnston et al., 2007), suggesting that leptin can be an important mediator for ozone inhalation-induced inflammation-independent effects.
Although our data demonstrate ozone inhalation may have beneficiary effects on glucose homeostasis in the face of hyperglycemia, the present study also replicated those well-known toxicological effects of ozone inhalation such as pulmonary injury (data not shown) and inflammation (Figure 6C), reaffirming the health concern of ozone inhalation. Furthermore, our data reveal that ozone inhalation induced marked systemic inflammation as evidenced by increases in plasma TNFα level, mRNA expression of pro-inflammatory cytokines in epididymal adipose tissues and lung, and pro-inflammatory macrophage infiltration in epididymal adipose tissues. These results are consistent with a number of studies showing the induction of systemic and local inflammation by ozone inhalation (White and Martin, 2010, Hollingsworth et al., 2007). Given that inflammation is well documented to play a role in the pathogenesis of many cardiometabolic diseases such as atherosclerosis and hypertension, further studies are required to assess the effects of ozone inhalation on these diseases.
Our study, although providing important new findings, has some limitations. These include the fact that due to the limited space of exposure chamber, no comparison between non-diabetic and diabetic mice was performed, which is important to verify the effects of hyperglycemia on the response to ozone inhalation. For the same reason, neither dose- nor time-dependency was analyzed in the present study. As studies have demonstrated adaptation of inflammatory and pulmonary responses to ozone (Zanobetti and Schwartz, 2008), time-dependency analysis is necessary to determine whether there is adaption of metabolic response to ozone. In addition, the air quality system (AQS) data demonstrate high spatiotemporal variability in the 8-h daily max O3 concentrations for the monitoring sites in USA (http://cfpub.epa.gov/ncea/isa/recordisplay.cfm?deid=247492), and the majority are lower than that used in the present study, dose-dependency analysis, in particular in the low range, is scientifically important.
Conclusions
Our data show that in addition to induction of a marked local and systemic inflammation, inhalation exposure to ozone increases insulin sensitivity probably through a weight loss/leptin sensitization-dependent mechanism in KKAy mice. These antithetical effects on insulin sensitivity may offer mechanistic insight into the inconsistency in epidemiological studies regarding the association between ozone inhalation and cardiometabolic diseases. The disconnect between inflammation and insulin resistance in our T2DM model warrant further study on the role of hyperglycemia in mediating cardiometabolic effects of ozone inhalation.
Acknowledgments
This work was supported in part by a U.S. Environmental Protection Agency Clean Air Research Center grant (R83479701 to Drs. Rajagopalan, Sun and Harkema), the National Natural Science Foundation of China (Grant No. 81270342 to Dr. Ying), the American Heart Association (13SDG17070131 to Dr. Ying), the National Institutes of Health (R01ES024516 to Dr. Ying, R01ES013406 and R01ES015146 to Dr. Rajagopalan), and the National Natural Science Foundation of China (Grant No. 81500216 to Dr. Chen).
Footnotes
Declaration of Interest
The authors report no declarations of interest.
Contributor Information
Zhekang Ying, Email: zying@medicine.umaryland.edu.
Katryn Allen, Email: katryn.m.allen@gmail.com.
Jixin Zhong, Email: jzhong@medicine.umaryland.edu.
Minjie Chen, Email: mchen3@medicine.umaryland.edu.
Keisha M. Williams, Email: williamsk29@michigan.gov.
James G. Wagner, Email: wagnerja@cvm.msu.edu.
Ryan Lewandowski, Email: lewando2@msu.edu.
Qinghua Sun, Email: qinghua.sun@osumc.edu.
Sanjay Rajagopalan, Email: srajagopalan@medicine.umaryland.edu.
Jack R. Harkema, Email: harkemaj@msu.edu.
References
- ALEXEEFF SE, LITONJUA AA, SUH H, SPARROW D, VOKONAS PS, SCHWARTZ J. Ozone exposure and lung function: effect modified by obesity and airways hyperresponsiveness in the VA normative aging study. Chest. 2007;132:1890–7. doi: 10.1378/chest.07-1126. [DOI] [PubMed] [Google Scholar]
- BASS V, GORDON CJ, JAREMA KA, MACPHAIL RC, CASCIO WE, PHILLIPS PM, LEDBETTER AD, SCHLADWEILER MC, ANDREWS D, MILLER D, DOERFLER DL, KODAVANTI UP. Ozone induces glucose intolerance and systemic metabolic effects in young and aged Brown Norway rats. Toxicol Appl Pharmacol. 2013;273:551–60. doi: 10.1016/j.taap.2013.09.029. [DOI] [PMC free article] [PubMed] [Google Scholar]
- BENNETT WD, HAZUCHA MJ, FOLINSBEE LJ, BROMBERG PA, KISSLING GE, LONDON SJ. Acute pulmonary function response to ozone in young adults as a function of body mass index. Inhal Toxicol. 2007;19:1147–54. doi: 10.1080/08958370701665475. [DOI] [PMC free article] [PubMed] [Google Scholar]
- CHIU HF, YANG CY. Air pollution and emergency room visits for arrhythmias: are there potentially sensitive groups? J Toxicol Environ Health A. 2009;72:817–23. doi: 10.1080/15287390902800405. [DOI] [PubMed] [Google Scholar]
- COTTET-EMARD JM, DALMAZ Y, PEQUIGNOT J, PEYRIN L, PEQUIGNOT JM. Long-term exposure to ozone alters peripheral and central catecholamine activity in rats. Pflugers Arch. 1997;433:744–9. doi: 10.1007/s004240050340. [DOI] [PubMed] [Google Scholar]
- DALES RE, CAKMAK S, VIDAL CB, RUBIO MA. Air pollution and hospitalization for acute complications of diabetes in Chile. Environ Int. 2012;46:1–5. doi: 10.1016/j.envint.2012.05.002. [DOI] [PubMed] [Google Scholar]
- DEVLIN RB, DUNCAN KE, JARDIM M, SCHMITT MT, RAPPOLD AG, DIAZ-SANCHEZ D. Controlled exposure of healthy young volunteers to ozone causes cardiovascular effects. Circulation. 2012;126:104–11. doi: 10.1161/CIRCULATIONAHA.112.094359. [DOI] [PubMed] [Google Scholar]
- GOLDBERG MS, BURNETT RT, STIEB DM, BROPHY JM, DASKALOPOULOU SS, VALOIS MF, BROOK JR. Associations between ambient air pollution and daily mortality among elderly persons in Montreal, Quebec. Sci Total Environ. 2013;463–464:931–42. doi: 10.1016/j.scitotenv.2013.06.095. [DOI] [PubMed] [Google Scholar]
- HOLLINGSWORTH JW, KLEEBERGER SR, FOSTER WM. Ozone and pulmonary innate immunity. Proc Am Thorac Soc. 2007;4:240–6. doi: 10.1513/pats.200701-023AW. [DOI] [PMC free article] [PubMed] [Google Scholar]
- IWATSUKA H, SHINO A, SUZUOKI Z. General survey of diabetic features of yellow KK mice. Endocrinol Jpn. 1970;17:23–35. doi: 10.1507/endocrj1954.17.23. [DOI] [PubMed] [Google Scholar]
- JOHNSTON RA, THEMAN TA, LU FL, TERRY RD, WILLIAMS ES, SHORE SA. Diet-induced obesity causes innate airway hyperresponsiveness to methacholine and enhances ozone-induced pulmonary inflammation. J Appl Physiol (1985) 2008;104:1727–35. doi: 10.1152/japplphysiol.00075.2008. [DOI] [PubMed] [Google Scholar]
- JOHNSTON RA, THEMAN TA, SHORE SA. Augmented responses to ozone in obese carboxypeptidase E-deficient mice. Am J Physiol Regul Integr Comp Physiol. 2006;290:R126–33. doi: 10.1152/ajpregu.00306.2005. [DOI] [PubMed] [Google Scholar]
- JOHNSTON RA, THEMAN TA, TERRY RD, WILLIAMS ES, SHORE SA. Pulmonary responses to acute ozone exposure in fasted mice: effect of leptin administration. J Appl Physiol (1985) 2007;102:149–56. doi: 10.1152/japplphysiol.00300.2006. [DOI] [PubMed] [Google Scholar]
- KIM JH, HONG YC. GSTM1, GSTT1, and GSTP1 polymorphisms and associations between air pollutants and markers of insulin resistance in elderly Koreans. Environ Health Perspect. 2012;120:1378–84. doi: 10.1289/ehp.1104406. [DOI] [PMC free article] [PubMed] [Google Scholar]
- LEE IM, TSAI SS, HO CK, CHIU HF, WU TN, YANG CY. Air pollution and hospital admissions for congestive heart failure: are there potentially sensitive groups? Environ Res. 2008;108:348–53. doi: 10.1016/j.envres.2008.07.024. [DOI] [PubMed] [Google Scholar]
- LIU C, YING Z, HARKEMA J, SUN Q, RAJAGOPALAN S. Epidemiological and experimental links between air pollution and type 2 diabetes. Toxicol Pathol. 2013;41:361–73. doi: 10.1177/0192623312464531. [DOI] [PMC free article] [PubMed] [Google Scholar]
- MOON HS, DALAMAGA M, KIM SY, POLYZOS SA, HAMNVIK OP, MAGKOS F, PARUTHI J, MANTZOROS CS. Leptin’s role in lipodystrophic and nonlipodystrophic insulin-resistant and diabetic individuals. Endocr Rev. 2013;34:377–412. doi: 10.1210/er.2012-1053. [DOI] [PMC free article] [PubMed] [Google Scholar]
- SARAVANAN S, PARI L. Role of thymol on hyperglycemia and hyperlipidemia in high fat diet-induced type 2 diabetic C57BL/6J mice. Eur J Pharmacol. 2015;761:279–87. doi: 10.1016/j.ejphar.2015.05.034. [DOI] [PubMed] [Google Scholar]
- SHORE SA. Obesity and asthma: lessons from animal models. J Appl Physiol (1985) 2007;102:516–28. doi: 10.1152/japplphysiol.00847.2006. [DOI] [PubMed] [Google Scholar]
- SHORE SA, LANG JE, KASAHARA DI, LU FL, VERBOUT NG, SI H, WILLIAMS ES, TERRY RD, LEE A, JOHNSTON RA. Pulmonary responses to subacute ozone exposure in obese vs. lean mice. J Appl Physiol (1985) 2009;107:1445–52. doi: 10.1152/japplphysiol.00456.2009. [DOI] [PMC free article] [PubMed] [Google Scholar]
- SHORE SA, RIVERA-SANCHEZ YM, SCHWARTZMAN IN, JOHNSTON RA. Responses to ozone are increased in obese mice. J Appl Physiol (1985) 2003;95:938–45. doi: 10.1152/japplphysiol.00336.2003. [DOI] [PubMed] [Google Scholar]
- SHORE SA, WILLIAMS ES, ZHU M. No effect of metformin on the innate airway hyperresponsiveness and increased responses to ozone observed in obese mice. J Appl Physiol (1985) 2008;105:1127–33. doi: 10.1152/japplphysiol.00117.2008. [DOI] [PMC free article] [PubMed] [Google Scholar]
- SHULMAN GI. Ectopic fat in insulin resistance, dyslipidemia, and cardiometabolic disease. N Engl J Med. 2014;371:1131–41. doi: 10.1056/NEJMra1011035. [DOI] [PubMed] [Google Scholar]
- STAFOGGIA M, FORASTIERE F, FAUSTINI A, BIGGERI A, BISANTI L, CADUM E, CERNIGLIARO A, MALLONE S, PANDOLFI P, SERINELLI M, TESSARI R, VIGOTTI MA, PERUCCI CA. Susceptibility factors to ozone-related mortality: a population-based case-crossover analysis. Am J Respir Crit Care Med. 2010;182:376–84. doi: 10.1164/rccm.200908-1269OC. [DOI] [PubMed] [Google Scholar]
- TOLBERT PE, KLEIN M, PEEL JL, SARNAT SE, SARNAT JA. Multipollutant modeling issues in a study of ambient air quality and emergency department visits in Atlanta. J Expo Sci Environ Epidemiol. 2007;17(Suppl 2):S29–35. doi: 10.1038/sj.jes.7500625. [DOI] [PubMed] [Google Scholar]
- VELLA RE, PILLON NJ, ZARROUKI B, CROZE ML, KOPPE L, GUICHARDANT M, PESENTI S, CHAUVIN MA, RIEUSSET J, GELOEN A, SOULAGE CO. Ozone exposure triggers insulin resistance through muscle c-Jun N-terminal Kinases (JNKs) activation. Diabetes. 2014 doi: 10.2337/db13-1181. [DOI] [PubMed] [Google Scholar]
- WHITE CW, MARTIN JG. Chlorine gas inhalation: human clinical evidence of toxicity and experience in animal models. Proc Am Thorac Soc. 2010;7:257–63. doi: 10.1513/pats.201001-008SM. [DOI] [PMC free article] [PubMed] [Google Scholar]
- ZANOBETTI A, SCHWARTZ J. Is there adaptation in the ozone mortality relationship: a multi-city case-crossover analysis. Environ Health. 2008;7:22. doi: 10.1186/1476-069X-7-22. [DOI] [PMC free article] [PubMed] [Google Scholar]
- ZANOBETTI A, SCHWARTZ J. Ozone and survival in four cohorts with potentially predisposing diseases. Am J Respir Crit Care Med. 2011;184:836–41. doi: 10.1164/rccm.201102-0227OC. [DOI] [PMC free article] [PubMed] [Google Scholar]


