Abstract
In evaluating research investments, it is important to establish whether the expertise gained by researchers in conducting their projects propagates into the broader economy. For eight universities, it was possible to combine data from the UMETRICS project, which provided administrative records on graduate students supported on funded research, with data from the U.S. Bureau of the Census. The analysis covers 2010-2012 earnings and placement outcomes of people receiving doctorates in 2009-2011. Almost 40% of supported doctorate recipients, both federally and non-federally funded, enter industry and, when they do, they disproportionately get jobs at large and high wage establishments in high tech and professional service industries. While PhD recipients spread nationally, there is also geographic clustering in employment near the universities that trained and employed the researchers. We also show large differences across fields in placement outcomes.
Ten years ago, Jack Marburger challenged academics to provide scientific evidence about the impact of research investments (1). The United States Congress has been even more insistent: requiring the National Science Foundation to “better articulate the value of grants to the national interest”. The aim of the current study is to investigate the impact of research by examining the labor market outcomes of doctoral recipients.
Little is known about where research-funded PhDs go when they graduate and enter the private sector, and even less is known about the characteristics of the businesses that employ them. Thus it has been difficult to capture the human dimension of the impact of research on the economy. What little evidence there is has been based on an analysis of patent clusters (2) (3), the geographic and industry placement of new PhDs (4)(5)(6), or on bibliometric approaches linking grants, patents and publications (7)(8). One noteworthy exception has been expensive - the United Kingdom spent over £34 million in explicit costs, and much more in implicit costs, to generate almost 7,000 case studies. Unfortunately they lack a common framework or shared standards of evidence and presentation. Consequently the extent to which this type of information provides rigorous, systematic, aggregate insights into economic value is far from clear (9).
We draw on recent investments to build administrative data that cover researchers supported on both federally and non-federally funded grants in eight major universities that are members of the Committee on Institutional Cooperation (CIC)(10). Participating universities are Indiana, Iowa, Michigan, Minnesota, Ohio State, Purdue, Penn State, and Wisconsin. Those data, derived from the CIC's UMETRICS project (11) provide the share of time charged to funded research projects by all people employed on them (from undergraduate and graduate students to postdocs to staff and faculty) as well as purchases on those projects. Graduate students were linked to their dissertations (from ProQuest) and to all subsequent employers and earnings in the United States through matches to Census Bureau data.
We document the 2010-2012 earnings and placement outcomes of people receiving doctorates in 2009-2011. The universities have provided identifiers that allow the UMETRICS data to be linked to administrative and survey data housed at the U.S. Census Bureau under strict confidentiality protocols. The data are protected by law and are for statistical use only (anonymized unique identifiers are used for match keys) and all results are reviewed to ensure that no identifiable information is disclosed. We performed two distinct but related analyses of the jobs obtained by doctoral recipients. The first describes the characteristics of the establishments and firms where people obtained jobs. The second emphasizes the earnings of individuals at those jobs.
Placement data were obtained from links to two files derived from administrative data and augmented by survey data: (i) the Business Register (BR), which is the universe of U.S. non-agricultural firms and associated establishments and (ii) the Longitudinal Business Database (LBD) which contains longitudinally linked data for all firms and associated establishments with paid employees in the United States (12, 13). These files were used to describe the characteristics of the establishments and firms that employ the UMETRICS doctoral recipients covered by the data (an establishment is the physical place where business is conducted, and the unit of observation at which industry and geographic location are defined; firms can own one or more establishments). The matched data were used to describe the sector and detailed industry classification of each establishment at which the recipients worked, the geographic location of their place of work, as well as characteristics related to productivity, such as size and payroll per worker (14). Age is determined at the firm level and establishments owned by R&D performing firms are identified from the Business Research & Development and Innovation Survey (15). SOM Table 1 lists variables analyzed, the level at which they are measured, and their source.
Individual earnings data were derived from links to administrative records. Details of the data construction and links are in the SOM, including SOM Figure 1 and SOM Tables 2A and 2B. De-identified versions of the UMETRICS data will be made available to the scholarly research community through a confidentially protected virtual digital enclave being developed at the Institute for Research on Innovation and Science (iris.isr.umich.edu)(10). Data integrated with Census data on people and on their employers and their employer's characteristics will be made available at the Federal Statistical Research Data Centers through a partnership between IRIS and the U.S. Census Bureau (http://www.census.gov/fsrdc) under strict confidentiality protections.
There were 3,197 graduate students on research payrolls at the sample universities in the period 2009-2011 who received a doctoral degree during that period and who were employed at a different institution in subsequent years. Table 1 summarizes the major sectors into which they flowed in the year after their separation from university employment and compares that to the sectors of employment the U.S. workforce as a whole, which provides a benchmark (but not a formal control) group. The majority (57.1%) went to academia - presumably many to postdoctoral positions. A large percentage (38.7%) found jobs in industry; notably about 17% in establishments owned by R&D performing firms (for comparison, 10.8% of the U.S. workforce is employed in such establishments) and about 21.7% in establishments owned by non R&D-performing firms (versus 75.0% of the U.S. workforce). Only a small percentage (4.1%) entered government.
Table 1.
Post-graduation employment of UMETRICS doctoral recipients paid on research grants.
| Industry | Academia | Government | All | ||
|---|---|---|---|---|---|
| R&D Firms | Non R&D Firms | ||||
| % Placed within Sector | 17.0% | 21.7% | 57.1% | 4.1% | 100.0% |
| National Sample (M) | 10.8% | 75.0% | 10.7% | 3.5% | 100.0% |
| Of those in sector, percent placed: | |||||
| % Within 50 Miles | 10.1% | 23.5% | 8.9% | 18.2% | 12.7% |
| % Within State | 16.6% | 36.0% | 18.0% | 25.8% | 22.0% |
Note. Sample based on 3,197 UMETRICS doctoral recipients paid by research funds at a university and separating from the university between 2010 and 2012. The national workforce distribution is calculated from all employment in all establishments covered by the Census's Longitudinal Business Database between 2010 and 2012
Table 1 provides evidence that research funding to these universities provides training to a workforce that participates in a national (and likely international) labor market. While we reserve a full analysis for future work, for each of the universities in our sample, over one in five doctoral recipients stay in the state of the university, and about 13% stay within 50 miles of the university. More doctoral recipients stay in the university's state than move to any other single state, with the exception of California, which receives more students from 2 of our 8 universities. The results are substantially unchanged when the sample is restricted to those supported on federal research grants only (SOM Table 3).
The data permit an even deeper examination of the geographic destinations of the doctoral recipients. For example, 19% of the doctoral recipients who left their university's state headed for California, which has only 12% of the U.S. population. We expect that this is partially due to the fact that more R&D is conducted in California than in any other state. SOM Figure 2 shows the states to which people moved and SOM Table 4 compares the locations of PhD recipients to R&D and population by state. The other major destination states in terms of numbers of graduates among people who leave the state where they trained are Illinois, New York, Texas, North Carolina, Massachusetts, Pennsylvania, and Washington (state), which either have a large share of R&D relative to population or are very populous.
It is also possible to examine the specific industries that are most likely to employ the sample of doctoral recipients paid on research grants (See SOM Table 5; SOM Table 6 reports results for doctoral recipients supported on federally funded projects). The employers are much more likely to be in industries such as engineering, high-tech and professional service fields (including medicine) than U.S. employers at large: for example, the shares of doctoral recipients employed in Pharmaceutical, and Medicine manufacturing, Semiconductors, and Computer Systems Design are between four and nineteen times the U.S. average. Uncommon employment destinations for doctoral recipients are Restaurants / Eating Places and Grocery Stores.
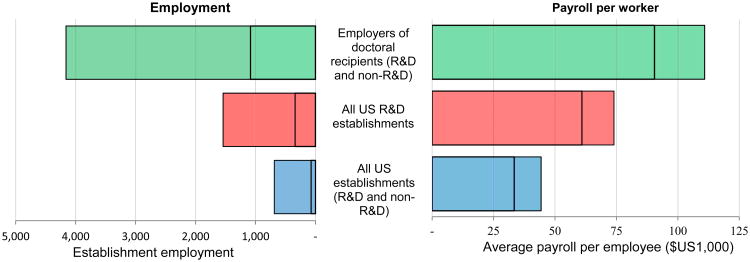
The establishment level data also permit an examination of the differences between the employers of the UMETRICS doctoral recipients being studied, the typical employer across the U.S. as a whole and the typical U.S. establishment owned by an R&D performing firm. The results of the analysis are presented in Figure 1. Because the distribution of establishments is highly skewed, it is informative to provide information on both the means and the medians. Figure 1 shows the median establishment employing the doctoral recipients in our sample has more employees (at 1084) than the national median (at 73) or even than establishments owned by R&D performing firms (341). We use payroll per worker (constructed by dividing total payroll by the number of employees) to measure the average earnings at establishments. The median establishment employing UMETRICS doctoral recipients also tends to have a higher payroll per worker (over $90,000) than the median U.S. establishment, which has a payroll per worker of just over $33,000, or the median establishment owned by an R&D performing firm, which has a payroll per worker of just under $61,000. The same results hold when we use the mean as the measure of central tendency.
Figure 1. UMETRICS Doctoral Recipients are placed at establishments that are larger and have higher payrolls per worker.
Note: The standard deviations in employment at establishments employing UMETRICS doctoral recipients, at all U.S. establishments owned by R&D performing firms, and all U.S. establishments are 6,407, 3,661 and 2,362 respectively; the standard deviations in payroll per worker are $120,199, $56,252 and $44,327 respectively; the differences in employment size and payroll per worker are statistically significant. Payroll per worker is the average payroll (the total payroll divided by the number of employees) across all employees at the three types of establishments - all U.S. establishments, all U.S. establishments owned by R&D performing firms, and the establishments employing UMETRICS doctoral recipients (regardless of whether they are owned by R&D performing firms). National and R&D establishments are weighted by total establishment employment, while Doctoral Recipient establishments are weighted by the number of doctoral recipients employed.
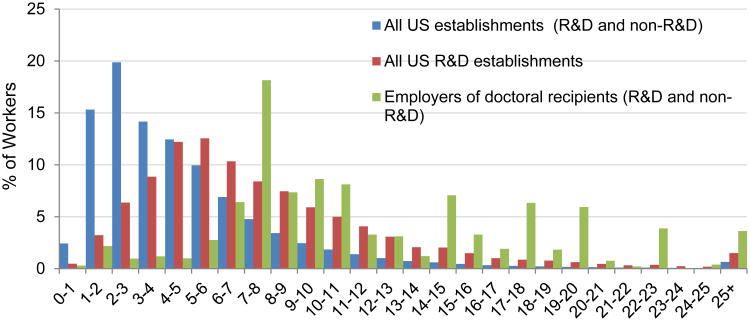
The data are rich enough to go beyond summary statistics and characterize the distribution of each measure for all establishments employing the workers under study. In particular, we calculated the payroll per worker for each establishment (regardless of R&D status) employing individuals in our sample, all U.S. establishments and all U.S. establishments owned by R&D-performing firms (regardless of whether they employ the doctoral recipients in our sample) and report the distribution of each in Figure 2. A comparison of the distributions shows that while only 8.3% of the U.S. workforce, and 24% of workers at establishments owned by R&D performing firms work at establishments with payrolls per worker in excess of $100,000, over half (51%) of the sample of doctoral recipients do. The results are consistent with the hypothesis that doctoral recipients are placed in establishments with characteristics usually associated with greater productivity.
Figure 2. Payroll per worker at establishments employing UMETRICS doctoral recipients, establishments owned by R&D performing firms, and all U.S. establishments.
Source: Authors' analysis of UMETRICS data linked to Census Bureau BR and LBD data. See notes to Figure 1. Payroll per worker in US$10,000.
It is possible to examine individual earnings outcomes, as well as the placement outcomes described above; the data also permit the statistical analysis of the relationship between a researcher's field of study (based on ProQuest Dissertation data) and subsequent placement and individual earnings. As above, the analysis is descriptive, not causal.
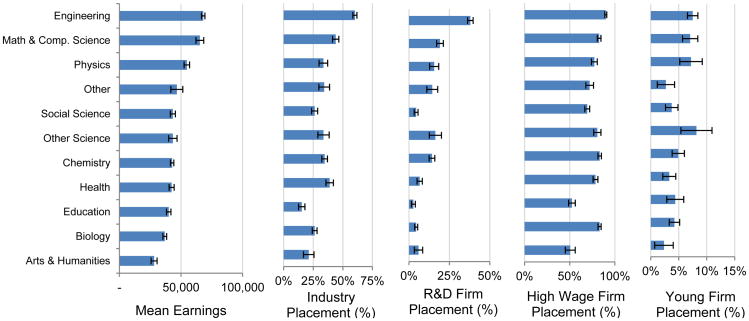
The results of the analysis of individual earnings outcomes in the year after PhD receipt are reported in the first panel of Figure 3. (SOM Tables 7 and 8 report descriptive statistics and regression results.) Here, the mean earnings for broad academic fields are ordered by earnings and reported as bar charts, with the standard errors reflected by the whiskers. While earnings are an imperfect measure of the value of skills, especially for people still investing in their human capital, the labor economics literature finds a strong correlation between skills and earnings (16). The two fields with the highest earnings are Mathematics/Computer Sciences and Engineering, with mean earnings in excess of $65,000. Although mean earnings for doctoral recipients are low in Biology at $36,000, this may be due to many taking jobs as postdoctoral researchers in life sciences. If the sample is subset to only include industry earnings, the average earnings increase by one quarter (although the gap varies by field), with the highest earnings in Mathematics/Computer Sciences (almost $90,000) and Engineering (almost $80,000).
Figure 3.
The Earnings and Placement of Doctoral Recipients Supported on Grants Vary By Field.
Note: Figure show means and standard errors for each variable. Young firm are defined to be those less than 5 years old. High payroll per worker establishments are defined as those with a payroll per worker above the median for the establishments within their six-digit industry.
Placements are reported in the subsequent four panels. Doctoral recipients with degrees in engineering are most likely to go to work in industry, followed by those with degrees in Math/Computer Science. New degree holders in engineering are by far the most likely to go to establishments that are owned by R&D-performing firms. In all fields, doctoral recipients going into industry are likely to go into establishments with high payroll per worker (above the median for the establishments within their six-digit industry). The recent economics literature has emphasized the importance of young firms in contributing to economic growth (17, 18). We examine placements and find that engineers and computer scientists are most likely to go to establishments of young firms.
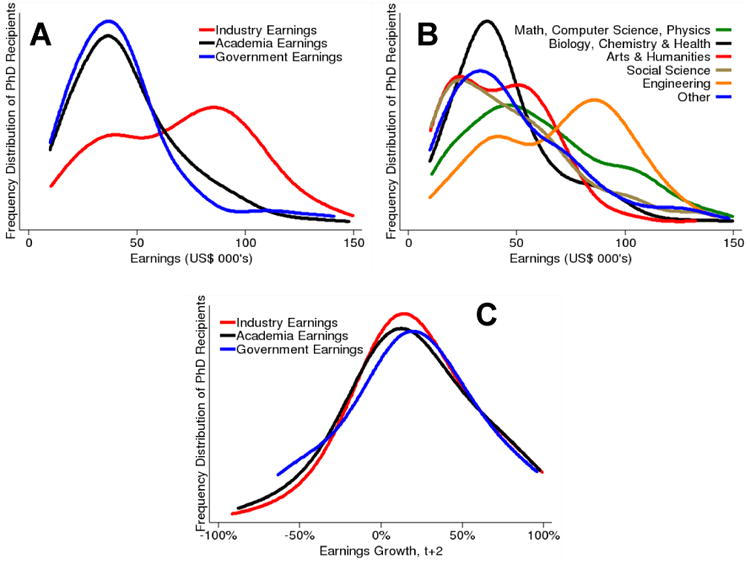
Just as it was possible to show the distribution of average payroll per worker for employers, it is also possible to describe the distribution of individual earnings. One year after leaving the university, doctoral recipients placed in industry have considerably higher earnings than those who go to government or academia and considerably more doctoral recipients placed in academia have earnings below $50,000 per year (Figure 4 panel A). There is suggestive evidence that at least part of that may be due to doctoral recipients taking postdoctoral research positions; there is a noticeable heaping of the earnings distribution at just under $50,000 for those in biology, chemistry and health disciplines in panel B. However, the earnings growth (albeit from a lower base) is still robust in all sectors 2 years after leaving the university, as shown by the distribution of earnings growth in panel C.
Figure 4.

Earnings and earnings growth of UMETRICS doctoral recipients by sector and discipline.
Source: The figure plots the smoothed share of UMETRICS doctoral recipients (the probability density estimated using a Gaussian kernel model) at each level of earnings / earnings growth (with bandwidths of $10,000, $10,000, and 25% respectively). Individual earnings data are derived from a match to W-2 earnings data.
This work takes a first step towards describing the links between research funding and the economy by tracing the flows of doctoral recipients employed on research grants subsequent to their separation from the university that employed them. The analysis shows that many doctoral recipients who were employed on funded research projects move into the non-academic sector and that when they do, they disproportionately get jobs at establishments with high payroll per worker and in high tech and professional service industries. While the results are descriptive and not causal, the findings are consistent with sociological research regarding knowledge flows. A major way in which knowledge is transmitted from research institutions to the economic marketplace is through the placement of people at businesses that draw on that knowledge (19). As research has shown, and as Oppenheimer pointed out, the best way to send knowledge is to wrap it up in a person (20). Higher earnings and placement in large establishments with high payroll per worker, and in establishments owned by R&D performing firms, all characteristics correlated with higher productivity, are consistent with that view (21).
As with any initial examination of new data, there are a number of issues and future extensions to note. There is a need to develop a statistical framework to make causal inferences, which involves identifying appropriate counterfactuals or quasi-experimental variation. The Census Bureau links will make it possible to study both longer term career trajectories and the characteristics of businesses started by researchers and compare those to the careers of different types of workers and other business startups in the United States. In addition, the type of analysis we do here for PhD recipients can be extended to study the career outcomes of other groups involved in research – particularly postdoctoral students, graduate students who do not get doctoral degrees, undergraduate students, research staff, and people employed on non-federal projects. As the database expands, researchers can begin to study how outcomes relate to whether funding is federal or non-federal
There are important caveats, however. While extensible to all research universities, the institutions we study should not be viewed as representative of all academic research institutions. They are large public institutions in the Midwest, and many have large engineering programs and medical schools. Also, the use of U.S.-based administrative and survey data limits the ability to track students who leave the U.S. The analysis is explicitly descriptive in nature, and is not intended to make any causal assertions. However, since the data will be available at IRIS and the Federal Statistical Research Data Centers, the research community can build on this infrastructure to advance the science of science, and provide policy makers with research-backed tools to assess the effects of investments in science.
Supplementary Material
Acknowledgments
This research was supported by NSF SciSIP Awards 1064220 and 1262447; NSF Education and Human Resources DGE Awards 1348691, 1547507, 1348701, 1535399, 1535370; NSF NCSES award 1423706; NIHP01AG039347; and the Ewing Marion Kaufman and Alfred P. Sloan Foundations. Data were generously provided by the Committee on Institutional Cooperation and its member institutions. We thank Wei Cheng, Cameron Conrad, Christina Jones, Evgeny Klochikhin and Josh Tokle for research support, Greg Carr, Marietta Harrison, David Mayo, Mark Sweet, Jeff Van Horn and Stephanie Willis for help with data issues, and Jay Walsh, Roy Weiss, and Carol Whitacre for their continuing support. The research agenda draws on work with many coauthors, but particularly work with Jacques Mairesse, and Michele Pezzoni. Opinions expressed are those of the authors to do not necessarily represent the views of the Census Bureau.
Footnotes
This manuscript has been accepted for publication in Science. This version has not undergone final editing. Please refer to the complete version of record at http://www.sciencemag.org/. The manuscript may not be reproduced or used in any manner that does not fall within the fair use provisions of the Copyright Act without the prior, written permission of AAAS.
References
- 1.Marburger J. Science (80-) 2005;308:1087–. doi: 10.1126/science.1114801. [DOI] [PubMed] [Google Scholar]
- 2.Jaffe AB, Trajtenberg M, Henderson R. Q J Econ. 1993;108:577–598. [Google Scholar]
- 3.Kantor S, Whalley A. Rev Econ Stat. 2014;96:171–188. [Google Scholar]
- 4.P. Shu, (2011).
- 5.Sauermann H, Roach M. PLoS One. 2012;7:e36307. doi: 10.1371/journal.pone.0036307. [DOI] [PMC free article] [PubMed] [Google Scholar]
- 6.Sumell AJ, Stephan PE, Adams JD. In: Science and Engineering Careers in the United States: An Analysis of Markets and Employment. Freeman R, Goroff D, editors. 2009. [Google Scholar]
- 7.Cronin B, Sugimoto C. Scholarly Metrics Under the Microscope. Information Today Inc./ASIS&T; 2014. [Google Scholar]
- 8.Lane J. Nature. 2010;464:488–489. doi: 10.1038/464488a. [DOI] [PubMed] [Google Scholar]
- 9.Sayer D. Five reasons why the REF is not fit for purpose. Guard. 2014 [Google Scholar]
- 10.Lane JI, Owen-Smith J, Rosen RF, Weinberg BA. Res Policy. 2015 doi: 10.1016/j.respol.2014.12.013. [DOI] [PMC free article] [PubMed] [Google Scholar]
- 11.Weinberg BA, et al. Science (80-) 2014;344:41–43. doi: 10.1126/science.1250055. [DOI] [PMC free article] [PubMed] [Google Scholar]
- 12.Jarmin RS, Miranda J. Working Papers. Center for Economic Studies, U.S Census Bureau; 2002. The Longitudinal Business Database. available at http://ideas.repec.org/p/cen/wpaper/02-17.html) [Google Scholar]
- 13.Davis SJ, et al. Measuring the dynamics of young and small businesses: Integrating the emplo yer and nonemployer universes. National Bureau of Economic Research; 2007. [Google Scholar]
- 14.Syverson C. J Econ Lit. 2011;49:326–365. [Google Scholar]
- 15.National Science Foundation Committee of Visitors. Business R&D Innovation Survey. 2013 [Google Scholar]
- 16.Becker GS. Human capital: A theoretical and empirical analysis, with special reference to education. University of Chicago Press; 2009. [Google Scholar]
- 17.Decker R, Haltiwanger J, Jarmin R, Miranda J. J Econ Perspect. 2014:3–24. [Google Scholar]
- 18.Haltiwanger J, Jarmin RS, Miranda J. Rev Econ Stat. 2013;95:347–361. [Google Scholar]
- 19.Lane J, Owen-Smith J, Rosen R, Weinberg B. New linked data on science investments, the scientific workforce and the economic and scientific results of science. 2015 doi: 10.1016/j.respol.2014.12.013. [DOI] [PMC free article] [PubMed] [Google Scholar]
- 20.Stephan P. In: Innovation Policy and the Economy, volume 7. Lerner J, Stern S, editors. MIT Press; 2007. [Google Scholar]
- 21.Whittington KB, Owen-Smith J, Powell WW. Adm Sci Q. 2009;54:90–122. [Google Scholar]
Associated Data
This section collects any data citations, data availability statements, or supplementary materials included in this article.


