Abstract
Dichloroacetate (DCA), commonly used to treat metabolic disorders, is under investigation as an anti-cancer therapy due to its ability to reverse the Warburg effect and induce apoptosis in tumor cells. While DCA’s mechanism of action is well-studied, other factors that influence its potential as a cancer treatment have not been thoroughly investigated. Here we show that expression of glutathione transferase zeta 1 (GSTZ1), the enzyme responsible for conversion of DCA to its inactive metabolite, glyoxylate, is downregulated in liver cancer and upregulated in some breast cancers, leading to abnormal expression of the protein. The cellular concentration of chloride, an ion that influences the stability of GSTZ1 in the presence of DCA, was also found to be abnormal in tumors, with consistently higher concentrations in hepatocellular carcinoma than in surrounding non-tumor tissue. Finally, results from experiments employing two- and three-dimensional cultures of HepG2 cells, parental and transduced to express GSTZ1, demonstrate that high levels of GSTZ1 expression confers resistance to the effect of high concentrations of DCA on cell viability. These results may have important clinical implications in determining intratumoral metabolism of DCA and, consequently, appropriate oral dosing.
Keywords: breast cancer, chloride, dichloroacetate, GSTZ1, liver cancer, resistance
1. Introduction
Dichloroacetate (DCA) is currently being investigated as a treatment for several disorders of metabolic integration, including congenital mitochondrial diseases, pulmonary arterial hypertension, and cancer. An inhibitor of mitochondrial pyruvate dehydrogenase kinase (PDK), DCA maintains the pyruvate dehydrogenase complex (PDC) in its active, unphosphorylated state. PDC decarboxylates pyruvate to acetyl CoA, thereby linking cytoplasmic glycolysis to the mitochondrial tricarboxylic acid cycle. Perturbation of the PDC/PDK axis by DCA stimulates oxidative phosphorylation and has been shown to reverse the Warburg effect (aerobic glycolysis) in tumor cells, resulting in their selective apoptosis, although resistance to the drug’s anti-tumor action has been reported (reviewed in [1]).
The enzyme responsible for the metabolism of DCA is glutathione transferase zeta 1 (GSTZ1), which is found primarily in the liver cytosol and mitochondria and dehalogenates DCA to an inactive metabolite, glyoxylate [2]. During metabolism of DCA, a portion of the GSTZ1 can be irreversibly inhibited through adduct formation with a metabolic intermediate, carboxymethylglutathione, or with glyoxylate, thereby slowing the clearance of subsequent doses of DCA [3]. We recently found that some anions, including chloride, protect against DCA-induced GSTZ1 inactivation [4].
Here, we investigated potential changes in GSTZ1 expression that occur during tumor development as expression of GSTZ1 in a tumor may provide resistance to DCA treatment. We also examined miRNA as a possible control mechanism for GSTZ1 expression and measured intratumoral chloride concentration ([Cl−]) compared to surrounding tissue. [Cl−] in tumor cells could directly influence GSTZ1 stability and so is directly associated with DCA metabolism. Thus, the differential susceptibility of cancer to DCA may, at least in part, depend upon a modulating role of chloride in the metabolism and therapeutic efficacy of the drug.
We now report that GSTZ1 protein is often underexpressed in hepatocellular carcinoma and overexpressed in breast cancer, although this misregulation does not appear to be under miRNA control. We also show that GSTZ1 expression in cancer cells confers resistance to the effects of DCA and that the [Cl−] in tumors is often abnormally high compared to the surrounding tissue.
2. Materials and Methods
2.1 Meta-Analyses Using the Oncomine and Breastmark Databases
The Oncomine database [5] was used to compare GSTZ1 mRNA expression in normal vs. tumor tissues. The parameters used were threshold (p-value): 0.05, threshold (fold change): 1.5, threshold (gene rank): top 10%, data type: mRNA. To compare GSTZ1 mRNA expression in increasing grade hepatocellular carcinoma, the Wurmbach Liver [6] dataset was used. The probe for GSTZ1 mRNA is identified as 2954. Comparison of GSTZ1 mRNA levels between normal tissues was done using the Hsiao Normal dataset [7].
Correlation between GSTZ1 mRNA expression and overall survival in breast cancer was analyzed using the Breastmark database [8]. The findings were produced using parameters including survival options: OS and cut-off: low. This dataset includes 2,091 patients and 539 events.
2.2 Tissue Processing and Immunoblotting
Human tissues were obtained from the University of Florida Clinical and Translational Science Institute’s Biorepository, following IRB approval. Non-tumor and tumor liver tissues were homogenized and fractionated into mitochondrial and cytoplasmic fractions, as published [2]. Breast, kidney, and duodenum tissues were homogenized and centrifuged at 600-g. The 600-g supernatant was used in these studies. Samples were separated by SDS-PAGE and immunoblotted as described previously [9]. Due to widely variable expression of the traditional loading markers actin and voltage-dependent anion channel (VDAC) between non-tumor and tumor samples from the same donor, as well as between donors, protein loading was confirmed by total protein staining, either via BioRad stainfree imaging or Coomassie blue staining. Protein loading for each sample deviated less than 20% from the mean of all samples on its respective gel. Soluble and insoluble fractions of cell culture lysates were separated by centrifugation at 16,000-g.
2.3 Measurement of GSTZ1 Activity
GSTZ1 activity was measured as reported previously [2]. Briefly, samples were incubated with saturating concentrations of 14C-DCA and glutathione. Incubation media were then analyzed by HPLC to determine the fraction of 14C-DCA that had been converted to14C-glyoxylate. Enzyme catalytic activity is expressed as nmol 14C-glyoxylate/mg protein/min.
2.4 Chloride Ion Measurements
Chloride concentrations were determined using a HPLC method that measures the derivitization of pentafluorobenzyl bromide to pentafluorobenzyl chloride [10,11].
2.5 Cell Culture and DCA Sensitivity Assays
Unless specified, cells were cultured in low-glucose (1 mg/mL) DMEM supplemented with 10% fetal bovine serum. The HepG2-GSTZ1 cell line was generated using a lentiviral expression system by transfecting the pLX304-GSTZ1 plasmid [12] and viral packaging plasmids PMD2G and PsPax2 (Addgene, Cambridge, MA) into the 293T cell line to produce lentivirus. The lentivirus was then used to transduce the HepG2 cell line as described previously [13], with GSTZ1 expression under control of the cytomegalovirus promoter. Two-dimensional sensitivity assays were carried out as done previously, plating cells in 24-well plates, treating with increasing concentrations of DCA and using crystal violet staining as a measure of cell number [13]. Three-dimensional sensitivity assays were conducted by suspending 10,000 cells from a single-cell suspension in 0.35% agarose dissolved in cell culture medium. Each mixture was allowed to solidify in the well of a 24-well plate that had previously been coated with 0.5% agarose in cell culture medium. Solidified agarose was covered with liquid medium and the cells were grown for seven days. For treatment with DCA, the top layer of medium was replaced with medium containing 2x the desired DCA concentration. The volume of this medium was equal to that of the agarose in the well. This treatment was carried out for 72 hours and the spheres were imaged and measured using OpenLab software (Perkin Elmer, Waltham, MA). Treatment medium was replaced with normal medium daily for three days to wash out the DCA and the spheres were allowed to grow a total of one week post treatment before being reimaged. Sphere diameter was measured using the OpenLab software.
2.6 miRNA expression
Using multiple miRNA:mRNA target prediction algorithms including miRanda, Targetscan, and Probability of Interaction by Target Accessibility (PITA) [14,15,16], we identified two miRNAs, miR-214-3p and miR-542-3p, that received consistently high scores and were predicted to bind to the 3′ untranslated region of GSTZ1 mRNA. Quantitative Reverse Transcription polymerase Chain reaction (qRT-PCR) technique was used to measure miRNA relative expression. First, samples were homogenized and RNA was isolated using the miRNeasy Mini Kit from Qiagen (Valencia, CA). For reverse transcription, TaqMan primers specific for miR-214-3p (#002306), miR-542-3p (#001284), RNU44 (#001094), and U6 snRNA (#001973) were purchased from Life Technologies (Waltham, MA) and used along with the TaqMan Universal cDNA Transcription Kit per manufacturer instructions. The miRNA reverse transcription product was then quantitated using TaqMan Universal Mastermix (no UNG) on a QuantStudio™ 12K Flex Real-Time PCR System (Life Technologies, Thermo Fisher Scientific, Carlsbad, CA, USA). All the reactions were performed in triplicates. The Ct data were calculated based on automatically set baseline and threshold values, using QuantStudio™ 12 K Flex Software v1.2.2 (Life Technologies). The 2-ΔΔCT method was used to calculate miRNA expression [17]. ΔCt values were calculated as the difference between the Ct values for the miRNA and the average of the endogenous normalizers, RNU44 and U6 snRNA. Then, ΔΔCt was calculated as the average ΔCt, tumor - average ΔCt, non-tumor.
3. Results
3.1 GSTZ1 Expression is Misregulated in Cancer
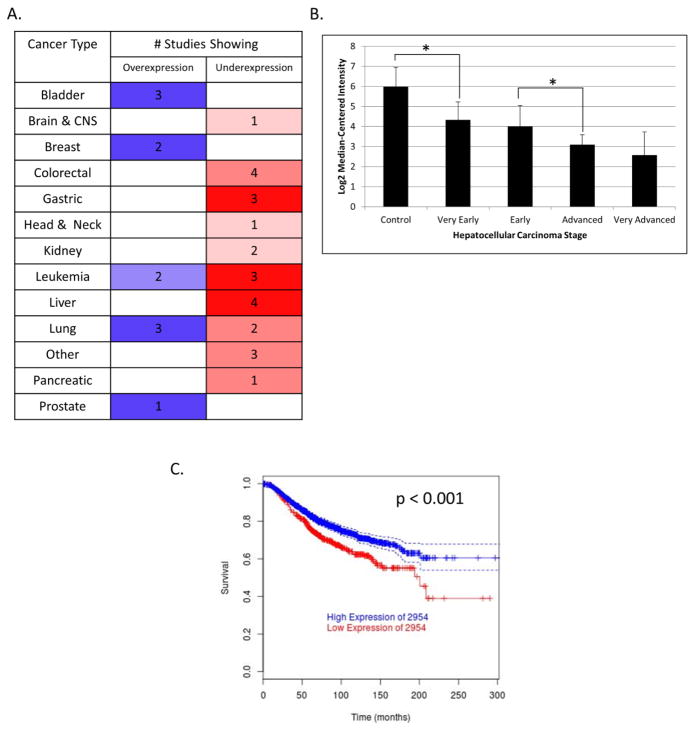
A meta-analysis utilizing the Oncomine database revealed that GSTZ1 mRNA is variably expressed in a number of different forms of human cancer (Figure 1A) [5]. Among the different tumor cell types studied, GSTZ1 mRNA levels showed the largest relative increase in bladder, breast and some lung cancers. GSTZ1 mRNA was lowered in liver cancer, in contrast to the high GSTZ1 mRNA and protein expression present in healthy liver tissue [5]. Brain cancer showed only a slight downregulation of GSTZ1 mRNA from what was shown to be low basal expression in normal brain tissue, compared to liver, by the Hsiao Normal dataset [7]. Sorting hepatocellular carcinoma by grade in Oncomine [5] using the Wurmbach Liver dataset [6] showed decreasing levels of GSTZ1 transcripts as tumors became more advanced, based on histopathological analysis (Figure 1B). These data were not available for the other three datasets that showed downregulation of GSTZ1: Roessler Liver, Roessler Liver 2 [18], and Chen Liver [19]. We found a strong correlation between overall survival and GSTZ1 mRNA expression in patients with breast cancer who received conventional therapy (Figure 1C) when analyzing data available in the BreastMark database [8]. Interestingly, those patients that had been treated with tamoxifen showed no correlation between GSTZ1 expression and overall survival.
Figure 1.
Meta-analyses of GSTZ1 in cancer. A) GSTZ1 mRNA expression in normal vs. tumor tissues from various organ sites, as reported by the Oncomine database. Blue and red (left and right columns) denote over- and under-expression, respectively, while color intensity represents level of misregulation. Numbers are the quantity of studies that showed that result. Parameters used were threshold (p-value): 0.05, threshold (fold change): 1.5, threshold (gene rank): top 10%, data type: mRNA. B) GSTZ1 mRNA expression in increasing stages of hepatocellular carcinoma as reported by the Wurmbach Liver dataset in the Oncomine database. C) Overall survival of breast cancer patients with high (>25 percentile, upper line) or low (≤25 percentile, lower line) expression of GSTZ1 mRNA (2954), as reported by the Breastmark database. Parameters used include survival options: OS and cut-off: low. The graph represents 2,091 patients with 539 events. * denotes p < 0.05 as determined by Student’s t-test. 2954 is the probe ID of GSTZ1.
Breast and liver cancer showed the most marked up- and downregulation of GSTZ1, respectively, and were chosen for further study. We also investigated GSTZ1 expression in the kidney because it is a known site of GSTZ1 expression [20,21,22] and the Oncomine data suggested possible downregulation of GSTZ1 in kidney cancer. In addition, due to its known role in drug metabolism, we hypothesized the non-tumor duodenum may express GSTZ1 and, therefore, also sought to study non-tumor and tumor duodenal tissue. Liver samples were fractionated into cytoplasmic and mitochondrial fractions. Due both to small sample sizes and a relatively low mitochondrial content compared to that of liver, sufficient quantities of breast, kidney, and duodenum mitochondria could not be collected.
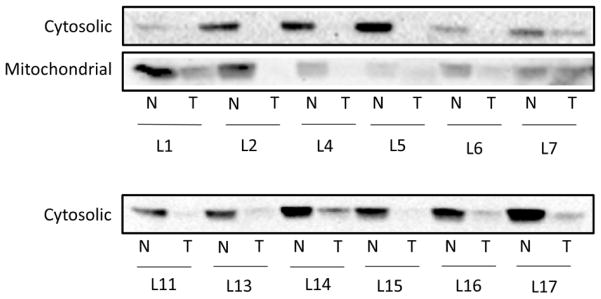
Immunoblot analysis of the liver tumor samples showed a strong downregulation of GSTZ1 protein in the cytosol of all six donors (Figure 2, top panel). Corresponding decreases in mitochondrial GSTZ1 were seen in five of the samples. Equal quantities of protein (30 μg for cytosol and 100 μg for mitochondria) were loaded into each lane.
Figure 2.
Western blots of GSTZ1 protein expression in tumor and non-tumor liver tissue. Immunoblot analysis of cytosolic and mitochondrial fractions of donor matched non-tumor and tumor liver tissues. L1 etc. indicates liver donor number while N and T denote non-tumor and tumor, respectively. Liver cytosol samples were loaded at 30 μg total protein per well and mitochondrial samples were loaded at 100 μg total protein per well.
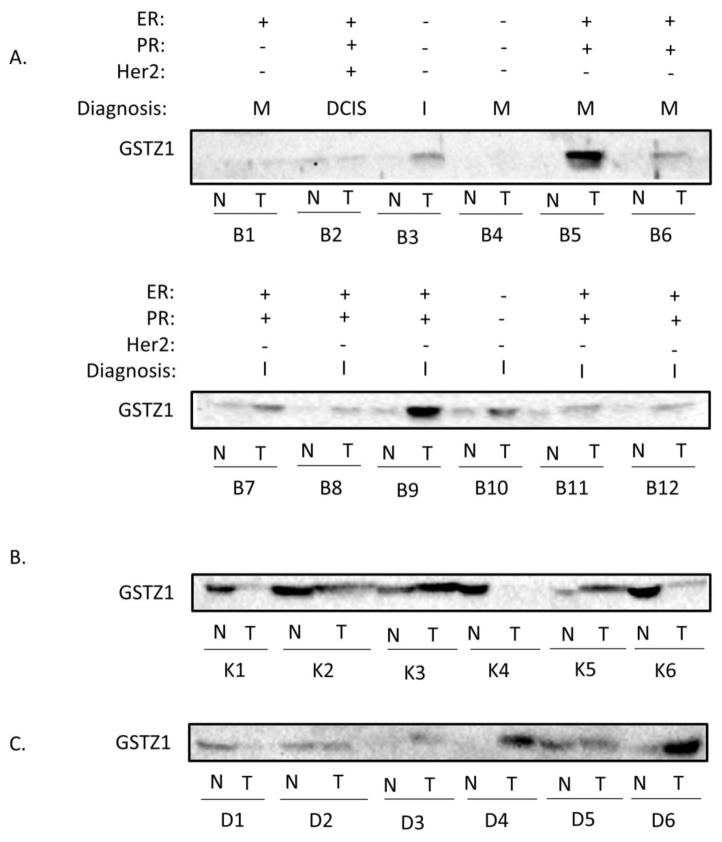
Paired breast samples showed less consistency than the liver samples when 100 μg of total protein was immunoblotted. Two pairs, B1 and B2, showed low enzyme expression in both non-tumor and matched tumor tissue, while a third pair, B4, revealed no measureable expression in either sample. Three tumors, B3, B5, and B6, showed a strong upregulation of GSTZ1. GSTZ1 protein expression in breast did not correlate with expression of the estrogen receptor, progesterone receptor, or human epidermal growth factor receptor 2 (HER2) (Figure 3A, top panel). Breast tumor samples represented variable stages of malignancy, including carcinoma in situ, invasive carcinoma, and metastatic cancer. However, the stage of malignancy also did not correlate with GSTZ1 expression. Tumor heterogeneity is a possible cause of this inter-patient variability, as the cellular makeup of the tumor (stromal cells, tumor initiating cells, etc.) likely varied among samples. Information regarding the portion of tumor from which the samples were obtained from was unavailable. The observed variability matches the mRNA data available in Oncomine, in which only two of 14 datasets achieved statistical significance in demonstrating upregulation with the search parameters used [5].
Figure 3.
Western Blots of non-tumor and tumor tissue from various organ sites. Shown are immunoblot analyses of donor matched non-tumor and tumor tissues from breast (A), kidney (B), and duodenum (C). Sample number indicates donor number (with separate donor groups for each tissue) while N and T denote non-tumor and tumor, respectively. Presence (+) or absence (−) of estrogen receptor (ER), progesterone receptor (PR) and Her2 receptor expression status are as reported by the pathology report. Diagnosis designations include ductal carcinoma in situ (DCIS), invasive (I), and metastatic (M), as specified by the pathology reports. All wells contain 100 μg total protein per well.
The kidney and duodenum tumors we analyzed showed variable GSTZ1 protein expression, compared to control tissue (Figure 3B and C). Similar to breast, the variability found in the kidney is consistent with mRNA data in Oncomine, showing a moderate downregulation in two of seven datasets [5]. Due to this inconsistency, we chose to focus on breast and liver cancer as models of up- and downregulation of GSTZ1, respectively. Analysis of six additional pairs of samples from each of these tissues was then completed (Figure 2 and 3A, bottom panels).
3.2 GSTZ1 Activity Mirrors Protein Expression in Non-tumor and Tumor Tissue
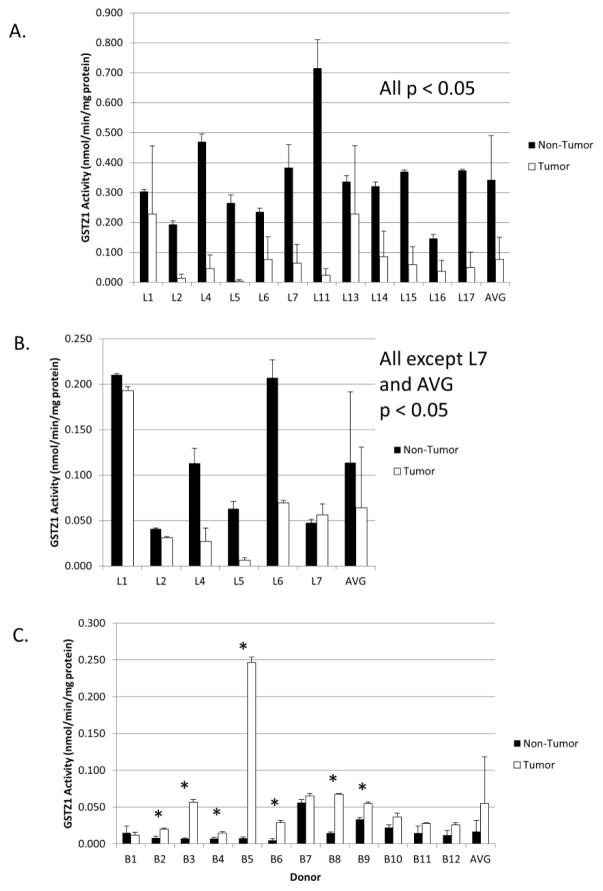
GSTZ1 activity in liver tumor cytosol was lower than that measured in cytosol of matched non-tumor tissue (Figure 4A). Likewise, we found a decrease in GSTZ1 activity in five of six tumor mitochondrial fractions (Figure 4B). The exception was the mitochondrial GSTZ1 activity from donor 7, in whom enzyme activity was similar in non-tumor and tumor samples and paralleled enzyme expression (Figure 2).
Figure 4.
GSTZ1 activity in non-tumor and tumor tissues. Ability of the homogenates to metabolize DCA was measured in the liver cytosol (A), liver mitochondria (B), and breast (C). Values are the mean of duplicate measurements and are reported as nmol DCA/min/mg of total protein. Error bars represent standard deviation of assay replicates. AVG bars denote mean values of all measurements of non-tumor or tumor tissues and error bars represent the standard deviation. * denotes p < 0.05 as determined by Student’s t-test.
Most non-tumor and tumor breast samples had very low GSTZ1 activity, with the exception of donor 5, whose tumor had enzyme activity similar to that of non-tumor liver tissue. However, the average activity was higher in 11 of 12 breast tumors compared to their matched non-tumor tissue (Figure 4C).
3.3 miRNA Expression Does Not Correlate With Protein Expression in Tumors
We measured the expression of two miRNAs that are predicted to bind to GSTZ1 mRNA to investigate their possible roles in regulating GSTZ1 expression in cancer cells. MiR-214-3p showed an average downregulation in liver tumors of 65.5 ± 97.2-fold while miR-542-3p expression was decreased 19.0 ± 20.8-fold. Values represent the mean ± standard deviation. Despite the wide variation, both miRNAs were downregulated in all tumor samples measured when compared to the matched non-tumor tissue. Breast tumors also showed marked downregulation of miR-214-3p (5.1 ± 4.8-fold) and miR-542-3p (6.0 ± 11.2-fold; Table 1). There was no correlation between miRNA and enzyme protein expression.
Table 1.
Expression of miR-214-3p and miR-542-3p in non-tumor and tumor tissues.f
| Tissue | Fold Change | |||
|---|---|---|---|---|
| miR-214-3p | miR-542-3p | |||
| Mean ± S.D. | Range | Mean ± S.D. | Range | |
| Liver | −65.5 ± 97.2 | −256.7–−2.4 | −19.0 ± 20.8 | −60.1–−2.9 |
| Breast | −5.1 ± 4.8 | −10.9–1.8 | −6.0 ± 11.2 | −27.4–−1.9 |
Fold change values compared to the matched non-tumor tissue.
n = 6 for each group
3.4 Chloride Ion Concentration in Cancer
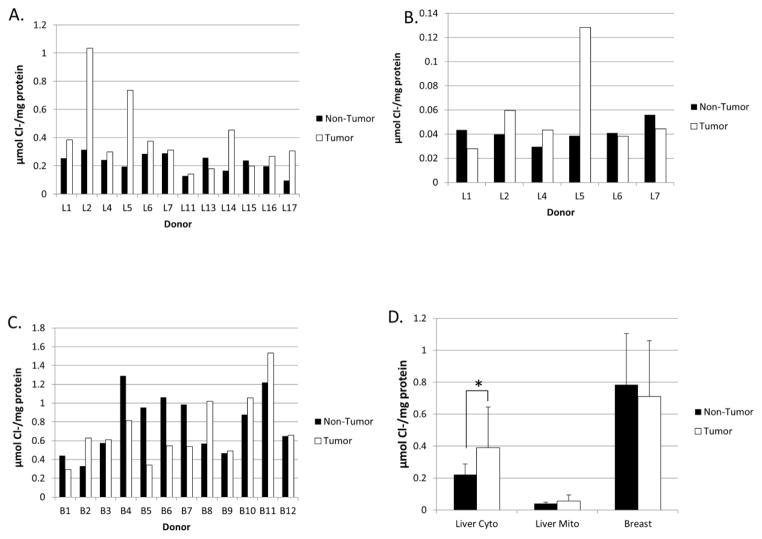
Tissue samples had widely varying makeups and amounts of connective or fibrous tissue and homogenized to different degrees. Therefore, chloride concentration is reported in μmol per mg of protein in the homogenates rather than in molarity, since the volume of tissue successfully homogenized in each sample was unknown. Non-tumor liver tissue appeared to homogenize completely and the mean (± std. dev.) chloride concentration ([Cl−]) was 0.22 ± 0.07 μmol/mg protein in the cytosol. For reference, we have reported the chloride concentration in normal adult liver cytosol to be approximately 75 mM [11].
Mean cytosolic and mitochondrial [Cl−] increased in liver tumors, compared to matched non-tumor tissue (Figures 5A and 5B). Although small sample size precluded replicate [Cl−] measurements, we have previously shown the assay to be highly reproducible [11].
Figure 5.
Chloride concentrations in non-tumor and tumor tissues. The concentration of chloride ion was measured and reported in μmol Cl−/mg of total protein for the liver cytosol (A), liver mitochondria (B), and breast (C). D) Mean Cl− levels in non-tumor vs. tumor tissues from liver cytosol, liver mitochondria, and breast homogenate. Values show the mean of all tissue analyzed, error bars represent the standard deviation, and * denotes p < 0.05 as determined by Student’s t-test.
Breast tumors contained higher chloride concentrations in seven of twelve donors and a decreased [Cl−] in the other five (Figure 5C). Insufficient homogenate was available to do replicate measurements of these samples. Of note, the non-tumor breast tissue showed higher variability in [Cl−] between donors than did the non-tumor liver samples. Additionally, both non-tumor and tumor breast tissues had mean Cl− levels that were much higher than the liver samples (Figure 5D), while liver mitochondria had very low [Cl−], consistent with our previous findings [11]. As a whole, only cytosol from liver tumors had Cl− levels that were different from matched controls.
3.6 GSTZ1 Expression Correlates with Resistance to DCA
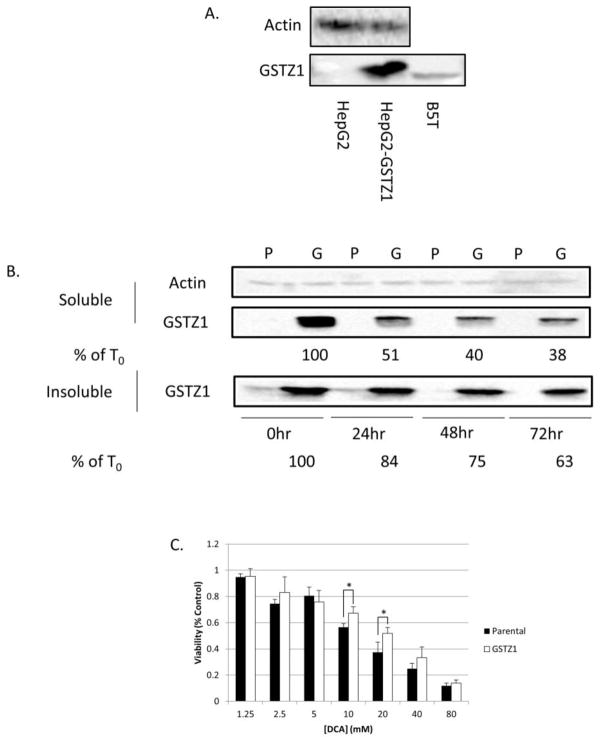
To further investigate the relationship between GSTZ1 expression and the response of cancer cells to DCA exposure, we developed a HepG2 cell line that stably overexpresses GSTZ1 (HepG2-GSTZ1). Hepatocytes in culture, both immortalized and primary lines, have very low expression of drug metabolizing enzymes (reviewed in [23]). However, we obtained high levels of stable GSTZ1 expression by employing a lentiviral system to transduce the cell line (Figure 6A). For reference, the blot also contains the breast tumor B5T sample, and shows that the cells have approximately four-fold higher GSTZ1 protein expression than this breast tumor sample. Immunoblot of lysates from cells treated with 20 mM DCA for 0, 24, 48, or 72 hours showed that GSTZ1 expression decreased most in the first 24 hours and remained relatively unchanged thereafter (Figure 6B, middle panel). We hypothesized that inactivated GSTZ1 may form insoluble aggresomes prior to its degradation. The GSTZ1 protein detected in the insoluble cell fraction also decreased (Figure 6B bottom panel), suggesting that inactivated GSTZ1 does not form aggresomes.
Figure 6.
Two-dimensional cell culture model of DCA effects on GSTZ1 expression. A) Immunoblot analysis showing a high level of GSTZ1 in the lentivirus transduced HepG2-GSTZ1 cell line compared to the parental cell line and reference breast tumor, B5T. B) Immunoblot analysis of GSTZ1 expression in the soluble and insoluble lysate fractions of the HepG2 (P) and HepG2-GSTZ1 (G) cell lines after 0, 24, 48, and 72 hours of treatment with 20 mM DCA. % T0 represents remaining GSTZ1 protein as a percentage of the untreated control, as determined by relative quantitation using ImageJ software. C) Concentration response curve measuring % control viability, with increasing concentrations of DCA in GSTZ1 non-expressing (parental) and expressing (GSTZ1) cell lines after a 72 hour DCA treatment. Values are the mean of three replicates, and error bars represent standard deviation. * denotes p < 0.05
A 72 hour exposure of cells to DCA caused a concentration-dependent decrease in viability that was more pronounced in control parental cells than in cells in which GSTZ1 was stably overexpressed (Figure 6C). The sensitivity of control HepG2 cells to DCA was similar to that previously reported by others [24]. The resistance afforded by GSTZ1 expression was modest, although standard two-dimensional cell cultures may not provide an accurate model of drug exposure by tumors growing in vivo.
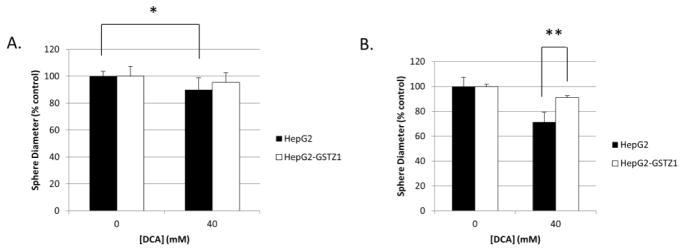
To address this shortcoming, we grew HepG2 cell spheres in soft agar for one week before exposing them to 40 mM DCA for an additional 72 hours. Cell spheres were then washed with DCA-free medium and grown for an additional week to monitor tumor size, as measured by sphere diameter. Before washout, spheres composed of parental HepG2 cells were significantly smaller after DCA treatment compared to untreated control spheres. In contrast, spheres overexpressing GSTZ1 that were exposed to DCA were indistinguishable in size from untreated controls (Figure 7A). After a one week washout, parental HepG2 spheres that had been treated with 40 mM DCA were significantly smaller than the similarly treated HepG2-GSTZ1 spheres, compared to their respective untreated controls (Figure 7B). We observed no difference in average sphere size between the two cell lines after 17 days of growth without DCA treatment, indicating equal growth rates.
Figure 7.
Three-dimensional cell culture model of GSTZ1-induced resistance to DCA. A) Spheroid diameter, as % control, of HepG2 and HepG2-GSTZ1 cells grown with and without 40 mM DCA for 72 hours. B) Diameter of the same spheroids after a 1 week washout period. * denotes p < 0.05; ** denotes p < 0.0001
4. Discussion
Although GSTZ1 expression had not previously been directly studied in human tumors, it had been included in large, genome-wide microarray studies. Drawing upon these data from the Oncomine database, we found highly variable GSTZ1 mRNA levels in a wide array of cancers. GSTZ1 mRNA expression was strongly downregulated in liver cancer and upregulated in breast cancer. GSTZ1 expression was also markedly decreased in advanced liver tumors, compared to early tumors and non-tumor tissue. However, it cannot be determined from these data whether a causal relationship exists between GSTZ1 mRNA expression and tumor grade.
Related, we reported that low GSTZ1 mRNA transcript levels in breast cancer correlates with poor overall survival. Because the patients of this cohort did not receive DCA, the apparent relationship between transcript levels and survival may have an as yet unknown physiological basis. In addition to metabolizing DCA, GSTZ1, also known as maleylacetoacetate isomerase (MAAI), catalyzes the penultimate step in the phenylalanine/tyrosine catabolic pathway. The endogenous substrates of MAAI, maleylacetone and maleylacetoacetate, are reactive molecules capable of adduct formation [25]. Indeed, increased chromosomal instability and sustained extracellular signal-regulated kinase (ERK) activation have been associated with accumulation of fumarylacetoacetate, an isomer of maleylacetoacetate [26], through the depletion of glutathione. As maleylacetone and maleylacetoacetate contain the same Michael acceptor as fumarylacetoacetate, it is possible that they would induce the same tumor-promoting effects. Consequently, low tissue levels of GSTZ1/MAAI could result in accumulation of these reactive intermediates, inducing chromosomal and/or genetic instability and tumor progression. Furthermore, proteins involved in tyrosine metabolism are upregulated in some cancers [27], which could exacerbate the complications associated with low GSTZ1 expression by increasing levels of toxic phenylalanine and tyrosine catabolites if GSTZ1 expression is not concomitantly increased.
To examine these ideas further, we pursued them at the protein level. While small sample sizes are a limitation of this study, we found GSTZ1 protein and activity were downregulated in hepatocellular carcinoma but upregulated in breast cancer. The cause of this misregulation is unknown and control of expression of the GSTs under normal conditions is poorly understood. Interestingly, our protein data correlated well with the mRNA data we obtained through Oncomine [5] while a poor correlation has previously been reported between GSTZ1 mRNA and protein expression in normal human livers [28]. MiRNAs have recently been identified as regulators of the phase II metabolic enzymes glutathione transferase P [29] and UDP glucuronosyltransferase 1 family, polypeptide A1 [30]. Therefore, we sought evidence for miRNA control of GSTZ1 expression in human cancer.
If a miRNA is responsible for the low basal expression of GSTZ1 in tissues other than liver, but is downregulated in cancer, the result could be an upregulation of GSTZ1 protein. Moreover, overexpression of the same miRNA in hepatocellular carcinoma could explain the observed downregulation of GSTZ1 protein. Because many miRNAs are responsible for the regulation of multiple proteins, changes in GSTZ1 expression could simply be a collateral effect. Although we found no association between GSTZ1 expression and levels of either miR-214-3p or miR-542-3p, these miRNAs were chosen based on algorithms developed to probe for miRNA-mediated mRNA degradation. The mechanism(s) by which miRNAs inhibit translation without causing degradation is poorly understood [31], so we cannot rule out other miRNAs being responsible for GSTZ1 regulation. This possibility is particularly relevant because it is thought that lower levels of complementarity may lead to translation repression, rather than mRNA degradation [32].
In addition to protein expression, another factor that could influence DCA metabolism is [Cl−] in the tumor. The [Cl−] is expected to impact tumor sensitivity by modulating the inactivation rate of GSTZ1 during DCA metabolism [4]. High [Cl−] will lead to low rates of inactivation, leaving GSTZ1 able to continue to metabolize DCA to the inactive metabolite, while low [Cl−] will accelerate the degradation of GSTZ1 and lower the rate of DCA metabolism. High [Cl−] could lead to lowered intratumoral DCA concentrations and increasing resistance to DCA treatment. There is scant information on chloride concentrations in tumors, but high levels of extracellular Cl− were associated with proliferation of gastric cancer cells in culture [33]. Increased expression of Cl− channels, which leads to decreased intracellular [Cl−], are reported to increase cancer cell invasion by inducing changes in cell morphology through modulation of cytoplasmic volume [34]. Although increased levels of Cl− have been observed in a glioma cell line [35], to our knowledge, the concentration of chloride has not previously been measured directly in excised tumor tissue.
We found elevated concentrations of Cl− in the majority of liver tumors, but breast tumors showed more variable levels. Chloride concentrations measured in non-tumor breast samples showed a wide variation as well and may reflect heterogeneity due to differing locations of tissue resection from non-tumor breast. Of note, both non-tumor and tumor breast tissue had Cl− levels that were much higher than in liver. Consequently, regardless of increased or decreased [Cl−] in a breast tumor compared to the surrounding non-tumor tissue, the cancer will likely have Cl− levels that are sufficient to stabilize GSTZ1 and provide resistance to DCA. Together, these data indicate that [Cl−] is often abnormal in cancer, although the reasons and consequences are currently obscure. Nevertheless, these changes in [Cl−] could have an impact on DCA treatment, because a tumor with high GSTZ1 expression and high [Cl−] could exhibit atypical resistance to the anti-tumor effects of the drug.
To show that GSTZ1 provides a protective effect against DCA treatment, we constructed concentration response curves of DCA with HepG2 cell lines expressing or not expressing GSTZ1 protein. At the majority of concentrations tested, GSTZ1 overexpression was associated with a modestly higher cell viability after a 72 hour DCA treatment, consistent with a decreased therapeutic response to DCA. Because this experiment was conducted using two-dimensional cell culture, the cells consisted of a monolayer that was directly exposed to medium that acted as a DCA sink. Under these conditions, DCA could quickly enter the cell to replace that which had been metabolized by GSTZ1, leading to only a small decrease in intracellular DCA concentration.
To better investigate this phenomenon in terms of tumor morphology and DCA dynamics, we grew the same cell lines as three-dimensional spheres in soft agar and completed a similar experiment showing a greater protective effect. Although the difference in sensitivity between the two cell lines was not large, the spheres used in this experiment were orders of magnitude smaller than a tumor; thus, the difference in sensitivity to DCA is likely to be more pronounced in vivo as DCA will have to pass through a larger concentration gradient to reach the center of the tumor. It is also possible that a greater protective effect would be seen in a cell line in which DCA shows a greater potency. The concentration used in this experiment, 20 mM, is well above the IC50 of DCA toward PDK and the concentrations that can safely be achieved in vivo [36]. However, it is very similar to what has previously been observed for HepG2 and other cancer cell lines [24,37]. Future experiments should examine other cell models in both in vitro and xenograft models.
Further magnifying the need to verify this phenomenon in vivo is the fact that the cell line model used had a roughly four-fold higher GSTZ1 expression than a reference breast tumor, B5T. While the cell line contains higher expression per cell, a tumor overexpressing GSTZ1 would likely contain larger amounts of GSTZ1 in sum due to its much larger size, as previously discussed. Additionally, the tumor samples we obtained likely contained an unknown fraction of non-tumor tissue. The presence of this non-tumor breast tissue would result in expression measurements that were lower than truly present in the tumor. A non-cell line based tumor model is needed to fully address these issues and confirm the clinical significance of our findings.
Figure 8 illustrates our current model of the relationships involving tumor GSTZ1 expression, intracellular [Cl−], and DCA distribution in the tumor. DCA is free to enter tumors that do not express GSTZ1, either through passive or active mechanisms. The initial dose of DCA given to patients whose tumor expresses GSTZ1 will be metabolized as it moves to the center of the tumor, creating a concentration gradient. The GSTZ1 expressed in these tumors will be inactivated following the first dose if the tumor has a low [Cl−], allowing subsequent doses to reach the center. However, if the tumor expresses GSTZ1 and contains a high [Cl−], the GSTZ1 will be stable, maintaining the resistance provided by its expression.
Figure 8.
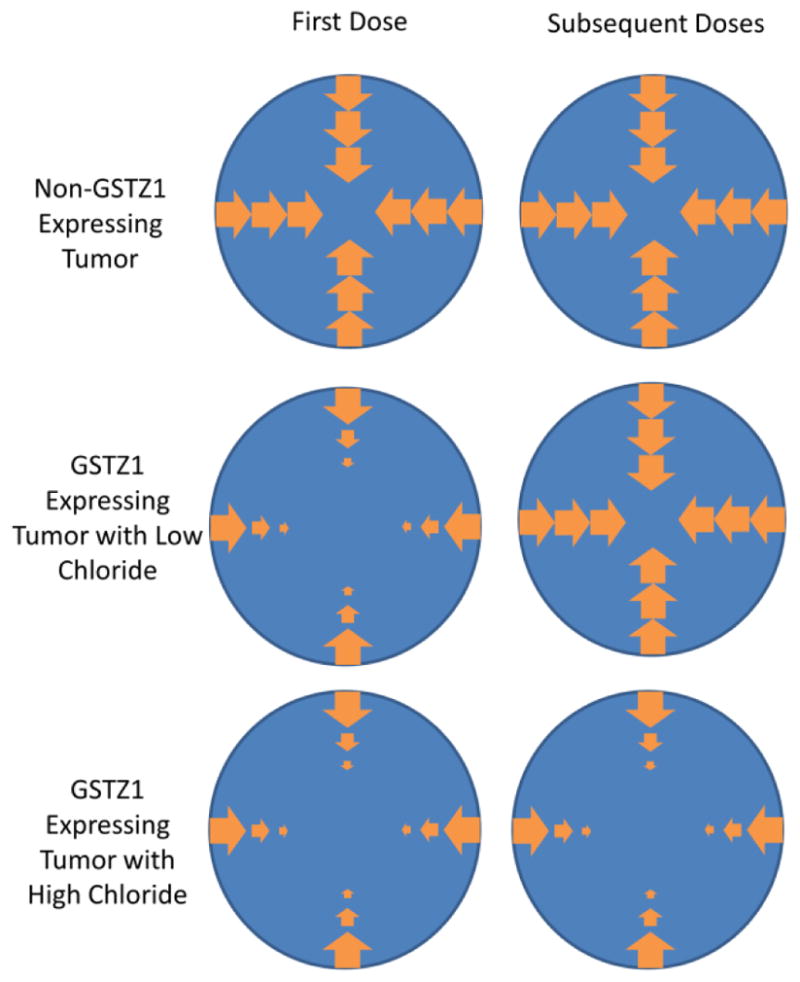
Working model of GSTZ1 resistance against DCA exposure. In a tumor that does not express GSTZ1, DCA is able to freely diffuse throughout the tumor. If a tumor expresses GSTZ1, intracellular DCA concentrations will decrease towards the center of the tumor due to DCA metabolism. If the tumor contains low concentrations of chloride, subsequent doses of DCA will not be subject to significant metabolism, due to inactivation of GSTZ1 during the first dose. High tumoral chloride concentrations protect GSTZ1 from inactivation, leading to increased DCA metabolism and reduced anti-tumor activity.
This effect provided by GSTZ1 expression in the tumor is independent of the GSTZ1 normally found in the liver. We do not believe that, in a clinical setting, the metabolism of DCA by GSTZ1 in the liver would impact the phenomenon found in this study or the overall concept of DCA treatment of cancer. While the amount of GSTZ1 found in a liver is much greater than that in a tumor, most of the hepatic GSTZ1 is quickly lost to adduct formation and degradation following DCA treatment [3]. Additionally, changes in DCA plasma concentrations due to hepatic metabolism of DCA would be nullified by altering the dosage schedule over subsequent doses in a single patient or between patients with differing initial clearance rates. This would allow the maintenance of a therapeutically effective steady state concentration that would render the resistance we have observed clinically relevant.
Together, these results represent the first description of intratumoral factors that may affect a cancer cell’s responsiveness to DCA by modulating its local metabolism by GSTZ1. Abnormal regulation of GSTZ1 expression and chloride ion concentration may lead to differing rates of tumoral DCA metabolism and, consequently, to an altered therapeutic response. Both GSTZ1 and chloride ion can be measured in tumor biopsies and may serve to help stratify patients into dosage groups, based on expected response to the drug. Additionally, co-treatment with compounds to reduce GSTZ1 expression or [Cl−], such as loop diuretics, may render tumors in the highly resistant “high GSTZ1/high [Cl−]” category more susceptible to DCA therapy.
Highlights.
GSTZ1, the enzyme responsible for metabolism of DCA is often misregulated in cancer
GSTZ1 is downregulated in hepatocellular carcinoma and upregulated in breast cancer
Expression of GSTZ1 provides resistance against dichloroacetate treatment
Chloride concentrations in tumors may differ dramatically from surrounding tissues
High chloride may exacerbate the resistance provided by GSTZ1
Acknowledgments
We thank Dr. Brian Law for the gift of the parental HepG2 cells used in this study as well as the PMD2G and PsPax2 plasmids. We also thank the University of Florida Clinical and Translational Science Institute’s Biorepository for providing the specimens used in these experiments. This work was funded by a grant from the US Public Health Service, 1 RO1 GM 099871, and by the NIH/NCATS Clinical and Translational Science award to the University of Florida UL1 TR000064.
Abbreviations
- [Cl−]
chloride concentration
- DCA
dichloroacetate
- ERK
extracellular signal-regulated kinase
- GSTZ1
glutathione transferase Z1
- HER2
human epidermal growth factor receptor 2
- PDC
pyruvate dehydrogenase complex
- PDK
pyruvate dehydrogenase kinase
- VDAC
voltage-dependent anion channel
Footnotes
Publisher's Disclaimer: This is a PDF file of an unedited manuscript that has been accepted for publication. As a service to our customers we are providing this early version of the manuscript. The manuscript will undergo copyediting, typesetting, and review of the resulting proof before it is published in its final citable form. Please note that during the production process errors may be discovered which could affect the content, and all legal disclaimers that apply to the journal pertain.
References
- 1.Kankotia S, Stacpoole PW. Dichloroacetate and cancer: New home for an orphan drug? Biochim Biophys Acta. 2014;1846:617–629. doi: 10.1016/j.bbcan.2014.08.005. [DOI] [PubMed] [Google Scholar]
- 2.Li W, James MO, McKenzie SC, Calcutt NA, Liu C, et al. Mitochondrion as a novel site of dichloroacetate biotransformation by glutathione transferase zeta 1. J Pharmacol Exp Ther. 2011;336:87–94. doi: 10.1124/jpet.110.173195. [DOI] [PMC free article] [PubMed] [Google Scholar]
- 3.Anderson WB, Liebler DC, Board PG, Anders MW. Mass spectral characterization of dichloroacetic acid-modified human glutathione transferase zeta. Chem Res Toxicol. 2002;15:1387–1397. doi: 10.1021/tx025553x. [DOI] [PubMed] [Google Scholar]
- 4.Zhong G, Li W, Gu Y, Langaee T, Stacpoole PW, et al. Chloride and other anions inhibit dichloroacetate-induced inactivation of human liver GSTZ1 in a haplotype-dependent manner. Chem Biol Interact. 2014;215:33–39. doi: 10.1016/j.cbi.2014.02.015. [DOI] [PMC free article] [PubMed] [Google Scholar]
- 5.Oncomine(TM) Compendia Bioscience. Ann Arbor, MI: 2013. [Google Scholar]
- 6.Wurmbach E, Chen YB, Khitrov G, Zhang W, Roayaie S, et al. Genome-wide molecular profiles of HCV-induced dysplasia and hepatocellular carcinoma. Hepatology. 2007;45:938–947. doi: 10.1002/hep.21622. [DOI] [PubMed] [Google Scholar]
- 7.Hsiao LL, Dangond F, Yoshida T, Hong R, Jensen RV, et al. A compendium of gene expression in normal human tissues. Physiol Genomics. 2001;7:97–104. doi: 10.1152/physiolgenomics.00040.2001. [DOI] [PubMed] [Google Scholar]
- 8.Madden SF, Clarke C, Gaule P, Aherne ST, O’Donovan N, et al. BreastMark: an integrated approach to mining publicly available transcriptomic datasets relating to breast cancer outcome. Breast Cancer Res. 2013;15:R52. doi: 10.1186/bcr3444. [DOI] [PMC free article] [PubMed] [Google Scholar]
- 9.Jahn SC, Law ME, Corsino PE, Parker NN, Pham K, et al. An in vivo model of epithelial to mesenchymal transition reveals a mitogenic switch. Cancer Lett. 2012;326:183–190. doi: 10.1016/j.canlet.2012.08.013. [DOI] [PMC free article] [PubMed] [Google Scholar]
- 10.Tsikas D, Fauler J, Frölich JC. Determination of chloride in biological fluids as pentafluorobenzylchloride by reversed-phase high-performance liquid chromatography and UV detection. Chromatographia. 1992;33:317–320. [Google Scholar]
- 11.Jahn SC, Rowland-Faux L, Stacpoole PW, James MO. Chloride concentrations in human hepatic cytosol and mitochondria are a function of age. Biochem Biphys Res Commmun. 2015;459:463–468. doi: 10.1016/j.bbrc.2015.02.128. [DOI] [PMC free article] [PubMed] [Google Scholar]
- 12.Yang X, Boehm JS, Salehi-Ashtiani K, Hao T, Shen Y, et al. A public genome-scale lentiviral expression library of human ORFs. Nat Methods. 2011;8:659–661. doi: 10.1038/nmeth.1638. [DOI] [PMC free article] [PubMed] [Google Scholar]
- 13.Jahn SC, Corsino PE, Davis BJ, Law ME, Norgaard P, et al. Constitutive Cdk2 activity promotes aneuploidy while altering the spindle assembly and tetraploidy checkpoints. J Cell Sci. 2013;126:1207–1217. doi: 10.1242/jcs.117382. [DOI] [PMC free article] [PubMed] [Google Scholar]
- 14.John B, Enright AJ, Aravin A, Tuschl T, Sander C, et al. Human MicroRNA targets. PLoS Biol. 2004;2:e363. doi: 10.1371/journal.pbio.0020363. [DOI] [PMC free article] [PubMed] [Google Scholar]
- 15.Lewis BP, Burge CB, Bartel DP. Conserved seed pairing, often flanked by adenosines, indicates that thousands of human genes are microRNA targets. Cell. 2005;120:15–20. doi: 10.1016/j.cell.2004.12.035. [DOI] [PubMed] [Google Scholar]
- 16.Kertesz M, Iovino N, Unnerstall U, Gaul U, Segal E. The role of site accessibility in microRNA target recognition. Nat Genet. 2007;39:1278–1284. doi: 10.1038/ng2135. [DOI] [PubMed] [Google Scholar]
- 17.Livak KJ, Schmittgen TD. Analysis of relative gene expression data using real-time quantitative PCR and the 2(−Delta Delta C(T)) Method. Methods. 2001;25:402–408. doi: 10.1006/meth.2001.1262. [DOI] [PubMed] [Google Scholar]
- 18.Roessler S, Jia HL, Budhu A, Forgues M, Ye QH, et al. A unique metastasis gene signature enables prediction of tumor relapse in early-stage hepatocellular carcinoma patients. Cancer Res. 2010;70:10202–10212. doi: 10.1158/0008-5472.CAN-10-2607. [DOI] [PMC free article] [PubMed] [Google Scholar]
- 19.Chen X, Cheung ST, So S, Fan ST, Barry C, et al. Gene expression patterns in human liver cancers. Mol Biol Cell. 2002;13:1929–1939. doi: 10.1091/mbc.02-02-0023.. [DOI] [PMC free article] [PubMed] [Google Scholar]
- 20.Fernandez-Canon JM, Hejna J, Reifsteck C, Olson S, Grompe M. Gene structure, chromosomal location, and expression pattern of maleylacetoacetate isomerase. Genomics. 1999;58:263–269. doi: 10.1006/geno.1999.5832. [DOI] [PubMed] [Google Scholar]
- 21.Lim CE, Matthaei KI, Blackburn AC, Davis RP, Dahlstrom JE, et al. Mice deficient in glutathione transferase zeta/maleylacetoacetate isomerase exhibit a range of pathological changes and elevated expression of alpha, mu, and pi class glutathione transferases. Am J Pathol. 2004;165:679–693. doi: 10.1016/S0002-9440(10)63332-9. [DOI] [PMC free article] [PubMed] [Google Scholar]
- 22.Board PG, Baker RT, Chelvanayagam G, Jermiin LS. Zeta, a novel class of glutathione transferases in a range of species from plants to humans. Biochem J. 1997;328(Pt 3):929–935. doi: 10.1042/bj3280929. [DOI] [PMC free article] [PubMed] [Google Scholar]
- 23.Donato MT, Lahoz A, Castell JV, Gomez-Lechon MJ. Cell lines: a tool for in vitro drug metabolism studies. Curr Drug Metab. 2008;9:1–11. doi: 10.2174/138920008783331086. [DOI] [PubMed] [Google Scholar]
- 24.Shen YC, Ou DL, Hsu C, Lin KL, Chang CY, et al. Activating oxidative phosphorylation by a pyruvate dehydrogenase kinase inhibitor overcomes sorafenib resistance of hepatocellular carcinoma. Br J Cancer. 2013;108:72–81. doi: 10.1038/bjc.2012.559. [DOI] [PMC free article] [PubMed] [Google Scholar]
- 25.Lantum HB, Liebler DC, Board PG, Anders MW. Alkylation and inactivation of human glutathione transferase zeta (hGSTZ1-1) by maleylacetone and fumarylacetone. Chem Res Toxicol. 2002;15:707–716. doi: 10.1021/tx025503s. [DOI] [PubMed] [Google Scholar]
- 26.Jorquera R, Tanguay RM. Fumarylacetoacetate, the metabolite accumulating in hereditary tyrosinemia, activates the ERK pathway and induces mitotic abnormalities and genomic instability. Hum Mol Genet. 2001;10:1741–1752. doi: 10.1093/hmg/10.17.1741. [DOI] [PubMed] [Google Scholar]
- 27.Sounni NE, Cimino J, Blacher S, Primac I, Truong A, et al. Blocking lipid synthesis overcomes tumor regrowth and metastasis after antiangiogenic therapy withdrawal. Cell Metab. 2014;20:280–294. doi: 10.1016/j.cmet.2014.05.022. [DOI] [PubMed] [Google Scholar]
- 28.Langaee TY, Zhong G, Li W, Hamadeh I, Solayman MH, et al. The influence of human GSTZ1 gene haplotype variations on GSTZ1 expression. Pharmacogenet Genomics. 2015;25:239–245. doi: 10.1097/FPC.0000000000000129. [DOI] [PMC free article] [PubMed] [Google Scholar]
- 29.Chen S, Jiao JW, Sun KX, Zong ZH, Zhao Y. MicroRNA-133b targets glutathione S-transferase pi expression to increase ovarian cancer cell sensitivity to chemotherapy drugs. Drug Des Devel Ther. 2015;9:5225–5235. doi: 10.2147/DDDT.S87526. [DOI] [PMC free article] [PubMed] [Google Scholar]
- 30.Dluzen DF, Sun D, Salzberg AC, Jones N, Bushey RT, et al. Regulation of UDP-glucuronosyltransferase 1A1 expression and activity by microRNA 491–3p. J Pharmacol Exp Ther. 2014;348:465–477. doi: 10.1124/jpet.113.210658. [DOI] [PMC free article] [PubMed] [Google Scholar]
- 31.Fukaya T, Tomari Y. MicroRNAs mediate gene silencing via multiple different pathways in drosophila. Mol Cell. 2012;48:825–836. doi: 10.1016/j.molcel.2012.09.024. [DOI] [PubMed] [Google Scholar]
- 32.Ambros V. The functions of animal microRNAs. Nature. 2004;431:350–355. doi: 10.1038/nature02871. [DOI] [PubMed] [Google Scholar]
- 33.Shiozaki A, Otsuji E, Marunaka Y. Intracellular chloride regulates the G(1)/S cell cycle progression in gastric cancer cells. World J Gastrointest Oncol. 2011;3:119–122. doi: 10.4251/wjgo.v3.i8.119. [DOI] [PMC free article] [PubMed] [Google Scholar]
- 34.Soroceanu L, Manning TJ, Jr, Sontheimer H. Modulation of glioma cell migration and invasion using Cl(−) and K(+) ion channel blockers. J Neurosci. 1999;19:5942–5954. doi: 10.1523/JNEUROSCI.19-14-05942.1999. [DOI] [PMC free article] [PubMed] [Google Scholar]
- 35.Habela CW, Ernest NJ, Swindall AF, Sontheimer H. Chloride accumulation drives volume dynamics underlying cell proliferation and migration. J Neurophysiol. 2009;101:750–757. doi: 10.1152/jn.90840.2008. [DOI] [PMC free article] [PubMed] [Google Scholar]
- 36.Stacpoole PW. The pharmacology of dichloroacetate. Metabolism. 1989;38:1124–1144. doi: 10.1016/0026-0495(89)90051-6. [DOI] [PubMed] [Google Scholar]
- 37.Stockwin LH, Yu SX, Borgel S, Hancock C, Wolfe TL, et al. Sodium dichloroacetate selectively targets cells with defects in the mitochondrial ETC. Int J Cancer. 2010;127:2510–2519. doi: 10.1002/ijc.25499. [DOI] [PubMed] [Google Scholar]


