

Abstract
Background
Engagement in care is central to reducing mortality for HIV-infected persons and achieving the White House National AIDS Strategy of 80% viral suppression in the U.S. by 2020. Where an HIV-infected person lives impacts his or her ability to achieve viral suppression. Reliable transportation access for healthcare may be a key determinant of this place-suppression relationship.
Methods
ZIP code tabulation areas (ZCTAs) were the units of analysis. We used geospatial and ecologic analyses to examine spatial distributions of neighborhood-level variables (e.g. transportation accessibility) and associations with: (1) community linkage to care, and (2) community viral suppression. Among Atlanta ZCTAs with data for newly diagnosed HIV cases (2006-2010) we used Moran’s I to evaluate spatial clustering and linear regression models to evaluate associations between neighborhood variables and outcomes.
Results
In 100 ZCTAs with 8,413 newly diagnosed HIV-positive residents, a median of 60 HIV cases were diagnosed per ZCTA during the 5-year period. We found significant clustering of ZCTAs with low linkage to care and viral suppression (Moran’s I = 0.218, p<0.05). In high-poverty ZCTAs, a ten percentage point increase in ZCTA-level household vehicle ownership was associated with a four percentage point increase in linkage to care (p=0.02, R2=0.16). In low-poverty ZCTAs, a ten percentage point increase in ZCTA-level household vehicle ownership was associated with a 30 percentage point increase in ZCTA-level viral suppression (p=0.01, R2=0.08).
Conclusions
Correlations between transportation variables and community-level care linkage and viral suppression vary by area poverty level, and provide opportunities for interventions beyond individual-level factors.
Keywords: HIV care cascade, geospatial mapping, transportation, car ownership, spatial access
BACKGROUND
Communities of people with chronic, uncontrolled HIV infection serve as latent reservoirs that pose a significant challenge to long-term control and eradication of HIV in the U.S.1,2 Early initiation and retention in HIV care are central to achieving viral load suppression and reducing mortality.3,4 As advances in screening and antiretroviral therapeutics increase patients’ likelihood of achieving virologic suppression and decreasing transmission,5 reduction of HIV in the population as a whole is contingent on delivering timely and consistent medical care to infected persons in hard-to-reach communities.6,7 In light of these and other data, the White House released the National AIDS Strategy in July 2015, aiming to have 85% of newly diagnosed patients linked to clinical care within one month of diagnosis and 80% virally suppressed by 2020.
There is an increasing focus in the literature on the impact of sociocontextual variables on health outcomes, with spatial analytic tools being used to not only capture and demonstrate the relevance of these variables, but also to help inform and evaluate neighborhood-level interventions.8 Sociocontextual factors influence the well-being of a person and include factors such as discrimination, local policies, and access to healthcare, food, and transportation.9 Features of local neighborhood environments have been increasingly recognized as a key determinant of an HIV-infected person’s success in achieving viral suppression. 10-13 Where an HIV-infected person resides may be as critical, if not more so, than person-level factors in the ability of a patient to connect to an HIV provider and stay in care.11 Characterizing the geographic clustering or “hot spots” of HIV-infected persons with either delayed or absent linkage to care and those with significant viremia, the local landscape of transportation accessibility, and the sociocontextual features of their shared local environment may facilitate better local interventions to link HIV-infected persons to care and to reduce local sources of ongoing viral transmission in the population.
Although many factors contribute to decreased linkage to care and viral suppression, transportation vulnerability – defined as restriction of a resident’s ability to utilize available transportation – is a particularly relevant sociocontextual factor for patients requiring multiple regular visits to a medical clinic. Transportation vulnerability includes two key components: 1) transportation availability, the presence of transportation resources in a geographic area, and 2) accommodation, the linkage between healthcare and transportation systems. Although these components have been hypothesized to limit HIV-related primary care access, their extent has not been fully characterized14. Atlanta, one of the most transportation-inaccessible cities in the United States, is a city with high transportation vulnerability. According to a Brookings Institute study, Atlanta currently ranks 91 out of 100 cities in transportation accessibility. 15 In addition, Atlanta ranks as the city with the 5th highest HIV diagnosis rate in the U.S. 16 Collaboration between the Georgia Department of Public Health and Emory Rollins School of Public Health’s AIDSVu group recently facilitated the combination of HIV case data with zip-code level social and health care variables relevant to accessing care. By linking these variables to additional data from the U.S. Census Bureau and the Atlanta Regional Commission, the aims of our study were to: 1) identify spatial clusters of areas with lower (or higher) levels of community (ZCTA) linkage to care and community (ZCTA) viral suppression for HIV-infected persons; 2) examine spatial distributions of relevant neighborhood-level sociocontextual variables, such as markers of transportation vulnerability; and 3) investigate the relationships between local transportation vulnerability (with respect to personal and public transportation) and low linkage to care and viral suppression at the local zip code tabulation area (ZCTA) level. We focused on measures summarizing access to private (car ownership) and public (bus stops) transportation options. We hypothesized that low linkage to care and viral suppression for HIV-infected persons would correlate with fewer personal and public transportation options.
METHODS
HIV Case Counts
We obtained information on HIV case counts from AIDSVu, an online mapping resource that collects HIV data in Atlanta from the Centers for Disease Control (CDC)’s national HIV surveillance database and state/local health departments (http://www.aidsvu.org). Data for this analysis included reported persons aged 13 years and older who lived in the six counties comprising the metro Atlanta area (Clayton, Cobb, DeKalb, Douglas, Fulton and Gwinnett) with a HIV diagnosis and residential zip code reported through Georgia’s Enhanced HIV/AIDS Reporting System from January 1, 2006 through December 31, 2010. Persons who moved out of state at any point during the study period were identified through a Routine Interstate Duplication Report (RIDR) process developed by the Centers for Disease Control and Prevention (CDC) and excluded from the analysis. All data were aggregated to ZIP code tabulation area (ZCTA), a geographical unit developed by the U.S. Census to approximate USPS ZIP code areas, with stricter geometry than traditional ZIP code areas. ZCTAs whose geometric centroids were contained within the six county area were included in the analysis.
Primary Outcomes
Our two primary outcomes of interest were continuous variables measured at the ZCTA level: (1) community linkage to care, defined as defined as the percentage of persons diagnosed with HIV between 2006 and 2010 who were linked to care within 3 months of their diagnosis, and (2) community viral suppression, defined as percentage of persons diagnosed with HIV between 2006 and 2010 who were virally suppressed by the end of 2011. The percentage linked to care was defined as the number of persons with a CD4 or viral load test reported to the Georgia Public Health Department within three months of diagnosis divided by the total number of persons diagnosed with HIV between 2006-2010 living in that ZCTA that year, through 90 days beyond December 31, 2010. Date of diagnosis was defined as the date of initial positive HIV test, and CD4 or viral loads drawn on the same day as their positive HIV test were not eligible to define a person as “linked to care.” The percentage virally suppressed was defined as the number of persons who achieved a viral load less than 200 copies/mL in the most recent viral load during 2006-2011 divided by the total number of persons newly diagnosed with HIV between 2006-2010 living in that ZCTA. Persons with no available viral load were categorized as “unlinked” and “unsuppressed.”
Sociocontextual Factors
The place-based covariates for this analysis included ZCTA-level transportation variables, provider availability, educational attainment, income inequality, poverty level, residential vacancy, and alcohol outlet density. We used two variables as proxies for transportation vulnerability: public transit access and car ownership. Public transportation access was a continuous variable defined by the number of public bus stops in a ZCTA, obtained from the Atlanta Regional Commission, with duplicate stops (to/from) removed from the analysis.17 Car ownership was calculated as the percentage of single-family households that had access to at least one vehicle (i.e., ) for each ZCTA, an approximation obtained from the U.S. Census Bureau (USCB) 2006-2010 American Community Survey 5-Year Estimates. 18
Information on major HIV/AIDS primary providers in the six county area was used to determine locations of major clinics in Atlanta. Data was compiled based on information from the Southeast AIDS Training and Education Center (SEATEC) Key Contacts booklet, the Georgia Care and Prevention in the United States (CAPUS) resource directory compiled by the Georgia Department of Public Health, the AIDS.gov HIV testing and care services locator, the Health Resources and Services Administration (HRSA) HIV treatment site locator, and from HIV-positive participants self-reporting providers in a previous Atlanta-based study.12,19-23
Information on a number of sociocontextual factors were collected from the US Census Bureau by ZCTA, including education, income inequality, and poverty. Educational attainment was defined as the percentage of people in a ZCTA over 25 years of age with at least a high school diploma or equivalent (USCB: 5-year estimates, 2006-2010). Income inequality was measured by the Gini coefficient, where zero represents perfect equality (e.g. all persons have exactly equal income) and one represents maximal inequality (USCB: 1-year estimate, 2010). Poverty was defined as the percent of the population in a ZCTA living below the national poverty line.24 ZCTAs with higher poverty rate than the average poverty rate in Georgia (18.5%, 2009-2013) were defined as high-poverty and ZCTAs with poverty rate below the average poverty rate were classified low-poverty. 25
Because the U.S. Census defines residential vacancy based on recently constructed, vacant homes in high SES neighborhoods in addition to abandoned housing, we used a modified variable for percentage of vacant houses in a ZCTA to better reflect only the latter (USCB: 5-year estimates, 2007-2011).26 We used a measure of alcohol outlets by ZCTA based on licensing information obtained from the Georgia alcohol board (U.S. Census Business Patterns, 2013). To create the density of alcohol outlets, alcohol outlet (supermarkets, convenience stores, gasoline stores, or pharmacies) count was divided by the total area in square miles for each ZCTA.27 The same method was used to create density of residential vacancies from absolute number of vacant houses.
Descriptive Statistics
We computed medians and interquartile ranges (IQRs) for the primary outcomes of interest, transportation-related factors, and other sociocontextual variables.
Spatial Analysis
We examined the spatial distribution of sociocontextual variables and outcomes of interest across ZCTAs, and used two approaches to assess univariate spatial autocorrelation. In the first approach, global Moran’s I summarized spatial autocorrelation for each outcome variable and transportation variable averaged across the full collection of ZCTAs. Next, local indicators of spatial autocorrelations (LISAs), alternately known as local Moran’s I, were used to identify locations of groups of neighboring ZCTAs where such spatial correlation was strongest. All maps were created in ArcGIS. 28 Moran’s I statistics were calculated using GeoDa and ClusterSeer, using an adjacent-neighborhood analysis approach. 29,30 Consistent with current practice, we report clusters based on an alpha of 0.05, noting that inference adjusted for multiple testing remains an open challenge for such methods. ArcMap 10.1 and TIGER/Line® 2013 shapefiles from the USCB were used to create maps.
Modeling
Spearman’s correlation coefficients were used to evaluate associations between sociocontextual variables and primary outcomes, using ZCTA as unit of analysis. Variables with a significance level of < 0.05 were eligible for inclusion in two linear regression models assessing (1) the association between sociocontextual factors and community linkage to HIV care within three months of diagnosis, and (2) the association between sociocontextual factors and community viral suppression, excluding variables demonstrating collinearity. For both models, potential interaction between poverty and transportation was evaluated by stratifying the models by ZCTA poverty rate. These analyses were conducted using SAS 9.4 (Cary, NC).
RESULTS
Descriptive Statistics
A total of 100 ZCTAs with 8,413 residents diagnosed with HIV during the 5-year study period (2006-2010) met eligibility criteria. Median HIV diagnosis rate in the study ZCTAs was 238 cases per 100,000 persons and a median of 60 (IQR 32, 98) HIV cases were identified per ZCTA during the study period (Table 1). Among ZCTAs residents, a median of 14% were living below the poverty line and 90% had at least a high school diploma or equivalent. Income inequality was not prominent (median Gini coefficient 0.4). Median residential vacancy was 18 homes per square mile (IQR 8, 42). Overall, of all people diagnosed with HIV, a median of 51% (IQR 47%, 57%) linked to care within three months of diagnosis and 44% (IQR 39%, 50%) achieved viral suppression by the end of the study period. There was wide variation in the number of public bus stops by ZCTA, with a median of 65 stops (IQR 14, 152). The median percentage of households in a ZCTA that owned a car was 93% (IQR 89%, 97%).
Table 1.
Characteristics of 100 Study Zip Code Tabulation Areas (ZCTAs), Metro Atlanta, 2006-2010
| Variable | Mean | Standard Deviation | Median | Inter-quartile Range | Number of Missing ZCTAs |
|---|---|---|---|---|---|
| Total new HIV cases | 84 | 84 | 60 | 32, 98 | 0 |
| HIV incidence# | 372 | 422 | 238 | 109, 418 | 0 |
| Percent linked to care within three months | 51.8 | 8.1 | 51.0 | 46.8, 56.8 | 4 |
| Percent of cases virally suppressed | 44.8 | 8.8 | 44.4 | 38.8, 50.0 | 2 |
| High educational attainment¥ | 88.8 | 7.6 | 89.6 | 83.6, 93.7 | 0 |
| Percent of population living Below federal poverty line | 16.2 | 9.3 | 14.2 | 9.8, 20.3 | 0 |
| Gini coefficient of income inequality | 0.4 | 0.1 | 0.4 | 0.4, 0.5 | 0 |
| Percent of occupied households with no telephone service | 3.5 | 2.2 | 3.1 | 2.2, 4.5 | 0 |
| Density of vacancies | 37.7 | 56.6 | 17.9 | 7.7, 42.2 | 0 |
| Number of public bus stops | 113 | 133 | 65 | 14, 152 | 13 |
| Ryan White HIV/AIDS Providers | 0.5 | 1.1 | 0.0 | 0.0, 1.0 | 0 |
| Alcohol outlet density | 2.4 | 2.3 | 1.9 | 1.0, 3.2 | 0 |
| Percentage of households that own a car£ | 91.3 | 8.0 | 93.4 | 88.7, 97.1 | 0 |
Percentage given as cases per 100,000 persons
Percent of people over age 25 with at least a high school diploma or equivalent
Percentage of households that owned a car was calculated from the following metrics in the American Community Survey: (total number of occupied households - households without a car) / (total number of occupied households)
Spatial Analyses
ZCTAs with lower levels of community linkage to care and viral suppression for HIV-infected persons diagnosed 2006-2010 were observed in ZCTAs within central Fulton County, an area slightly to the east of central DeKalb County, west Clayton County, and in southern Cobb County (Figure 1). Cobb County overall had the highest observed linkage-to-care percentages, with between 51% to 77% of cases linked, while Fulton and DeKalb counties had, on average, the lowest observed linkage to care percentages (ZCTAs reporting below 56% linkage to care). Cobb County had the highest observed community viral suppression levels (on average, above 45% of virally suppressed cases), while the central and southwestern parts of Fulton County and the eastern part of DeKalb County experienced low viral suppression (28%-45% suppression). HIV/AIDS providers were located in the central and north-central part of the city.
Figure 1. Newly Diagnosed HIV-infected Persons Linked to Care and Viral Suppressed, by Zip Code Tabulation Area (ZCTA), Metropolitan Atlanta, 2006-2010.
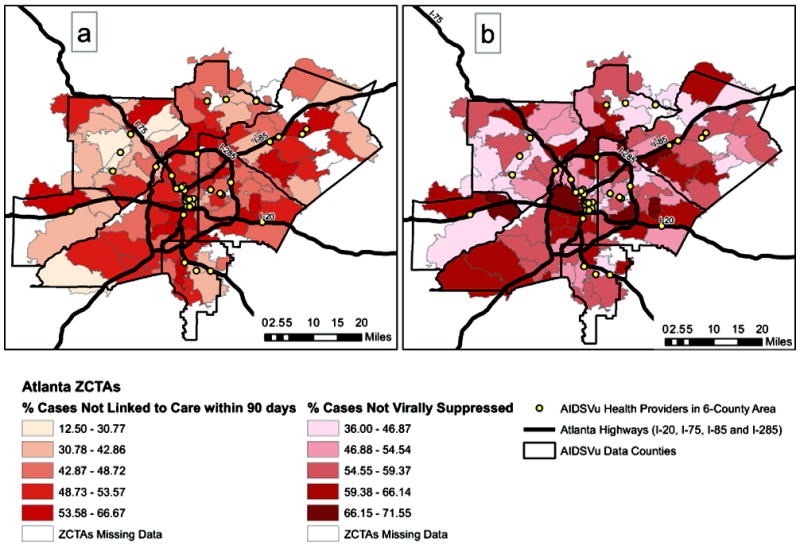
(a) Percent of HIV-infected persons newly diagnosed from January 1, 2006 through December 31, 2010 linked to care within 90 days of diagnosis, based on CD4 count or viral load reporting to the Georgia’s Enhanced HIV/AIDS Reporting System (eHARS) and aggregated by Zip Code Tabulation Area (ZCTA). (b) Percent of HIV-infected persons newly diagnosed who achieved a viral load less than 200 copies/mL in the most recent viral load reported to during the 2006-2010 time period to Georgia eHARS and aggregated by ZCTA.
There was visual evidence of geographic clustering of transportation in Atlanta (Figure 2). A greater number of bus stop counts were observed in ZCTAs along the I-20 east-west interstate, as well as along train lines. Greater levels of car ownership were found outside of the perimeter (I-285), particularly in Gwinnett and Cobb counties.
Figure 2. Public Bus Stop Distribution and Percent Household Vehicle Ownership, by Zip Code Tabulation Area (ZCTA), Metropolitan Atlanta, 2006-2010.

(a) Number of public bus stops in a Zip Code Tabulation Area (ZCTA), obtained from the Atlanta Regional Commission (2012). (b) Percentage of single-family households which owned at least one vehicle, by ZCTA, from U.S. Census Bureau (USCB) 2006-2010 American Community Survey 5-Year Estimates.
We identified significant local clusters of ZCTAs within metropolitan Atlanta that demonstrated low linkage to care (local Moran’s I = 0.218, P<0.01) and low viral suppression for HIV-infected persons (local Moran’s I = 0.059, p<0.01). A single cluster of low community linkage to care was observed in central Fulton County. Two clusters of low community viral suppression were observed, one in central Fulton, and a second in southern Dekalb, separated by a cluster of ZCTAs with high viral suppression in west Dekalb county (Figure 3). We also found local clusters of high-linkage ZCTAs neighboring other high-linkage ZCTAs and high-viral suppression ZCTAs neighboring other high-suppression ZCTAs in the northwest area of Cobb County. In regards to our transportation variables, large clusters of high bus stop count-ZCTAs were observed in central Fulton and DeKalb Counties (local Moran’s I = 0.473, p<0.001). Outside of the Perimeter, there was significant clustering of ZCTAs with high car ownership (local Moran’s I = 0.369, p<0.001) in Gwinnett and Cobb Counties, and significant clusters of low-bus stop count ZCTAs in the southern parts of Gwinnett, Cobb and Clayton Counties (local Moran’s I =0.4728, p<0.001).
Figure 3. Univariate Local Moran’s I for Community HIV Linkage to Care, Community Viral Suppression and Transportation Access Variables , Metropolitan Atlanta, 2006-2010.
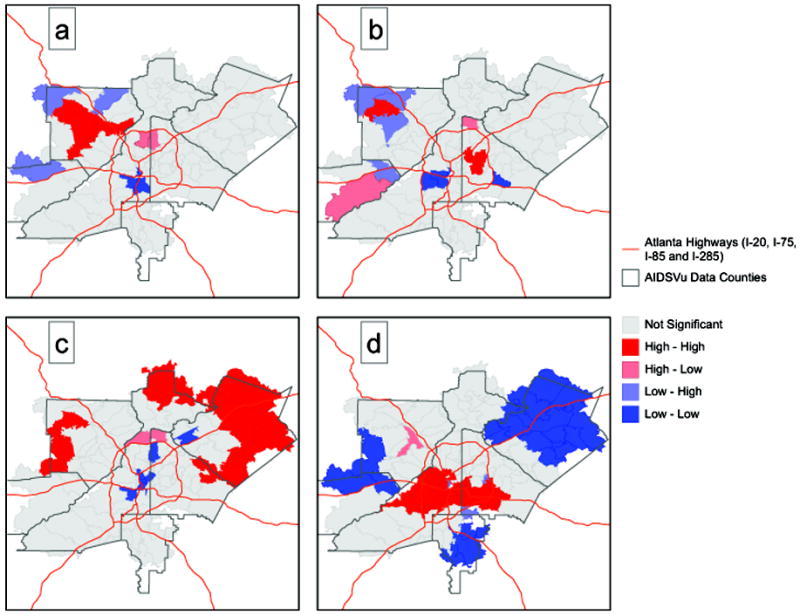
(a) Statistically significant clusters of ZCTAs with high linkage to HIV care (red) and ZCTA clusters with low linkage to care (dark blue), p <0.05 by Local Indicators of Spatial Analysis (LISA) analysis. Areas in pink represent high linkage ZCTAs surrounded by ZCTAs with low linkage; areas in light blue represent low linkage ZCTAs surrounded by ZCTAs with high linkage. (b) Significant ZCTA clusters with high viral suppression (red) and ZCTA clusters with low viral suppression (dark blue). (c) Significant ZCTA clusters with high car ownership (red) and ZCTA clusters with low car ownership (dark blue). (d) Significant ZCTA clusters with high number of bus stops (red) and ZCTA clusters with low number of bus stops (dark blue).
Modeling
In univariate analysis, ZCTAs with high poverty (p=0.02, R2=0.08), high alcohol outlet density (p<0.001, R2=0.10), low car ownership (p=0.002, R2=0.08) , and greater number of bus stops (p=0.005, R2=0.06) were significantly associated with low levels of community linkage to care (Table 2). High poverty (p<0.001, R2=0.16), high alcohol outlet density (p=0.04, R2=0.07), low car ownership (p<0.001, R2=0.11) , greater number of bus stops (p=0.02, R2=0.01), lower educational attainment (p=0.002, R2= 0.07), and greater percentages of vacant housing in the area (p=0.05, R2=0.06) were significantly associated with low levels of community viral suppression. These variables were eligible for inclusion in the linear models described below.
Table 2.
Univariate Spearman’s correlations between neighborhood-level variables and two HIV outcomes, community linkage to care and community viral suppression.
| Variable | Correlation coefficient | P-value | R square |
|---|---|---|---|
| Community Linkage to HIV Care | |||
| Education | 0.12053 | 0.242 | 0.004 |
| Poverty | -0.2454 | 0.016 | 0.081 |
| Gini | -0.1858 | 0.070 | 0.035 |
| No telephone | 0.04738 | 0.647 | <0.001 |
| Vacancy density | -0.19833 | 0.053 | 0.046 |
| HIV/AIDS Providers | -0.15079 | 0.143 | 0.008 |
| Alcohol outlet density | -0.35506 | <0.001 | 0.099 |
| Bus stops | -0.30729 | 0.005 | 0.055 |
| Car ownership | 0.31426 | 0.002 | 0.082 |
| Community Viral Suppression | |||
| Education | 0.31146 | 0.002 | 0.067 |
| Poverty | -0.35884 | <0.001 | 0.155 |
| Gini | -0.12885 | 0.206 | 0.027 |
| No telephone | -0.08113 | 0.427 | 0.006 |
| Vacancy density | -0.19876 | 0.050 | 0.056 |
| HIV/AIDS Providers | 0.0243 | 0.812 | 0.002 |
| Alcohol outlet density | -0.20562 | 0.042 | 0.065 |
| Bus stops | -0.26217 | 0.015 | 0.096 |
| Car ownership | 0.32965 | <0.001 | 0.109 |
Community Linkage to Care Model
In the stratum-specific results, low car ownership was significantly associated with low linkage to care in the high-poverty stratum (p=0.02, R2=0.16) but a significant relationship was not found in the low-poverty stratum (p=0.258). The low poverty stratum contained 69 observations, and the high poverty stratum contained 31 observations (Table 3). In high poverty ZCTAs, for every ten percentage point increase in household vehicle ownership in a ZCTA, there was an associated four percentage point increase in linkage to care. Bus stop count was not significantly associated with linkage to care in either poverty stratum.
Table 3.
Stratification of HIV Continuum Outcomes by Poverty Levels for Each Transportation Variable
| Variable | Poverty Stratum | Parameter Estimate | Standard Error | T-Value | P-value | R square |
|---|---|---|---|---|---|---|
| Linkage to Care | ||||||
| Car Ownership (%households) | ||||||
| Low poverty | 0.366 | 0.321 | 1.14 | 0.258 | 0.005 | |
| High poverty | 0.362 | 0.142 | 2.55 | 0.017 | 0.163 | |
| Bus Stop Count | ||||||
| Low poverty | -0.018 | 0.012 | -1.5 | 0.139 | 0.019 | |
| High poverty | -0.011 | 0.008 | -1.28 | 0.211 | 0.018 | |
| Viral Suppression | ||||||
| Car Ownership (%households) | ||||||
| Low poverty | 0.806 | 0.318 | 2.54 | 0.013 | 0.075 | |
| High Poverty | 0.299 | 0.164 | 1.82 | 0.079 | 0.074 | |
| Bus Stop Count | ||||||
| Low poverty | -0.014 | 0.014 | -1.00 | 0.323 | 0.018 | |
| High poverty | -0.023 | 0.008 | -2.81 | 0.009 | 0.204 |
Community Viral Suppression Model
In the viral suppression models, high car ownership was significantly associated with suppression in the low-poverty stratum; every ten percentage point increase in household vehicle ownership in a ZCTA was associated with a 30 percentage point increase in ZCTA-level viral suppression (p=0.01, R2=0.08). High bus stop count was associated with viral suppression in the high-poverty stratum but with less impact; every additional 10 bus stops in a ZCTA was associated with a 0.08% increase in ZCTA-level viral suppression (p <0.01, R2=0.20).
DISCUSSION
We found significant positive spatial autocorrelation of ZCTAs with low linkage to care and viral suppression, as well as significant ZCTA clusters with high linkage and suppression. We demonstrate at a general level that greater number of bus stops, while often assumed to be an indicator of good transportation access and better linkage to care, may actually be better designated in the Metro Atlanta area as a marker of high poverty in the linkage and retention in care paradigm. We found differing associations when we stratified ZCTAs by poverty rate. In high-poverty areas, ZCTAs with higher car ownership have better linkage to care, and ZCTAs with more bus stops had significantly higher viral suppression; these associations were not statistically significant in low-poverty ZCTAs. This suggests that, particularly for high-poverty areas with high HIV burden, access to a car for a first clinic visit may be important in overcoming initial barriers in engaging in clinical care, and access to long-term public transportation may be the key to sustained medical care.
In a previous study, our group evaluated transportation accessibility with regards to HIV infection and noted poor areas suffer from lack of car ownership and long public transit travel times. 11,12 The present analysis specifically looked at associations of transportation outcomes along the care continuum beyond HIV diagnosis, with the most important outcome of viral suppression. Researchers studying the epidemic in the Northeast U.S. recently described the spatial pattern of HIV care in Philadelphia and found geographic areas with low retention in HIV clinic had greater access to public transit.2 Our initial findings prior to stratification suggest that stratifying smaller geographic units by poverty level might reveal a different relationship between transportation-related factors and retention in care in Philadelphia and other large U.S. cities with significant HIV burden.
In the spatial analyses, distinct geographic clusters were also found for ZCTAs with low linkage to care for HIV-infected persons and for ZCTAs with low viral suppression, and the pattern of clusters was geospatially different. The single cluster of ZCTAs in central Fulton County may represent challenges with both linkage and viral suppression. The cluster of ZCTAs with low viral suppression in Dekalb suggests that local county linkage processes for newly diagnosed HIV patients may be effective, but further interventions are needed for retention and viral suppression in that area.
This study has some limitations. As an ecologic study, we observe associations with HIV linkage and viral suppression via case counts per ZCTA, not at the person-level. Findings should be considered exploratory, and further studies more fully characterizing the relationship between transportation access and HIV care outcome should be undertaken. Given that we looked at ZCTA features where an HIV-infected person lived, our analysis did not include non-residential travel, an important metric when realizing that many people may seek treatment coming from work or other activities. Furthermore, given that our primary outcomes were based on lab-reporting to Georgia Department of Public Health, we may have underestimated percentages of linkage and viral suppression for HIV-infected persons. Specifically, given the geographic mobility of the study population, we did not expect complete capture of patient movement, and realize that some patients classified as “poorly linked” or “virally unsuppressed” may have moved outside of Georgia after diagnosis without being identified through the Routine Interstate Duplication Report process if they did not present for care in the other state. Future work includes utilization of recently described sampling-based “tracing” to quantify misclassification bias. Self-report of address data may also have introduced bias.
The results above motivate additional lines of investigation to better understand local impacts of poverty and transportation accessibility. The observed heterogeneity of associations across strata of poverty rates reported above suggests that future analyses based on more comprehensive multivariate analysis (e.g., via principal components or factor analysis) may reveal additional subtleties in these varying associations. Such analyses are the subject of future research but raise additional challenges in interpretation of complex, multivariate associations. Coupled with the results above, more complex analyses offer expanded potential to refine conceptual constructs of the underlying interactions between socioeconomic and transportation processes driving observed neighborhood-level patterns in linkage to care and viral suppression.
Atlanta’s transportation networks have been linked to historical trends in segregation, as well as to current trends in poverty. 31 In particular, both the I-20 and the I-85/I-75 highways separate clusters of ZCTAs, in terms of poverty rates and other characteristics – our analysis specifically shows that in the southwest quadrant of Atlanta, there appears to be a large cluster of ZCTAs with high bus stop count, low car ownership, and high percentages of other poverty-related metrics. Furthermore, outer counties which historically have turned down public transit expansion tend to have low bus stop counts, high car ownership, and lower rates of poverty-related metrics, all significantly associated with higher viral suppression.
As national priorities increasingly value not only diagnosing HIV-infected patients but also optimizing their ability to achieve viral suppression, thereby reducing transmission as well as individual morbidity and mortality, we must look beyond predictors at the person-level and operational features at the clinic-level to neighborhood-level factors that may be modifiable. Framing the HIV continuum as a map in association with ZCTA-level features allows us to address the problem at a macro-level with structured and data-driven approaches. Changing the transportation landscape of metropolitan Atlanta in the poorest zip code areas may seem daunting, but perhaps advising clinicians to at least ask about access to a vehicle at the time of diagnosis or access to public transportation at follow-up appointments will help us get one step closer to increasing our linkage and retention to care statistics.
Acknowledgments
This study was supported by the Center for AIDS Research at Emory University (NIH/NIAID P30 AI050409), NIH/NIAID 1K23AI116388 and NIH R01 DA03510103. We would like to thank Kim Elmore, PhD, Medical Geographer and Geospatial Scientist, Division of HIV/AIDS Prevention (DHAP), at the Centers for Disease Control (CDC) and Ryan Wiegand, PhD, Mathematical Geostatistician at CDC for their advising on the project. We also appreciate the support of Dr. Michael Kramer in the Division of Epidemiology at the Rollins School of Public Health at Emory University.
Sources of support: NIH/NIAID P30 AI050409 and the NIH/NIAID 1K23AI116388.
Footnotes
Presented at: Conference on Retroviruses and Opportunistic Infections, February 2014, Boston, MA
Conflicts of interest: All authors declare no conflicts of interest.
References
- 1.Dennis AM, Hue S, Hurt CB, et al. Phylogenetic insights into regional HIV transmission. AIDS. 2012 Sep 10;26(14):1813–1822. doi: 10.1097/QAD.0b013e3283573244. [DOI] [PMC free article] [PubMed] [Google Scholar]
- 2.Yanik EL, Napravnik S, Hurt CB, et al. Prevalence of transmitted antiretroviral drug resistance differs between acutely and chronically HIV-infected patients. J Acquir Immune Defic Syndr. 2012 Oct 1;61(2):258–262. doi: 10.1097/QAI.0b013e3182618f05. [DOI] [PMC free article] [PubMed] [Google Scholar]
- 3.Mugavero MJ, Amico KR, Westfall AO, et al. Early retention in HIV care and viral load suppression: implications for a test and treat approach to HIV prevention. J Acquir Immune Defic Syndr. 2012 Jan 1;59(1):86–93. doi: 10.1097/QAI.0b013e318236f7d2. [DOI] [PMC free article] [PubMed] [Google Scholar]
- 4.Mugavero MJ, Lin HY, Willig JH, et al. Missed visits and mortality among patients establishing initial outpatient HIV treatment. Clin Infect Dis. 2009 Jan 15;48(2):248–256. doi: 10.1086/595705. [DOI] [PMC free article] [PubMed] [Google Scholar]
- 5.Cohen MS, Chen YQ, McCauley M, et al. Prevention of HIV-1 infection with early antiretroviral therapy. The New England journal of medicine. 2011 Aug 11;365(6):493–505. doi: 10.1056/NEJMoa1105243. [DOI] [PMC free article] [PubMed] [Google Scholar]
- 6.Centers for Disease Control and Prevention. [July 30, 2012];High-Impact HIV Prevention: CDC’s Approach to Reducing HIV Infections in the United States. 2011 Available at: http://www.cdc.gov/hiv/strategy/dhap/pdf/nhasbooklet.pdf.
- 7.Skarbinski J, Rosenberg E, Paz-Bailey G, et al. Human immunodeficiency virus transmission at each step of the care continuum in the United States. JAMA internal medicine. 2015 Apr;175(4):588–596. doi: 10.1001/jamainternmed.2014.8180. [DOI] [PubMed] [Google Scholar]
- 8.Goswami ND, Hecker EJ, Vickery C, et al. Geographic information system-based screening for TB, HIV, and syphilis (GIS-THIS): a cross-sectional study. PLoS One. 2012;7(10):e46029. doi: 10.1371/journal.pone.0046029. [DOI] [PMC free article] [PubMed] [Google Scholar]
- 9.http://www.cdc.gov/nchhstp/socialdeterminants/faq.html CoDCSDoHM.
- 10.Eberhart MG, Yehia BR, Hillier A, et al. Behind the cascade: analyzing spatial patterns along the HIV care continuum. J Acquir Immune Defic Syndr. 2013 Nov 1;64(Suppl 1):S42–51. doi: 10.1097/QAI.0b013e3182a90112. [DOI] [PMC free article] [PubMed] [Google Scholar]
- 11.Eberhart MG, Yehia BR, Hillier A, et al. Individual and Community Factors Associated With Geographic Clusters of Poor HIV Care Retention and Poor Viral Suppression. J Acquir Immune Defic Syndr. 2015 May 1;69(Suppl 1):S37–43. doi: 10.1097/QAI.0000000000000587. [DOI] [PMC free article] [PubMed] [Google Scholar]
- 12.Dasgupta S, Kramer MR, Rosenberg ES, Sanchez TH, Sullivan PS. Spatial Accessibility to HIV Providers in Atlanta, Georgia. AIDS Res Hum Retroviruses. 2015 May;31(5):473–474. doi: 10.1089/aid.2014.0365. [DOI] [PMC free article] [PubMed] [Google Scholar]
- 13.Division of HIV/AIDS Prevention. Understanding the HIV Care Continuum. Centers for Disease Control and Prevention; 2014. [Google Scholar]
- 14.Sagrestano LM, Clay J, Finerman R, Gooch J, Rapino M. Transportation vulnerability as a barrier to service utilization for HIV-positive individuals. AIDS Care. 2014;26(3):314–319. doi: 10.1080/09540121.2013.819403. [DOI] [PubMed] [Google Scholar]
- 15.The Brookings Institution. Missed Opportunity: Transit and Jobs in Metropolitan America. Atlanta-Sandy Springs-Marietta, GA Metro Area: 2015. [Google Scholar]
- 16.Powered by: AIDSVu. [May 4 2015];Mapping The HIV Care Continuum. http://hivcontinuum.org/about-us.html.
- 17.Info Center Resources. Atlanta Regional Commission. 2014 http://www.atlantaregional.com/info-center.
- 18.United States Census Bureau. American Community Survey. 2013 http://www.census.gov/acs/www/
- 19.Dasgupta S, Vaughan AS, Kramer MR, Sanchez TH, Sullivan PS. Use of a Google Map Tool Embedded in an Internet Survey Instrument: Is it a Valid and Reliable Alternative to Geocoded Address Data? JMIR Res Protoc. 2014;3(2):e24. doi: 10.2196/resprot.2946. [DOI] [PMC free article] [PubMed] [Google Scholar]
- 20.Georgia CAPUS (Care and Prevention in the United States)
- 21.Southeast AIDS Traning and Education Center (SEATEC) Key Contacts
- 22.AIDS.gov
- 23.U. S. Department of Health and Human Services: Health Resources and Services Administration
- 24.U. S. Department of Health and Human Services Poverty Guidelines
- 25.United States Census Bureau. Georgia QuickFacts from the US Census Bureau. United States Census Bureau; 2015. http://quickfacts.census.gov/qfd/states/13000.html. [Google Scholar]
- 26.Cooper HL, Linton S, Haley DF, et al. Changes in Exposure to Neighborhood Characteristics are Associated with Sexual Network Characteristics in a Cohort of Adults Relocating from Public Housing. AIDS and behavior. 2015 Jun;19(6):1016–1030. doi: 10.1007/s10461-014-0883-z. [DOI] [PMC free article] [PubMed] [Google Scholar]
- 27.Matthews SA, McCarthy JD, Rafail PS. Using ZIP code business patterns data to measure alcohol outlet density. Addictive behaviors. 2011 Jul;36(7):777–780. doi: 10.1016/j.addbeh.2011.02.009. [DOI] [PMC free article] [PubMed] [Google Scholar]
- 28.ArcGIS Desktop: Release 10 [computer program] Redlands, CA: Environmental Systems Research Institute; 2011. [Google Scholar]
- 29.Anselin L, Syabri I, Kho Y. GeoDa: an introduction to spatial data analysis. Geographical analysis. 2006;38(1):5–22. [Google Scholar]
- 30.ClusterSeer: Release 2. 5.1 [computer program] 2001-2011 [Google Scholar]
- 31.Bayor RH. Roads to Racial Segregation Atlanta in the Twentieth Century. Journal of Urban History. 1988;15(1):3–21. [Google Scholar]