

Abstract
The main tenet of physical biology is that biological phenomena can be subject to the same quantitative and predictive understanding that physics has afforded in the context of inanimate matter. However, the inherent complexity of many of these biological processes often leads to the derivation of complex theoretical descriptions containing a plethora of unknown parameters. Such complex descriptions pose a conceptual challenge to the establishment of a solid basis for predictive biology. In this article, we present various exciting examples of how synthetic biology can be used to simplify biological systems and distill these phenomena down to their essential features as a means to enable their theoretical description. Here, synthetic biology goes beyond previous efforts to engineer nature and becomes a tool to bend nature to understand it. We discuss various recent and classic experiments featuring applications of this synthetic approach to the elucidation of problems ranging from bacteriophage infection, to transcriptional regulation in bacteria and in developing embryos, to evolution. In all of these examples, synthetic biology provides the opportunity to turn cells into the equivalent of a test tube, where biological phenomena can be reconstituted and our theoretical understanding put to test with the same ease that these same phenomena can be studied in the in vitro setting.
TOC image
We present various exciting examples of synthetic biology as a means to distill biological systems to their essential features in order to make them theoretically tractable. This approach complements the use of synthetic biology as an engineering tool by making it possible to bend nature to understand it. We discuss various exciting experiments featuring this approach to turn cells into test tubes and uncover the theoretical basis of phenomena ranging from bacteriophage infection, to transcriptional regulation in bacteria and in developing embryos, to evolution.

Introduction
In recent years we have witnessed a revolution in our ability to reprogram and control cellular behavior. From the creation of biofuels, medicines and food, to cells that can seek and target tumors, to tissues and organs grown in vitro, synthetic biology is rapidly developing as a modern engineering discipline that leverages our understanding of the inner workings of cells, rewiring them for a host of interesting and important tasks.[1] In parallel with these efforts at synthetic biology as bioengineering, an alternative view of the subject has emerged that goes beyond reprogramming cells to do our own bidding. Inspired by the dictum of biochemistry of in vitro reconstitution as a proof of understanding through synthesis, the objective of these alternative synthetic biology efforts is to construct simplified systems that allow us to test rigorous and quantitative hypotheses about biological processes.[2]These approaches strip biological phenomena down from their full and amazing complexity, leaving only the essential elements that are being tested. In our view, such synthetic efforts make it possible to determine which biological details matter and which ones are of lesser relevance when trying to achieve a predictive understanding of biological processes. In this review we feature some of our favorite examples of how this synthetic biology toolbox has advanced our understanding of diverse phenomena ranging from cellular decisions in “simple” bacteria all the way to experimental evolution where entire ecosystems and evolutionary trajectories are contrived to make it possible to test specific hypotheses. Note that this article intends to provide just a few of our favorite representative examples that reveal a different style of synthetic biology and thereby falls way short of giving a scholarly survey of the many exciting contributions from the recent literature.
A central thesis of this article is that a predictive view of many processes in biology can be achieved in much the same way that approaches in physics have provided us with a predictive understanding of a wide range of phenomena in the inanimate world. In our view, the complexity of biological phenomena does not render them inaccessible to such predictive approaches. In fact, in many experiments only a few “knobs” are tuned with reproducible consequences, seeming to imply that the process of interest admits of a reduced description controlled by those knobs. We hypothesize that the roadblock to such predictive power stems from our ignorance about many of the molecular details underlying biological phenomena, not all of which actually matter. This is, of course, not a new discussion. Indeed, it was not until Friedrich Wöhler’s synthesis of urea that the influence of a mysterious vital force in synthesizing organic compounds was disproved [3, 4] and it appears that approaches from synthetic biology now provide the opportunity to augment and complement in vitro approaches by turning the cell into what our friend Jon Widom liked to call “the test tube of the 21st century” [5, 6].
A combinatorial explosion of biological interactions
Efforts to achieve a predictive understanding of biological phenomena are often met with resistance. One common argument is that biology is different from other branches of science in that it is inherently too complex to admit of predictive approaches. In this view, the plethora of combinatorial interactions between the different molecules mediating the phenomenon of interest present an insurmountable barrier to a description that captures all molecular detail. Hence, the argument goes, such lack of access to the details of all interactions makes it impossible to predict the outcome of biological processes. Yet, in other contexts we understand considerably complex phenomena that do not require access to all the microscopic degrees of freedom. Type into Google the words “cloud streets” and look at the beautiful patterns that emerge in the collective motions of the many molecules of different types that make up our atmosphere. Here, though we have no access (nor do we want it) to the underlying molecular details, this does not imply that one cannot construct predictive understanding of this phenomenon. Perhaps more compellingly, think about predicting what will happen when a given individual is driving a car. Will that person have an accident? Will their car stall at an intersection while waiting for a left turn? Who knows. And yet, like in the case of atmospheric patterns, we can say much about the number of accidents on a given stretch of highway with great confidence, belying the need for knowing the details of individual behavior. Similarly, in some cases, complex biological phenomena have been successfully described with reduced models that depend on only a few key parameters and ignore a vast majority of the complexity to predict a reproducible biological response.
Biological complexity is indeed a fact of nature. As a toy example, we consider the case of a hypothetical DNA regulatory region bearing three binding sites for an activator as shown schematically in Fig. 1A. When bound, each activator interacts with the transcriptional machinery. In addition, these activators interact with each other cooperatively. As a result, activator concentration will determine the output rate of mRNA production in a non-linear manner as shown schematically in Fig. 1B,[7, 8, 9] though we should emphasize that one of the biggest challenges to making predictive models of such regulatory motifs is that we don’t know the rules relating the occupancy of a particular constellation of binding sites and the level of transcription. The simplest theoretical model that describes how the concentration of activator dictates mRNA production will need to account for the different configurations that activator molecules can adopt on the DNA. This exercise alone yields eight possible states (Fig. 1C), characterized by at least nine unique molecular parameters: three binding energies accounting for the interaction of activator with each binding site, three energies of interactions between bound activators, and three energies of interaction of each bound activator with the transcriptional machinery. A theoretical model that affords predictive power over this regulatory architecture thus has at least nine parameters. Inferring the parameters of such a nine-dimensional model by fitting to what is effectively one-dimensional data (Fig. 1B) is a challenge not only computationally, but even more importantly, conceptually. This example already illustrates the limits of a theoretical approach aimed at predictively describing how wild-type DNA regulatory regions function and really underlines the important role synthetic biology can play in allowing us to manipulate the system one parameter at a time to tease apart these complex systems. One strategy also highlighted in the figure is to systematically reduce the number of binding sites. As shown in Fig. 1C, a decrease in binding site number leads to a decrease in the number of possible states and in the number of parameters. Hence, this strategy can be used to attempt to determine parameters hierarchically.
Figure 1.

Combinatorial complexity of a simple regulatory motif. (A) Even for a modest regulatory architecture featuring only three activator binding sites and a binding region for RNA polymerase, the number of distinct states and parameters is daunting. (B) These molecular parameters and multiple occupancy states conspire together to dictate a non-linear input-output function determining rate of mRNA production as a function of activator concentration. (C) Counting up the number of distinct states of occupancy for the activator. By synthetically simplifying the regulatory architecture it is possible to reduce the combinatorial complexity and determine parameters dictating levels of gene expression.
The large number of states and parameters is a reality of biology. To illustrate this complexity in the context of transcriptional regulation in E. coli we resort to the RegulonDB database [10]. This database reveals that the average annotated operon contains approximately 4 (3.6, to be more precise) transcription factor binding sites.[11] Hence, 24 = 16 unique states are required to describe all possible binding arrangements of activators and repressors in the average bacterial operon. Further, as shown in Fig. 2A, many E. coli operons have more than 100 unique binding states. Regulatory complexity goes well beyond the realm of transcriptional regulation and into other significant aspects of biological regulation such as signaling. To illustrate this point, in Fig. 2B we show a hypothetical “typical” protein and consider the number of residues on the surface of this protein that can be subject to phosphorylation. We estimate that this average protein contains 14 such residues on its surface. Thus, this average protein can be found in any of the unique 214 ≈ 16, 000 signaling combinations! [12]
Figure 2.

Combinatorial complexity in biology. (A) Distribution of regulatory states in annotated E. coli operons according to RegulonDB. The number of states was obtained by calculating 2N, where N is the number of binding sites per operon. (B) Signaling complexity of a model protein. We consider a protein radius R = 2 nm, a residue radius r = 0.5 nm, and that only 2 (serine and threonine) out of the 11 polar residues can be phosphorylated.[91]
All of these examples illustrate the challenges associated with reaching a predictive description of signaling and regulation. However, we are hopeful that such challenges are not insurmountable. Instead, we argue that the road to predictive understanding necessitates a fundamentally different approach. In particular, we believe there is much to be gained by moving away from the “real” biology to model situations in which the system is sufficiently simple to permit a rigorous interplay between theory and experiments. Perhaps an analogy from the emergence of mechanical engineering can make our thinking more clear. Hardly anyone fails to be impressed by the great cathedrals of Europe, adorned as they are with their magnificent flying buttresses. These structures, though beautiful, serve an important mechanical function as well. Their emergence was based upon empirical observations. But to go beyond such enlightened empiricism to get to the architectural structures of the modern world required a step back away from the “real” architecture to consider instead highly simplified geometries such as slender rods subjected to point loads on their ends. Though one could denigrate such efforts by noting that they are not the real structures one “really cares about”, over the long haul, by mastering such simple systems, our understanding of the real systems passed to a much higher level. Similar analogies apply in the emergence of the digital revolution. Before developing sophisticated modern integrated circuits, one has to first establish the intellectual infrastructure associated with seemingly trivial RC circuits. Perhaps this philosophy can be more useful in the biological setting than has been considered thus far.
Bending nature to understand it
At first cut, one might think that biological complexity requires us, as described above, to develop theoretical efforts that involve complex models with many unknown parameters. In this article we emphasize an alternative approach: rather than bending our models to fit nature, we argue that we should bend nature such that we can have a direct dialogue between our models and experiments. In this kind of approach, as our predictive understanding of natural phenomena increases so too can the complexity of the experimental situations we explore, where steps forward are built confidently upon rigorous foundations.
To illustrate the concept of bending nature to understand it, we draw an example from what could be called “synthetic quantum mechanics”. One of the challenges that defined the early days of trying to understand the world of atoms and molecules was to predict the different energy levels of these systems. These energy levels in turn determine the atomic and molecular spectra which are accessible experimentally. However, these calculations are very complex, even in the case of the simplest atoms such as hydrogen. There are many layers of complexity coming from various interactions that the electrons and nuclei are subjected to. For example, a precise calculation of atomic energy levels needs to account not only for the electrostatic interaction of the electron with the proton in the nucleus, but also for the coupling of the electron spin to its orbital angular momentum.[13] An alternative route to a first understanding of the energy levels of quantum particles in nuclei, atoms, molecules and even solids is the so-called particle in a box. The idea of such a model is to pretend that the electron feels no potential when it is within the confines of the box and it meets an infinite barrier when it reaches the walls. Of course, the energy levels of the particle in a box are not considered a precise representation of atomic or molecular energy levels. However, this “quantum corral” serves the purpose of providing an initial, tractable system with which to put our most basic understanding of quantum mechanics to a test. Interestingly, these oversimplified models went a long way towards interpreting the spectra of dye molecules that are central to the process of photosynthesis, long before computer power was sufficient to make it possible to do more realistic calculations.[14, 15]
The surprising feat of experimentally creating a quantum corral was accomplished by using a scanning tunneling microscope to arrange iron atoms on a copper surface to form a circle as shown in Fig. 3A.[16] The resulting circular structure serves as a “box” that electrons cannot escape from. Using a scanning tunneling microscope, it is possible to measure the energy levels of electrons confined within this corral. The wave function of the electrons is shown in Fig. 3B and the energy levels for such an electron can be found in Fig. 3C. As shown in Fig. 3C, these measured energy levels coincide to a large degree with those expected from a simple textbook calculation. This interplay between theory and experiment in the context of the quantum corral is just one synthetic step along the way to a precise description of complicated molecules. In the following sections we explore how a similar synthetic approach in the context of biology can lead to a predictive understanding of cellular decision-making.
Figure 3.

Synthetic quantum mechanics. (A) Building a quantum corral by placing iron atoms in a circle on a crystalline surface. (B) Electronic wave function within the corral measured using a scanning tunneling microscope. (C) Observed (dots) and computed (lines) energy levels for a quantum corral. (Adapted from [16].)
The knobs of the synthetic biology toolbox
Building a quantum corral such as shown in Fig. 3 necessitates knowledge about the atoms to be used to make the corral as well as the ability to manipulate these atoms at will. In the biological context, bending nature by building simple, theoretically tractable biological systems required both knowledge of the molecular players as well as the capability to synthetically exploit these players. Further, in analogy with the quantum case, the construction of such an experimental system should be motivated by a putative theoretical understanding of that system. For example, for the case of transcriptional regulation Fig. 4 shows several examples of the available regulatory “knobs” that can be synthetically tuned to systematically alter, for instance, transcription factor copy number, transcription factor binding site affinity, separation, and number. In addition, in the context of eukaryotes, binding site accessibility can be tuned by dictating the relative position of these binding sites with respect to nucleosomes. Finally, in the bacterial case, the number of copies of a gene on, for example, a plasmid, has also emerged as a relevant control knob.
Figure 4.

A synthetic biology toolkit. Regulatory knobs that can be tuned both theoretically and experimentally in order to control gene expression.
The effect of these various knobs on gene expression has been characterized theoretically in great detail. The predictions afforded by these theoretical models can only be tested in the context of biological systems where these regulatory knobs can be tuned experimentally one at a time. It is virtually impossible to implement such an approach in the context of biological phenomena whose relevant molecular players are unknown. Hence, to enable the bending of nature to reach a predictive understanding of some signaling or transcriptional regulatory circuit, it is important to focus on biological case studies where the identities of the underlying molecular players has already been uncovered. We define such case studies as the analog of the “hydrogen atom” in physics: a study that is simple enough to be theoretically and experimentally tractable, yet rich enough in its phenomenology to capture the essence of more complex phenomena. Work to systematically dissect the molecular underpinnings of bacterial case studies has made it possible to harness their molecular components to test our understanding and engineer novel biological function. Impressive examples range from the construction of toggle-switches [17] and oscillators [18, 19] to the engineering of bacteria that respond to light [20] to the construction of logic gates [21, 22, 23, 24]. Indeed, the design of bacterial synthetic circuits has become a widespread practice which has led to the creation of biological parts lists in the hope of standardizing synthetic design efforts.[25] In the next sections we will explore several such “hydrogen atoms” in the context of bacterial gene regulation, the lysis-lysogeny decision associated with bacteriophage infecting bacteria, embryonic development, and evolution.
Bending the lac operon in bacteria
Many of the most important initial insights into the study of transcriptional regulation have originated from exercises in bending nature to understand it. Some examples of these synthetic efforts that we find most inspiring are provided by the series of activator-bypass experiments conducted in the 1990s.[26, 27, 28, 29] These experiments were aimed at testing the modularity of the proteins involved in transcriptional activation, and were enlightening and successful in both bacteria and yeast. For instance, in one class of activator bypass experiments the DNA binding domain of activator I was fused to the activation domain of activator II. The result is a new chimeric activator that uniquely combines the DNA binding sequence of activator I with the molecular mechanism of activation of activator II.[30, 31] In addition to shedding light on the design principles behind transcriptional activators, the insights afforded by bypass experiments opened the door to the construction of synthetic transcription factors. The Gal4 and TetR systems with all their variants, are perhaps two of the best examples of the far-reaching consequences of these pioneering experiments.[32, 33] Furthermore, this knowledge has been harnessed as a tool to discover in vivo interactions between molecules such as protein-DNA interactions in promoter regions where the regulatory interactions were previously unknown [34, 35] or novel protein-protein interactions [36].
For us, the “hydrogen atom” of bacterial transcriptional regulation is the lac operon of E. coli [37]. 50 years of continuous work on this system has provided us with an exquisite understanding of its molecular players as well as with numerous strategies to manipulate them by tuning regulatory knobs.[38] The lac operon encodes for the enzyme β-galactosidase, which mediates lactose metabolism. In the absence of lactose, the Lac repressor (LacI) binds to three DNA sites in the vicinity of the lac promoter. Lac repressor can also bind to two of these sites simultaneously resulting in the formation of a loop of the intervening DNA. This interplay between DNA binding and looping leads to a decrease in the rate of β-galactosidase production. However, the presence of lactose leads to the production of the disaccharide allolactose, which binds to Lac repressor and reduces its DNA-binding affinity. Hence, lactose induces the production of β-galactosidase. Thus, as shown in Fig. 5, regulation of the lac operon has multiple layers: repressor binds to multiple sites and loops the DNA excluding RNA polymerase from the promoter, and inducer is transported into the cell and binds to repressor, which leads to an allosteric change in repressor conformation that decreases its DNA binding affinity. A superficial assessment of regulation in the lac operon would then be prone to claims that these multiple layers of regulation make it too complex to be understood from a quantitative perspective. However, through the exercise of rewiring the lac operon to make it simpler, recent experiments have led to an impressive list of successes in the predictive understanding of transcriptional regulation, and even in those cases where the predictions fall short, this reveals shortcomings in our presumed understanding.
Figure 5.

The multiple layers of complexity of the lac operon. Inducer can enter the cell actively through a channel or passively through the membrane. Inducer binds Lac repressor and reduces its affinity to DNA. In the absence of inducer, Lac repressor can be bound to any of its three sites in the operon. The repressor can bind to multiple sites simultaneously, resulting in the formation of a DNA loop.
How does one navigate the numerous states and molecular parameters necessary to describe the lac operon (Fig. 5)? Over the last 30 years, multiple labs have embarked on a systematic effort aimed at reaching a predictive understanding of this operon by rewiring it to create simplified DNA regulatory motifs. For example, by constructing operons with only one binding site for Lac repressor, all the complexity originating from DNA looping can be avoided. Furthermore, if the number of Lac repressor molecules within the cell are directly tuned, then the inducer import pathway and its interaction with repressor can be circumvented. Indeed, this simple repression architecture is characterized by one free parameter: the in vivo binding energy of repressor to the DNA. Hence, simple repression, despite not being the “real biology”, provides an ideal platform for an initial dissection of the lac operon. Experiments performed on this regulatory architecture by the Müller-Hill lab [39] were analyzed using thermodynamic models in order to extract the in vivo binding energy of Lac repressor to its various DNA targets [40, 9]. These binding energies were then used as input parameters of thermodynamic models in order to generate the predictions shown as lines in Fig. 6A.[41, 42] These curves predict the fold-change in gene expression as a function of repressor copy number, binding site affinity, and gene copy number (which can be controlled by placing the operon on a plasmid or by integrating multiple copies on the genome). To respond to such predictions, a series of experiments was undertaken where these regulatory knobs were systematically tuned. The result of these experiments are shown in Fig. 6A. The agreement between theory and experiment is a testament to the predictive power that can be achieved by a combination of synthetic biology with theoretical models.
Figure 6.

Regulatory knobs for the synthetic dissection of the lac operon in E. coli. (A,B) Tuning the simple repression motif by modulating binding site affinity, repressor copy number, and reporter gene copy number. The resulting (A) mean and (B) noise in gene expression are measured and compared to predictions from theoretical models based on statistical mechanics. The fold-change in gene expression is defined as the ratio between the gene expression levels in the presence and absence of repressor. The Fano factor is used as a measure of cell-to-cell variability. (C,D) The DNA loop length knob. (C) Repression (inverse fold-change) as a function of operator distance in a lac operon mutant bearing only two repressor binding sites. (D) The fold-change in gene expression as a function of repressor concentration can be described by the same looping free energy regardless of the choice of binding sites indicating that this energy is only a function of the DNA in the loop. (E) Level of in vivo gene expression or in vitro Lac repressor binding as a function of inducer concentration for several lac operon variants. The systematic elimination of key regulatory effects in vivo, such as the presence of an active pump for the inducer and DNA looping in the lac operon, leads to a regulatory behavior comparable to that of the simple in vitro situation (A, adapted from [42]; B, adapted from [47]; C, adapted from [48]; D, adapted from [40, 9]; E, adapted from [92, 93].)
The satisfactory agreement between predictions and experiments featured in Fig. 6A should not be taken as unequivocal proof that the theoretical models underlying these predictions are valid. For example, an assumption permeating these models is that of equilibrium of the Lac repressor DNA interaction: Lac repressor is assumed to equilibrate by binding and unbinding the DNA much faster than any other temporal scale in the system. Thus, under this assumption, the tools of equilibrium statistical mechanics can be used to mathematically describe simple repression. Recent experiments have harnessed synthetic Lac repressor variants to perform an in vivo pulse-chase experiment.[43] Here, individual molecules of a LacI-Venus fusion were visualized as they bind and unbind DNA. By out-competing this fusion molecule with “dark” Lac repressor molecules, this experiment made it possible to measure the rates of association and dissociation of Lac repressor to various operator sequences. The rates obtained through this experiment do not fully support a simple equilibrium-based view of simple repression. The authors then went on to explore a variety of non-equilibrium models for simple repression, many of which they argue are more convincingly aligned with the experimental data. These results support the view that predictions such as shown in Fig. 6A could be yielding the right answer for the wrong reasons. Indeed, it was recently shown that non-equilibrium models can lead to the exact same functional forms as the equilibrium ones shown in the Figure.[44] More experiments aimed at measuring the in vivo rates involved in the transcriptional process need to be designed in order to directly test the conditions under which equilibrium considerations can be used to describe transcriptional regulation.
Finally, theoretical models of transcriptional regulation can be further expanded to go beyond the mean level of gene expression and predict the noise (cell-to-cell variability) in expression of these synthetic lac operon variants.[45, 46] Fig. 6B shows the predictions made by these stochastic models. These predictions serve as zero-parameter fits for the experimental data obtained by measuring noise as the binding affinity and repressor copy number regulatory knobs are systematically varied.[47] These successes also provided the basis for the further theoretical and experimental dissection of lac operon variants with increasingly complex regulatory architectures.
A further layer of complexity in the lac operon is afforded by DNA looping. Lac repressor can bind to any two of the three sites in the operon in order to form a loop. Thus three different loops can be formed in the wild-type setting. This complexity of loops poses a challenge to the determination of the role of DNA mechanics in transcriptional regulation. In order to uncover the precise contribution of DNA looping to gene expression, the Müller-Hill lab spearheaded a set of experiments where the lac operon was reengineered to contain only two repressor binding sites.[48] These constructs can only form one loop and were built to allow for the easy modulation of loop length by changing the distance between operators. These experiments unequivocally revealed the role of DNA looping in the lac operon as shown in Fig. 6C, where repression as a function of operator distance is shown. These data display a periodic dependence of gene expression with binding site separation that is consistent with the helical periodicity of DNA, hence demonstrating that DNA loops are involved in repression. Theoretically, this regulatory architecture is described by the binding energy of repressor to each of its sites and by the energy required to loop the DNA. However, the previous synthetic dissection of the lac operon based on the simple repression architecture (Fig. 6A,B) already reported on the in vivo binding energy of repressor to its various operators. Thus, the information afforded by this previous round of experimentation can be used as known parameters in the new DNA looping experimental round in order to reduce the number of free parameters. More importantly perhaps, previous knowledge of the in vivo binding energies makes it possible to test a fundamental hypothesis: that the looping energy remains unaltered upon changes in the affinity of the intervening binding sites. This hypothesis was put to both experimental and theoretical tests as shown in Fig. 6D. Here, the level of gene expression was measured for the same loop length, but different combinations of binding site sequences. The lines were generated using the already known in vivo binding energies and assuming that only one looping energy is necessary to describe all experimental outcomes.[40, 9] This graph shows that indeed DNA looping is independent of the particular choice of operators that make the loops. These experiments highlighted the modularity of the looping process in transcriptional regulation and launched this synthetic version of the lac operon as a platform from which to query the in vivo mechanical properties of DNA.[49, 50, 51]
One of the properties of the lac operon that has captured the fascination of researchers for years is its switch-like response when inducer molecules are present: large changes in gene expression are triggered in response to small changes in inducer concentration. This sensitivity in inducer response is captured quantitatively by the black curve in Fig. 6E. The curve shows the level of gene expression of the wild-type lac operon as a function of inducer concentration. The slope of this wild-type curve is to be compared to the yellow curve slope, which measures the in vitro binding of Lac repressor to a single binding site as a function of inducer concentration. These experiments show that in vitro Lac repressor binding is much less sensitive to inducer than in vivo gene expression. It could be argued that this is not a surprising result given the multiple layers of complexity that exist in the in vivo setting that are not present in vitro (Fig. 5). However, several laboratories embarked on a set of experiments that made it possible to turn this qualitative claim into a quantitative one: how much does each layer of complexity contribute to the sensitivity of the lac operon? First, it was recognized that the transport of inducer into the cell is not a passive process. Rather, inducer is actively transported by the LacY permease. This permease contributes to operon sensitivity as demonstrated by the red curve in Fig. 6E, which presents the level of gene expression in a mutant background for the permease. Finally, DNA looping leads to non-linearities in the dependence of gene expression on inducer concentration. These non-linearities also contribute to an increase in sensitivity as shown by the blue curve in Fig. 6E, which was obtained using the simple repression architecture of Fig. 6A. Interestingly, the in vivo sensitivity of this synthetic construct now becomes comparable to the sensitivity of the in vitro system. These results illustrate how, by systematically creating synthetic versions of the lac operon aimed at removing extra layers of complexity, the in vivo behavior of the lac operon becomes quantitatively comparable to its in vitro response.
Synthetic biology beyond the lac operon
The above examples illustrate the power that synthetic approaches offer in dissecting, in this case, the lac operon to study particular features of bacterial transcriptional regulation in E. coli, such as cis regulation, repression by looping, and small molecule induction, “one at a time.” Similar approaches have led to beautiful experiments aimed at uncovering the constraints behind gene network wiring in the bacterium B. subtilis.[52] Under environmental stress, this bacterium can enter a competent state that favors the uptake of extracellular DNA and the incorporation of this DNA into the chromosome. A regulatory protein known as ComK mediates entry into this competent state. Furthermore, expression of ComK actually induces its own degradation by repressing ComS, the protein responsible for protecting ComK from proteolysis. This circuit, shown in Fig. 7A thus forms a negative feedback loop that results in exit from the competent state about 20 hours after its initiation (Fig. 7C). However, this is not the only network architecture that can lead to such transient dynamics. For example, ComK could have activated a protein which, in turn, would increase ComK degradation. Such network wiring is shown in Fig. 7B and would also lead to a negative feedback loop and, presumably, to similar transient competence dynamics. This then begs the question of why one strategy was chosen over another, is it just happenstance or are there important features of this specific network that lead to the resulting physiology? Although the alternative network architecture described above does not exist in wild-type B. subtilis, synthetic biology was used to rewire this competence decision. These experiments revealed that, indeed, this alternative network can also lead to a transient competent state with the same physiological function. However, the synthetic circuit did so far less efficiently. The primary physiological distinction between the two regulatory architectures was a dramatic difference in their resulting cell-to-cell variability: Fig. 7C shows how the wild-type network led to a distribution of competence-state duration that is two-fold broader than the distribution afforded by the synthetic circuit. The authors determined that this noise was necessary for the efficient response to varying environmental conditions. Hence, by rewiring cells to build circuits that did not previously exist, important insights can be garnered into the dynamical constraints on the design of gene regulatory networks.
Figure 7.

Gene network driving competence in B. subtilis. (A) Endogenous gene network driving the expression of ComK through a negative feedback loop, which dictates entrance into the competent state. (B) Synthetic network providing an alternative negative feedback loop as a driver of ComK expression. (C) Distribution of competence state duration for the endogenous and synthetic gene networks. (Adapted from [52].)
The power of these techniques is, by no means, limited to bacteria. Another excellent example of a synthetic dissection of a biological process focuses on signaling between neighboring eukaryotic cells. Notch-Delta signaling mediates the adoption of alternative cellular fates in adjacent cells and is ubiquitously used in embryos to generate checkerboard-like developmental patterns. A few occurrences of this strategy in development include the determination of alternative cellular fates in vulva development in C. elegans, the shaping of a checkerboard pattern of bristle formation in the fruit fly D. melanogaster, and neurogenic patterning in both flies and vertebrates.[53] Like in the lac operon (Fig. 5), Notch-Delta signaling has multiple layers of complexity. Here, the Notch receptor is translocated to the cell membrane, where it is transactivated by Delta ligands on the membrane of a neighboring cell. Upon activation, the Notch intracellular domain is cleaved and translocated into the nucleus, where it carries out its transcriptional regulatory function. In addition, Notch can be inhibited by binding in cis to Delta ligands present in the cell membrane. To uncover how these different layers of complexity mediate Notch-Delta signaling, a similar approach to that taken for the “deconstruction” of the lac operon shown in Fig. 6 was undertaken.[54] Here, the Notch-Delta signaling system was reconstituted in cells that do not normally express it. This strategy made it possible to construct Notch “receiver cells” which can be exposed to systematically controlled concentrations of Delta ligand that are presented either on a microscope cover slip, on the membrane of engineered Delta “sender cells” or on the membrane of the same “receiver cells”. Much like in the case of controlling Lac repressor concentration in the lac operon, the ability to tune the amount of Delta ligand present on different substrates showed that, while the activating response to Delta concentration from sender cells is graded, the inhibiting response to the concentration of Delta ligands on the membrane of the receiver cells is much sharper. This reconstitution showed that the interplay between cis and trans signaling is necessary for the switch-like adoption of mutually exclusive cellular fates.
The experiments mentioned above have relied on deliberate synthetic manipulation of specific molecular targets as a means to systematically tune the system and arrive at a predictive understanding of the mechanisms underlying cellular decision making. An alternative to these systematic manipulations has emerged in the last few years thanks to the enabling power of high-throughput sequencing technologies. These experiments rely on obtaining massive amounts of data in order to draw correlations that make it possible to formulate and test hypothesis regarding biological function. Such approaches have uncovered, for example, insights into the mechanisms of transcriptional initiation, elongation and translation in cells.[55, 56, 57, 58] These experiments have also enabled the mapping of the binding landscape of almost any DNA-binding protein as well as the 3D conformation of chromatin.[59, 60, 61] Despite the amount of data provided by these high-throughput sequencing techniques, the diversity of such data is not always enough to draw statistically significant conclusions. This limitation recently became evident in the study of the N-Terminal codon bias in bacterial genes.[62] It was known that rare codons are usually found in the N-terminus of genes, but the reason for this bias was unclear. Previous approaches had mostly relied on the measurement of translation levels of endogenous genes and the correlation of these levels with their codon usage. However, the diversity of sequences existing in the E. coli genome made it challenging to test different hypothesis aimed at explaining this bias. Thus, the researchers decided to use synthetic biology in order to increase the repertoire of sequences to be analyzed. The authors created a library of more than 10,000 reporter genes where the promoter, ribosomal binding site, and the N-terminal codons of a reporter protein were systematically varied. By measuring the correlations between DNA sequence, transcription, and translation levels, the authors realized that the key factor determining N-terminal codon usage is secondary structure: the N-terminus of mRNA molecules is selected against the formation of secondary structure, which facilitates the initiation of translation. Thus, synthetic biology was used once again to bend nature and augment the reach of high-throughput studies by going beyond sequences found in the wild-type setting and enriching them using precisely designed libraries.
Similar high-throughput synthetic approaches have been used to go beyond translational efficiency and uncover the sequence rules governing transcriptional regulation. Here, promoter libraries containing random or designer regulatory regions are transformed into single cells such that each cells harbors a unique promoter.[63, 64, 65] The expression level of each cell is then measured and correlated with its promoter sequence. By these means, a vast set of data can be generated which enables an exploration of the transcriptional regulatory code that goes far beyond what could be afforded if only endogenous regions were considered.
Bending the fruit fly developmental program
As cells within a developing fly embryo multiply, they “decide” on their ultimate developmental fates. Often, these decisions are predicated by their spatial position along the embryo. The elegant French Flag model proposed that cells determine their spatial position by reading out a spatially-varying concentration of a morphogen.[66] This model is illustrated diagrammatically in Fig. 8 in the context of the early embryo of the fruit fly Drosophila melanogaster. Here, the concentration of a morphogen (green curve) varies along the anterior-posterior (A–P) axis of the embryo. Cells exposed to morphogen concentrations above threshold 1 adopt a blue developmental fate, cells located at concentrations between thresholds 1 and 2 take on the white developmental fate, and cells in regions with concentrations below threshold 2 assume the red fate.
Figure 8.
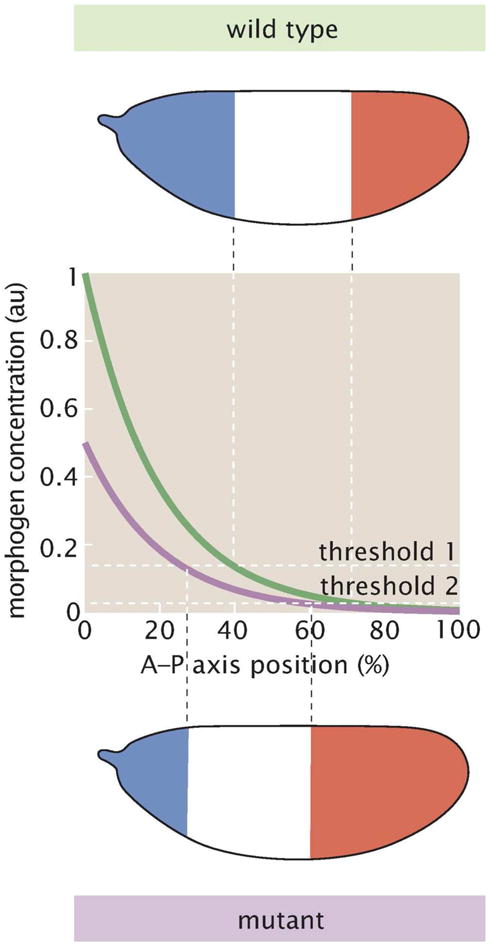
The French Flag Model of developmental patterning. A schematic of the wild-type morphogen profile is shown in green and a mutant version with a reduced gene dosage is shown in violet. The threshold for a developmental boundary between blue and white is shifted to the left in the embryo with the reduced gene dosage of the morphogen.
Qualitatively, the French Flag model has been put to the test repeatedly in embryos using what is perhaps one of the most common forms of synthetic biology in the study of development: misexpression, where patterns of gene expression are synthetically altered in order to test hypotheses about their role in dictating body plans. Misexpression has been repeatedly used to reshape protein gradients and reveal the regulatory logic behind embryonic patterns of gene expression.[67, 68, 69, 70] For example, the Bicoid activator is expressed in an exponential gradient spanning from the anterior to the posterior end of the embryo as shown in Fig. 8. To test the role of Bicoid as a morphogen, the activator was synthetically introduced by injection on the posterior end of the embryo.[71] The result was the formation of head structures where tail structures would normally be found. Thus, through experiments based on rewiring embryonic development, the qualitative role of transcription factors such as Bicoid as morphogens in development was established.
Synthetic biology provides opportunities to go further and quantitatively test this French Flag model. These tests go beyond the qualitative insights afforded by coarse misexpression experiments. For example, the model predicts that a change in Bicoid activator concentration, illustrated by the purple curve in Fig. 8, will lead to a quantifiable change in the position of developmental boundaries. Bicoid’s exponential-like gradient along the anterior-posterior axis of the embryo can be described mathematically by the formula
| (1) |
Here, x denotes the position along the axis of the embryo, Bcd0 corresponds to the Bicoid concentration at x = 0, and λ = 0.165L, where L is the embryo length.[72] One developmental boundary dictated by Bicoid concentration is the cephalic furrow, which demarcates the separation between the head and the thorax of the embryo. In the wild-type fly, the cephalic furrow is positioned at about x0 = 0.34 L of the embryo length.[72] However, by systematically perturbing the bicoid gene dosage (as in Fig. 9), one can tune the spatial gradient of the Bicoid protein by a constant scaling factor D to produce curves like those shown in Fig. 8. Under this perturbation, the French Flag model predicts that the new position of the cephalic furrow, xnew will be given by
| (2) |
This new cephalic furrow position is plotted as a function of bicoid gene dosage as a line in Fig. 10. In order to test this quantitative prediction synthetically several flies bearing different copies of the bicoid gene were generated. These multiple copies were created either using wild-type Bicoid or using a Bicoid-GFP fusion.[73, 72] Each one of these flies forms its cephalic furrow at different positions depending on the gene dosage. This position can be measured using light microscopy or fluorescence microscopy for the particular case of Bicoid-GFP as shown in Fig. 10. The results obtained from these experiments are also shown in Fig. 10. Qualitatively, the data is consistent with the model: a higher Bicoid dosage pushes the cephalic furrow towards the posterior side of the embryo. However, a clear quantitative disagreement between the theoretical prediction and the quantitative data is observed. Indeed, the data show that the embryo compensates for changes to the bicoid dosage. When the embryo is exposed to higher Bicoid concentrations, the cephalic furrow moves, but it does not move as much as expected. These results suggest that multiple genes within the developmental network work simultaneously to determine the position of the cephalic furrow. These genes also respond to changes in bicoid dosage and their combined action leads to a buffering of the näve effect predicted by the French Flag model.[72]
Figure 9.

Experiment to test the spatial information provided by a morphogen gradient in the fruit fly embryo. Flies with different copy numbers of the bicoid gene were synthesized through mating and the resulting cephalic furrow positions were measured.
Figure 10.
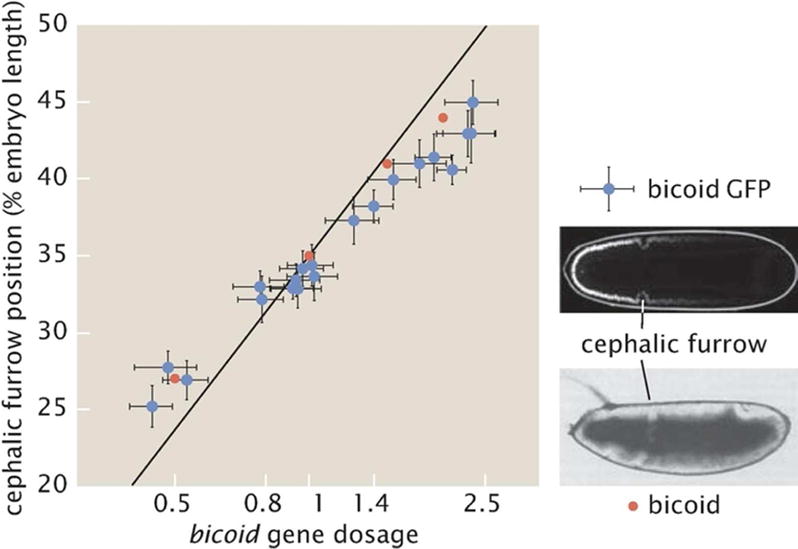
Cephalic furrow position as a function of bicoid gene dosage. The red and blue dots correspond to different experiments, one done using brightfield microscopy and the other on the basis of fluorescence. (Adapted from [73, 72].)
A common reaction to these experiments is that such models are too simple and, of course, they should not be expected to work. However, we find that there is a missed opportunity to learn something by trying to understand where such models fall short. To our mind, this is the analog of disregarding the quantum mechanical particle-in-a-box models because they do not describe hydrogen atoms. The point of view advocated here is that the failure to understand simple systems does not merit throwing our hands up in defeat, but rather, requires a redoubling of our efforts to figure out precisely how these “simple” systems work. Indeed, recent work went beyond just controlling bicoid dosage and into synthetically engineering Bicoid protein patterns that are uniform throughout the embryo.[70] This work revealed that there is a system of repressors that counters activation by Bicoid. It is the combined action of Bicoid activation and repression by these repressors that determines the position of developmental boundaries in the early embryo. These insights now open the door to a new generation of quantitative and predictive models which take account of the presence of several regulatory gradients.
This experiment is perhaps one of the clearest examples of the use of synthetic tools to unnaturally simplify a biological system to uncover the mechanisms behind developmental programs. As such, it also has great pedagogical value. We have successfully carried out this experiment multiple times in laboratory courses that we have run for students ranging from freshman at Caltech to advanced participants in the Physiology Course at the Marine Biological Laboratory. Here, students learn about fly genetics and the techniques required to create synthetic flies, they measure the position of the cephalic furrow using brightfield microscopy, write custom image analysis code to extract cephalic furrow position from their data, and compare their results against the model’s predictions shown in Equation 2.
Finally, the synthetic exploration of pattern formation is by no means limited to the realm of multicellular organisms. Much in the same way that the quantum corral created a synthetic atom, researchers have used synthetic biology to devise a bacterial system that mimics how morphogen gradients can establish positional information in the controlled context of a Petri dish.[74] Here, theoretical modeling was used to engineer bacterial strains that generate spatial patterns of gene expression. In this scheme, three strains are spotted on agar. First, bacteria that emit a signal that diffuses throughout the agar are plated on a disk. Second, two band-detection strains of bacteria are grown on this same dish. These band-detection strains contain synthetic gene regulatory circuits tuned to trigger the expression of fluorescent proteins when exposed to certain concentration ranges of the emitted signal. The result of these efforts was the creation of a synthetic bacterial bullseye pattern. Because of the completely synthetic nature of this system, model parameters regarding the underlying gene regulatory network such as the lifetime of the involved transcription factors can be easily manipulated. Thus, this pattern formation system can be used as a platform to test ideas similar to the French Flag model in the much more controllable setting of bacteria.
Hidden variables
An intriguing outcome of the kind of understanding through synthesis highlighted throughout the paper is that these approaches can help us discover what one might call “hidden variables”. This nomenclature is inspired by the early days of quantum mechanics when the interpretation of the atomic world was still largely in question.[75] Physicists such as Einstein and Schrödinger were unhappy about the fall of determinism and argued that perhaps there were hidden variables that would restore determinacy in much the same way that knowing the initial velocity and rotation rate of a flipped coin would allow us to predict heads or tails.[76] Alas, such was not to be the case in quantum mechanics. On the other hand, the argument to be made in this section is that such hidden variables may have a role to play in thinking about biological problems such as transcription and signaling. Specifically, there are a number of interesting examples where what appears to be distinct or stochastic biological outcomes in fact, can be predicted by knowing some underlying hidden variable which causes the apparent stochasticity to vanish. That is, hidden variables in our system can mask biological phenomena behind noise when not properly controlled, increasing the apparent complexity of these phenomena.
To see the idea of hidden variables in play, we turn to an example from the classic lysis-lysogeny decision in phage lambda. Though this example is not given here to illustrate the idea of bending nature to test models, we offer it as one of the most transparent examples we can imagine of biological hidden variables. In this case, the infection of a bacterial host by phage lambda can lead to one of two eventualities: either the infected cells are the seat of synthesis for a burst of new viral particles (≈ 100) or the phage genome is integrated into the host genome where it now becomes a passenger as the cells replicate generation after generation.[77]One hypothesis has been that the decision of whether to become lytic or lysogenic as shown in Fig. 11A is a random decision, based upon the flipping of some dishonest coin, and that is, that it is a noisy decision.
Figure 11.

Hidden variables behind bacteriophage lysogenic or lytic pathway adoption. In the noisy decision picture, it is imagined that after phage infection, stochastic factors determine whether the infected bacterium will take the lysogenic or lytic developmental pathway. In the hidden variable picture, the size of the infected cells as well as their so-called multiplicity of infection (MOI) determine the cell fate.
The control variable in these experiments is the concentration of viruses the bacteria are exposed to.[78] This concentration dictates, in turn, the average multiplicity of infection ((MOI)): the average number of infecting phages per cell. As shown in Fig. 12A, the probability of a cell adopting the lysogenic fate as a function of the average MOI is described by a broad distribution. The width of this distribution supports the hypothesis that each cell makes a random decision to undergo lysogeny, and that this stochastic decision is biased by the number of phages the cell encounters. However, upon closer examination of the infection process hidden variables emerge. As shown in Fig. 12B, the phages can be labeled with GFP. The ability to visualize these phages makes it possible to measure the single-cell MOI and to relate this magnitude to the lysogen probability. This enabled the testing of the hypothesis that the concentration of viral genomes in a cell dictates the lysogeny decision. In this scenario the probability of lysogeny is only a function of the ratio of the MOI and the cell volume. Fig. 12C shows this single-cell lysogeny probability as a function of viral concentration for different MOIs. As seen in the figure, the data cannot be described by a single function. Instead, each MOI falls on a separate curve, suggesting that the hypothesis of the lysogeny probability being dictated solely by viral concentration is incorrect. This observation led to the formulation of a second hypothesis that goes beyond describing lysogeny as a decision made at the cellular level. Rather, this second model states that the lysogeny decision is made at the subcellular level, with each infecting phage randomly “deciding” whether they are going to adopt the lysogenic pathway. In this model, cells will undergo lysogeny only if all infecting phages adopt the lysogenic pathway. Fig. 12D shows the inferred single-phage lysogeny probability as a function of the viral concentration. The collapse of all the data on the same master curve indicates that, indeed, each phage randomly decides whether it will lead to lysogeny and that only in the case of an unanimous decision will the infected cell actually enter this lysogenic state. Thus, it was discovered that there are hidden variables captured both by the cell size and the number of viruses that have infected a given cell of interest. When these quantities are acknowledged, the lysis-lysogeny decision appears much more predictable in the same way that if we have 106 receptors that bind some ligand, we may not be able to tell which receptor will be occupied by a ligand, but we can say very well what fraction of those receptors will be occupied.
Figure 12.

Revealing the hidden variables behind bacteriophage infection. (A) The probability of a cell undergoing lysogeny as a function of the average multiplicity of infection ((MOI), the average number of infecting phages per cell) is given by a broad distribution. (B) GFP-labeled phages allow for the measurement of the single-cell MOI. Green cells indicate an infection in progress as new phages are produced, while red cells mark the lysogenic cell fate. (C) Probability of a cell becoming a lysogen as a function of viral concentration (defined as the ratio of the single-cell MOI and the normalized cell length). (D) Probability of a phage deciding on lysogeny as a function of viral concentration. (Adapted from [78].)
With the hidden-variable concept in mind, we now turn to the use of synthetic biology as a tool for discovering the existence of such variables. We have already described the way in which a variety of different knobs can be used to elicit different regulatory responses in bacterial transcription as shown in Fig. 4. Specifically, Fig. 4A shows experimental data corresponding to a host of different regulatory scenarios all involving the simple repression motif. Recall that in this regulatory architecture, there is a single regulatory binding site that makes it so that RNAP cannot bind. As a result, as the number of repressors is increased, the gene expression is reduced in a predictable fashion. The different curves in the figure correspond to different ways of setting up this simple repression motif, with different binding site strengths and with different chromosomal or plasmid arrangements that give rise to different gene copy numbers. Ostensibly, this data makes it appear as though each and every curve and associated set of data points is a unique regulatory scenario; the possible responses vary widely with unique character and shape as the number of repressors is changed. However, this view is belied by the results shown in Fig. 13 where we see that if instead of working in the language of repressor copy number (the x-axis variable in Fig. 4A) we instead use the idea of the fugacity, then all of the data follows one master curve.[79] The fugacity framework reveals a hidden variable. When this hidden variable is used, all the data is seen to collapse onto one master curve signifying that it is really the “effective concentration” of repressor (dictated by complicated features such as how many competing binding sites are present on the genome and on plasmids, the strength of their competition and indeed the total number of repressors in the cell) that determines the level of expression and that there is a very particular mathematical way of capturing this effect that is only revealed by suppressing the full complexity of the “real” regulatory network and constructing a simplified scenario that allows us to test our understanding.
Figure 13.
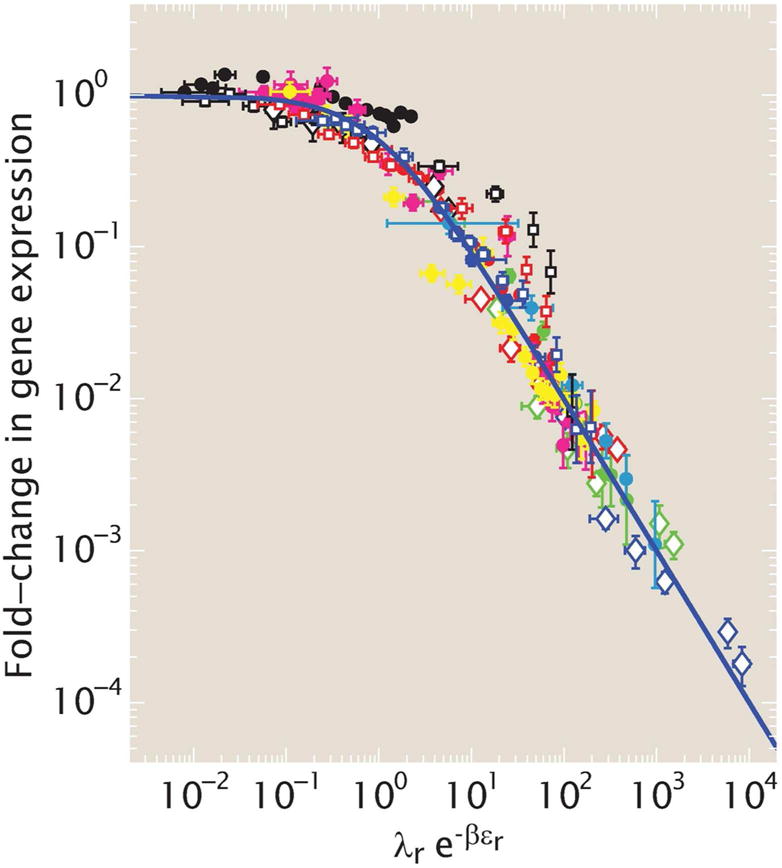
Hidden variables and the simple repression motif. The fugacitybased description (λre−βεr) accounts for both the number of repressors and their tendency to be taken up by other gene copies and by the nonspecific genomic background, resulting in an effective repressor concentration. Here, εr is the binding energy of the repressor to the DNA and λr accounts for the chemical potential associated with a repressor moving from the solution to a DNA-bound state. (Adapted from [79].)
Synthesizing evolution
The idea of rewiring biological systems to generate understanding is not unique to cell and developmental biology. Similar approaches have been instructive at much larger scales as well. One of the most exciting frontiers in the study of evolution in the last half-century has been the emergence of a rigorous field of experimental evolution. Just as with our earlier examples, many of these studies sacrifice the “real biology” in order to set up a precisely controlled and measurable system that admits of a direct confrontation with our theoretical understanding.
In this section, we describe several inspiring examples in flies of what one might call synthetic evolution. These experiments are complemented with assays that harness the power of high-throughput sequencing to track complex evolutionary events in carefully controlled microbial populations. Thus, through these examples, we show just how long such “synthetic” approaches have had a place in evolutionary biology and how important they will be in shaping our understanding of evolution in the future.
Synthesizing genetic drift
A textbook example of genetic drift was provided by the classic experiment of Buri in the 1950s.[80] The idea of this experiment was to use a simple marker (eye color) as a tool to measure changes in allele frequencies in a population that was not subjected to any form of selection. By using a small population size, namely, 8 male and 8 female flies in each vial, Buri was able to watch as the initial population composed strictly of heterozygotes drifted to fixation of one of two alleles. A schematic of the experimental protocol followed by Buri is shown in Fig. 14.
Figure 14.

Synthesis of genetic drift using flies. Schematic of the Buri experimental protocol, where orange-eyed flies with the genotype bw75/bw are crossed. The genotype of their progeny will be homozygous for the red-eye allele (bw75/bw75), homozygous for the white-eye allele (bw/bw), or heterozygote (bw75/bw), resulting in orange eyes. By randomly selecting a set of flies in each generation, genetic drift can be simulated.
To be concrete, Buri had 107 distinct populations, all of which started out as heterozygotes, with each vial containing 8 orange-eyed males and 8 orange-eyed females. For 20 generations, he followed the protocol described above as shown schematically in Fig. 15. In each generation Buri chose the 8 males and 8 females that would seed the next generation randomly. The result is that, over time, he found more and more red- and white-eyed homozygotes. This experiment revealed how allele frequencies change over time without the action of selection. The data that captures these changes in allele frequencies is shown in Fig. 16. Note that in generation zero, there are 107 populations, all of which have allele frequency 0.5 of bw and bw75. However, over time, as more and more flies have become homozygotes, the allele frequency distribution broadens and certain vials end up being taken over by all red or all white homozygotes, permanently losing the other allele.
Figure 15.
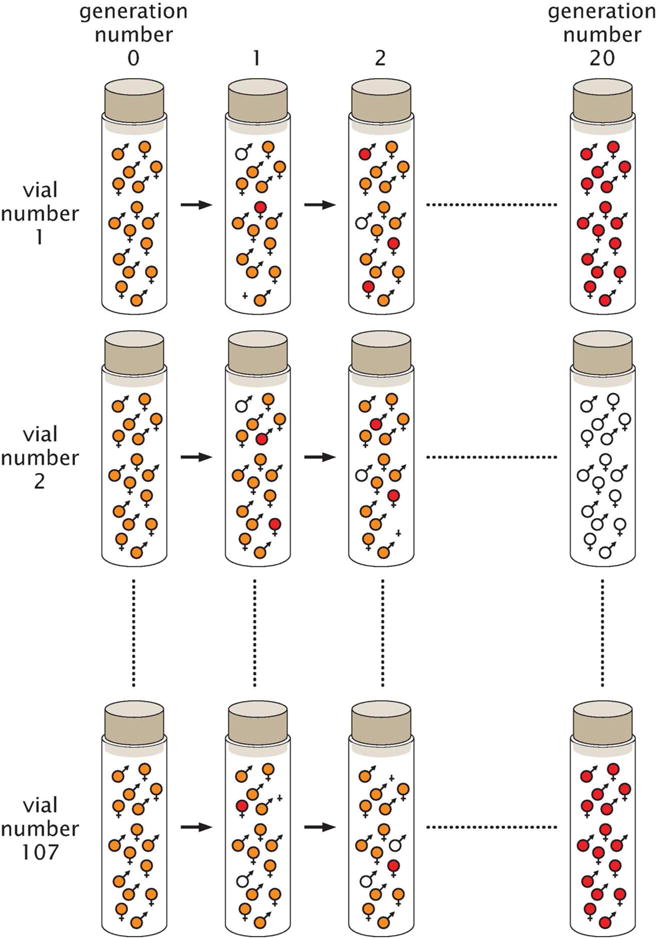
Schematic of the Buri experiment. Initially, all 107 vials contain 8 male heterozygotes and 8 female heterozygotes, implying that all 107 vials have an allele frequency for bw75 of 0.5. Each generation, 8 males and 8 females are selected at random and used as the basis of the next round of mating.
Figure 16.
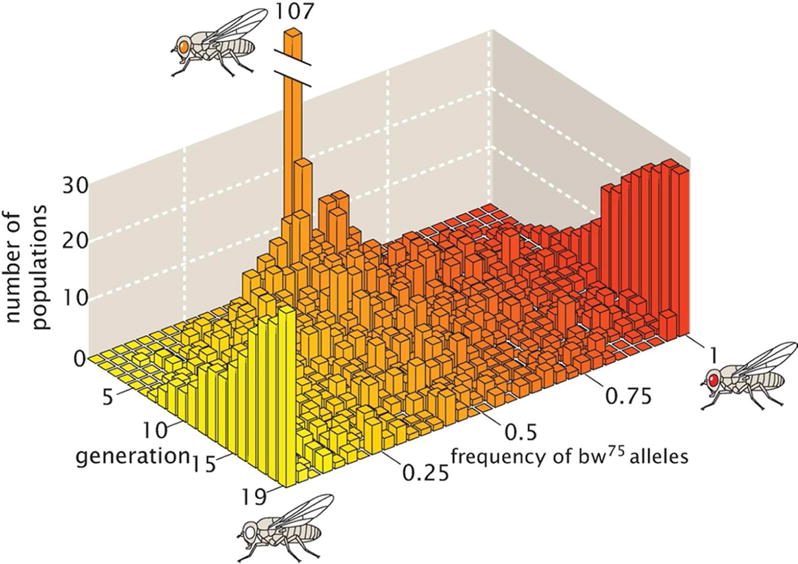
Results from the Buri experiment. In generation 0, all 107 vials have 8 male heterozygotes and 8 female heterozygotes, implying that all 107 vials have an allele frequency for bw75 of 0.5. In subsequent generations, the allele frequencies change as a result of genetic drift and after 19 generations, many of the vials contain flies all with the same eye color, implying fixation of alleles and evolution due to genetic drift. (Adapted from [80].)
Synthesizing natural selection
As pointed out by Darwin himself in the first chapter of his “On the Origin of Species”, synthetic biology has been underway as long as humans have used artificial selection to generate new organisms. We only need turn to the freakish canine creations at any given dog show to see how far such breeding efforts have pushed the mighty wolf. Similar amazing results have been marshaled in the case of domestic pigeons, one of Darwin’s most beloved model systems.
Evolution experiments have been used to probe not only genetic drift, but also the selection process itself. Unlike in the case of dog breeding, for example, evolution experiments set up a population which is then subjected to rigorous and reproducible rules for propagating the population forward in time. In another series of classic studies using flies, Cavener and Clegg explored the reproductive success of flies grown in the presence of ethanol.[81] In this case, there were two alleles of alcohol dehydrogenase present: AdhF and AdhS. The allele AdhF has a higher activity than its AdhS counterpart. As shown in Fig. 17A, over the 57 generations of the experiment, the frequencies of these different alleles were followed in populations grown in the presence and absence of ethanol. As the experiment progressed, the frequencies of these different alleles were monitored. The results of this controlled experiment are a clear demonstration of how selection pressures can lead to the fixation of an advantageous allele. Fig. 17B shows how, in the presence of alcohol, the AdhF quickly became fixed or almost fixed in the population. In contrast, in control experiments lacking ethanol in the growth media, neither allele became fixed. Instead, their frequencies drifted within the population over the generations of the experiment.
Figure 17.

Experimental evolution approach using fruit flies. (A) Four populations were breeded over 57 generations, with two of the populations grown on ethanol, and two of them grown in the absence of ethanol. (B) The allele frequencies of two different alcohol dehydrogenase alleles were monitored as a function of time. (B, adapted from [81].)
As evidenced in the examples above, flies have provided a dramatic and well-controlled setting for synthetic evolution, with easily distinguishable phenotypic markers such as eye color. However, the sequencing revolution has touched nearly all aspects of the synthetic biology research agenda, and few areas have been so deeply altered as have the study of evolution. As a result microbes, thanks in part to their short generation times, have provided some of the most powerful examples of synthetic evolution.[82, 83, 84, 85, 86] In these studies, cultures of carefully designed and controlled microbial populations can be left to evolve over tens of thousands of generations all the while freezing small aliquots of culture which serves as a chronological history of the organisms evolution that can later be sequenced or re-animated. These approaches have shed light on many evolutionary phenomena that would be inaccessible with a slow-growing organism such as the fruit fly. For example, by carrying out a repeated bacterial culture experiment over 30,000 generations, the evolution of the ability to metabolize a completely new carbon source (citrate) was demonstrated.[82] Further, technology to deeply sequence the genomes contained within a microbial population has made it possible to track the temporal dynamics of multiple mutations.[86] These type of experiments have uncovered, for example, how the genetic context a mutation appears in reveals itself in a process called “clonal interference”: beneficial mutations occurring in unfit genetic background cannot fix, whereas neutral or deleterious mutations taking place in fit genetic background can proceed to fixation.
Concluding Thoughts
The ability to manipulate the genomes of living organisms of all kinds is a stunning advance that would have been rightly considered science fiction at the time when the structure of DNA was first elucidated just a little over a half century ago. In the intervening decades, biology has undergone one spectacular revolution after another with methods such as cloning, polymerase chain reaction, DNA sequencing and CRISPR-Cas9 gene editing making it possible to read and write genomes nearly at will.[87, 88, 89, 90]
But what are we to make of all of these achievements? Of course, many have been tempted by the exciting prospects of rewiring living organisms to do our own bidding in contexts ranging from new kinds of energy to bioremediation, and this certainly constitutes one compelling vision for synthetic biology. However, a second view of synthetic biology argued for in this paper is as a powerful new tool for biological discovery, where we really raise our standards about what it means to understand a biological phenomenon. In this view of synthetic biology, it can be used to excise some of the complexities found in the “real” biological context making it possible for us to construct a serious and rigorous dialogue between theory and experiment. Specifically, this article was founded upon a single thesis best exemplified by the quantum corral shown in Figure 3. Recall that in that case, effectively what was done was to synthesize experimental realizations of one of the most famous “toy” problems of quantum mechanics, namely, the so-called particle in a box, the quantum mechanicians version of the spherical cow. But out of this quantum cow and others like it came great opportunities to explore some of the deepest aspects of our understanding of quantum mechanics. We argue that synthetic biology is poised to help explore some of biology’s deepest aspects as well.
One of the most powerful ways to proceed in building a solid foundation of actionable, rigorous scientific infrastructure is to design experimental systems that allow us to test what we think we really understand. Clearly, when our hypotheses fail this litmus test, they are a weak foundation for the more complicated “real” systems that many researchers favor. As a result, we hope that some readers will be inspired to find new ways not to attack “real” biological problems, but rather to make “unreal” biological systems that will realize the ambition of turning cells into this century’s new test tubes.
Supplementary Material
Acknowledgments
The authors are deeply grateful for support provided by La Fondation Pierre Gilles de Gennes (RP), NIH through the Directors Pioneer Award DP1 OD000217 (RP) and R01 GM085286 (RP and RCB), and the Burroughs Wellcome Fund through their Career Award at the Scientific Interface (HG).
References
- 1.Khalil AS, Collins JJ. Synthetic biology: applications come of age. Nat Rev Genet. 2010;11(5):367–79. doi: 10.1038/nrg2775. [DOI] [PMC free article] [PubMed] [Google Scholar]
- 2.Elowitz M, Lim WA. Build life to understand it. Nature. 2010;468(7326):889–90. doi: 10.1038/468889a. [DOI] [PMC free article] [PubMed] [Google Scholar]
- 3.Wöhler F. Ueber knstliche Bildung des Harnstoffs. Annalen der Physik und Chemie. 1828;88(2):253–256. [Google Scholar]
- 4.Venter JC. Life at the speed of light: from the double helix to the dawn of digital life. Viking; New York, New York: 2013. [Google Scholar]
- 5.Garcia HG, Grayson P, Han L, Inamdar M, Kondev J, Nelson PC, Phillips R, Widom J, Wiggins PA. Biological consequences of tightly bent DNA: The other life of a macromolecular celebrity. Biopolymers. 2007;85(2):115–30. doi: 10.1002/bip.20627. [DOI] [PMC free article] [PubMed] [Google Scholar]
- 6.Gregor T, Garcia HG, Little SC. The embryo as a laboratory: quantifying transcription in Drosophila. Trends Genet. 2014;30(8):364–75. doi: 10.1016/j.tig.2014.06.002. [DOI] [PMC free article] [PubMed] [Google Scholar]
- 7.Buchler NE, Gerland U, Hwa T. On schemes of combinatorial transcription logic. Proc Natl Acad Sci U S A. 2003;100(9):5136–41. doi: 10.1073/pnas.0930314100. [DOI] [PMC free article] [PubMed] [Google Scholar]
- 8.Bintu L, Buchler NE, Garcia HG, Gerland U, Hwa T, Kondev J, Phillips R. Transcriptional regulation by the numbers: models. Curr Opin Genet Dev. 2005;15(2):116–24. doi: 10.1016/j.gde.2005.02.007. [DOI] [PMC free article] [PubMed] [Google Scholar]
- 9.Bintu L, Buchler NE, Garcia HG, Gerland U, Hwa T, Kondev J, Kuhlman T, Phillips R. Transcriptional regulation by the numbers: applications. Curr Opin Genet Dev. 2005;15(2):125–35. doi: 10.1016/j.gde.2005.02.006. [DOI] [PMC free article] [PubMed] [Google Scholar]
- 10.Salgado H, Peralta-Gil M, Gama-Castro S, Santos-Zavaleta A, Muniz-Rascado L, Garcia-Sotelo JS, Weiss V, Solano-Lira H, Martinez-Flores I, Medina-Rivera A, Salgado-Osorio G, Alquicira-Hernandez S, Alquicira-Hernandez K, Lopez-Fuentes A, PorronSotelo L, Huerta AM, Bonavides-Martinez C, Balderas-Martinez YI, Pannier L, Olvera M, Labastida A, Jimenez-Jacinto V, Vega-Alvarado L, Del Moral-Chavez V, Hernandez-Alvarez A, Morett E, Collado-Vides J. RegulonDB v8.0: omics data sets, evolutionary conservation, regulatory phrases, cross-validated gold standards and more. Nucleic Acids Res. 2013;41:D203–13. doi: 10.1093/nar/gks1201. (Database issue) [DOI] [PMC free article] [PubMed] [Google Scholar]
- 11.Rydenfelt M, Garcia HG, 3rd, Cox RS, Phillips R. The influence of promoter architectures and regulatory motifs on gene expression in Escherichia coli. PLoS One. 2014;9(12):e114347. doi: 10.1371/journal.pone.0114347. [DOI] [PMC free article] [PubMed] [Google Scholar]
- 12.Prabakaran S, Lippens G, Steen H, Gunawardena J. Posttranslational modification: nature’s escape from genetic imprisonment and the basis for dynamic information encoding. Wiley Interdiscip Rev Syst Biol Med. 2012;4(6):565–83. doi: 10.1002/wsbm.1185. [DOI] [PMC free article] [PubMed] [Google Scholar]
- 13.Townsend JS. A modern approach to quantum mechanics. University Science Books; Sausalito, Calif: 2000. [Google Scholar]
- 14.Bayliss NS. A metallic model for the spectra of conjugated polyenes. J Chem Phys. 1948;16:287. [Google Scholar]
- 15.Kuhn H. A quantum mechanical theory of light absorption of organic dyes and similar compounds. J Chem Phys. 1949;17:1198. [Google Scholar]
- 16.Crommie MF, Lutz CP, Eigler DM. Confinement of electrons to quantum corrals on a metal surface. Science. 1993;262(5131):218–20. doi: 10.1126/science.262.5131.218. [DOI] [PubMed] [Google Scholar]
- 17.Gardner TS, Cantor CR, Collins JJ. Construction of a genetic toggle switch in Escherichia coli. Nature. 2000;403(6767):339–42. doi: 10.1038/35002131. [DOI] [PubMed] [Google Scholar]
- 18.Elowitz MB, Leibler S. A synthetic oscillatory network of transcriptional regulators. Nature. 2000;403(6767):335–8. doi: 10.1038/35002125. [DOI] [PubMed] [Google Scholar]
- 19.Stricker J, Cookson S, Bennett MR, Mather WH, Tsimring LS, Hasty J. A fast, robust and tunable synthetic gene oscillator. Nature. 2008;456(7221):516–9. doi: 10.1038/nature07389. [DOI] [PMC free article] [PubMed] [Google Scholar]
- 20.Levskaya A, Chevalier AA, Tabor JJ, Simpson ZB, Lavery LA, Levy M, Davidson EA, Scouras A, Ellington AD, Marcotte EM, Voigt CA. Synthetic biology: engineering Escherichia coli to see light. Nature. 2005;438(7067):441–2. doi: 10.1038/nature04405. [DOI] [PubMed] [Google Scholar]
- 21.Guet CC, Elowitz MB, Hsing W, Leibler S. Combinatorial synthesis of genetic networks. Science. 2002;296(5572):1466–70. doi: 10.1126/science.1067407. [DOI] [PubMed] [Google Scholar]
- 22.Cox RS, III, Surette MG, Elowitz MB. Programming gene expression with combinatorial promoters. Mol Syst Biol. 2007;3:145. doi: 10.1038/msb4100187. [DOI] [PMC free article] [PubMed] [Google Scholar]
- 23.Bonnet J, Yin P, Ortiz ME, Subsoontorn P, Endy D. Amplifying genetic logic gates. Science. 2013;340(6132):599–603. doi: 10.1126/science.1232758. [DOI] [PubMed] [Google Scholar]
- 24.Moon TS, Lou C, Tamsir A, Stanton BC, Voigt CA. Genetic programs constructed from layered logic gates in single cells. Nature. 2012;491(7423):249–53. doi: 10.1038/nature11516. [DOI] [PMC free article] [PubMed] [Google Scholar]
- 25.Endy D. Foundations for engineering biology. Nature. 2005;438(7067):449–53. doi: 10.1038/nature04342. [DOI] [PubMed] [Google Scholar]
- 26.Chatterjee S, Struhl K. Connecting a promoter-bound protein to TBP bypasses the need for a transcriptional activation domain. Nature. 1995;374(6525):820–2. doi: 10.1038/374820a0. [DOI] [PubMed] [Google Scholar]
- 27.Ptashne M, Gann A. Transcriptional activation by recruitment. Nature. 1997;386(6625):569–77. doi: 10.1038/386569a0. [DOI] [PubMed] [Google Scholar]
- 28.Dove SL, Hochschild A. Conversion of the omega subunit of Escherichia coli RNA polymerase into a transcriptional activator or an activation target. Genes Dev. 1998;12(5):745–54. doi: 10.1101/gad.12.5.745. [DOI] [PMC free article] [PubMed] [Google Scholar]
- 29.Ptashne M, Gann A. Genes and Signals. Cold Spring Harbor Laboratory Press; New York: 2002. [Google Scholar]
- 30.Barberis A, Pearlberg J, Simkovich N, Farrell S, Reinagel P, Bamdad C, Sigal G, Ptashne M. Contact with a component of the polymerase II holoenzyme suffices for gene activation. Cell. 1995;81(3):359–68. doi: 10.1016/0092-8674(95)90389-5. [DOI] [PubMed] [Google Scholar]
- 31.Gaudreau L, Keaveney M, Nevado J, Zaman Z, Bryant GO, Struhl K, Ptashne M. Transcriptional activation by artificial recruitment in yeast is influenced by promoter architecture and downstream sequences. Proc Natl Acad Sci U S A. 1999;96(6):2668–73. doi: 10.1073/pnas.96.6.2668. [DOI] [PMC free article] [PubMed] [Google Scholar]
- 32.Gossen M, Bujard H. Tight control of gene expression in mammalian cells by tetracycline-responsive promoters. Proc Natl Acad Sci U S A. 1992;89(12):5547–51. doi: 10.1073/pnas.89.12.5547. [DOI] [PMC free article] [PubMed] [Google Scholar]
- 33.Duffy JB. GAL4 system in Drosophila: a fly geneticist’s Swiss army knife. Genesis. 2002;34(1–2):1–15. doi: 10.1002/gene.10150. [DOI] [PubMed] [Google Scholar]
- 34.Li JJ, Herskowitz I. Isolation of ORC6, a component of the yeast origin recognition complex by a one-hybrid system. Science. 1993 Dec;262(5141):1870–1874. doi: 10.1126/science.8266075. [DOI] [PubMed] [Google Scholar]
- 35.Wang MM, Reed RR. Molecular cloning of the olfactory neuronal transcription factor Olf-1 by genetic selection in yeast. Nature. 1993 Jul;364(6433):121–126. doi: 10.1038/364121a0. [DOI] [PubMed] [Google Scholar]
- 36.Fields S, Song O. A novel genetic system to detect protein-protein interactions. Nature. 1989 Jul;340(6230):245–246. doi: 10.1038/340245a0. [DOI] [PubMed] [Google Scholar]
- 37.Jacob F, Monod J. Genetic regulatory mechanisms in the synthesis of proteins. J Mol Biol. 1961;3:318–56. doi: 10.1016/s0022-2836(61)80072-7. [DOI] [PubMed] [Google Scholar]
- 38.Müller-Hill B. The lac Operon: a short history of a genetic paradigm. Walter de Gruyter; Berlin, New York: 1996. [Google Scholar]
- 39.Oehler S, Amouyal M, Kolkhof P, von Wilcken-Bergmann B, Müller-Hill B. Quality and position of the three lac operators of E. coli define efficiency of repression. EMBO J. 1994;13(14):3348–55. doi: 10.1002/j.1460-2075.1994.tb06637.x. [DOI] [PMC free article] [PubMed] [Google Scholar]
- 40.Vilar JM, Leibler S. DNA looping and physical constraints on transcription regulation. J Mol Biol. 2003;331(5):981–9. doi: 10.1016/s0022-2836(03)00764-2. [DOI] [PubMed] [Google Scholar]
- 41.Garcia HG, Phillips R. Quantitative dissection of the simple repression input-output function. Proc Natl Acad Sci U S A. 2011;108(29):12173–8. doi: 10.1073/pnas.1015616108. [DOI] [PMC free article] [PubMed] [Google Scholar]
- 42.Brewster RC, Weinert FM, Garcia HG, Song D, Rydenfelt M, Phillips R. The transcription factor titration effect dictates level of gene expression. Cell. 2014;156(6):1312–23. doi: 10.1016/j.cell.2014.02.022. [DOI] [PMC free article] [PubMed] [Google Scholar]
- 43.Hammar P, Wallden M, Fange D, Persson F, Baltekin O, Ullman G, Leroy P, Elf J. Direct measurement of transcription factor dissociation excludes a simple operator occupancy model for gene regulation. Nat Genet. 2014;46(4):405–8. doi: 10.1038/ng.2905. [DOI] [PMC free article] [PubMed] [Google Scholar]
- 44.Phillips R. Napoleon Is in Equilibrium. Annual Review of Condensed Matter Physics. 2015;6(6):85–111. doi: 10.1146/annurev-conmatphys-031214-014558. [DOI] [PMC free article] [PubMed] [Google Scholar]
- 45.Peccoud J, Ycart B. Markovian modelig of gene product synthesis. Theor Popul Biol. 1995;48:222–234. [Google Scholar]
- 46.Sanchez A, Garcia HG, Jones D, Phillips R, Kondev J. Effect of Promoter Architecture on the Cell-to-Cell Variability in Gene Expression. PLoS Comput Biol. 2011;7(3):e1001100. doi: 10.1371/journal.pcbi.1001100. [DOI] [PMC free article] [PubMed] [Google Scholar]
- 47.Jones DL, Brewster RC, Phillips R. Promoter architecture dictates cell-to-cell variability in gene expression. Science. 2014;346(6216):1533–6. doi: 10.1126/science.1255301. [DOI] [PMC free article] [PubMed] [Google Scholar]
- 48.Muller J, Oehler S, Muller-Hill B. Repression of lac promoter as a function of distance, phase and quality of an auxiliary lac operator. J Mol Biol. 1996;257(1):21–9. doi: 10.1006/jmbi.1996.0143. [DOI] [PubMed] [Google Scholar]
- 49.Becker NA, Kahn JD, Maher LJ., III Bacterial repression loops require enhanced DNA flexibility. J Mol Biol. 2005;349(4):716–30. doi: 10.1016/j.jmb.2005.04.035. [DOI] [PubMed] [Google Scholar]
- 50.Peters JP, Becker NA, Rueter EM, Bajzer Z, Kahn JD, 3rd, Maher LJ. Quantitative methods for measuring DNA flexibility in vitro and in vivo. Methods Enzymol. 2011;488:287–335. doi: 10.1016/B978-0-12-381268-1.00012-4. [DOI] [PMC free article] [PubMed] [Google Scholar]
- 51.Boedicker JQ, Garcia HG, Phillips R. Theoretical and Experimental Dissection of DNA Loop-Mediated Repression. Physical Review Letters. 2013;110(1) doi: 10.1103/PhysRevLett.110.018101. [DOI] [PMC free article] [PubMed] [Google Scholar]
- 52.Cagatay T, Turcotte M, Elowitz MB, Garcia-Ojalvo J, Suel GM. Architecture-dependent noise discriminates functionally analogous differentiation circuits. Cell. 2009;139(3):512–22. doi: 10.1016/j.cell.2009.07.046. [DOI] [PubMed] [Google Scholar]
- 53.Shaya O, Sprinzak D. From Notch signaling to fine-grained patterning: Modeling meets experiments. Curr Opin Genet Dev. 2011 doi: 10.1016/j.gde.2011.07.007. [DOI] [PubMed] [Google Scholar]
- 54.Sprinzak D, Lakhanpal A, Lebon L, Santat LA, Fontes ME, Anderson GA, Garcia-Ojalvo J, Elowitz MB. Cis-interactions between Notch and Delta generate mutually exclusive signalling states. Nature. 2010;465(7294):86–90. doi: 10.1038/nature08959. [DOI] [PMC free article] [PubMed] [Google Scholar]
- 55.Ingolia NT, Ghaemmaghami S, Newman JRS, Weissman JS. Genome-Wide Analysis in Vivo of Translation with Nucleotide Resolution Using Ribosome Profiling. Science. 2009;324(5924):218–223. doi: 10.1126/science.1168978. [DOI] [PMC free article] [PubMed] [Google Scholar]
- 56.Churchman LS, Weissman JS. Nascent transcript sequencing visualizes transcription at nucleotide resolution. Nature. 2011;469(7330):368–73. doi: 10.1038/nature09652. [DOI] [PMC free article] [PubMed] [Google Scholar]
- 57.Li GW, Burkhardt D, Gross C, Weissman JS. Quantifying absolute protein synthesis rates reveals principles underlying allocation of cellular resources. Cell. 2014;157(3):624–35. doi: 10.1016/j.cell.2014.02.033. [DOI] [PMC free article] [PubMed] [Google Scholar]
- 58.Kwak H, Fuda NJ, Core LJ, Lis JT. Precise maps of RNA polymerase reveal how promoters direct initiation and pausing. Science. 2013;339(6122):950–3. doi: 10.1126/science.1229386. [DOI] [PMC free article] [PubMed] [Google Scholar]
- 59.Dekker J, Rippe K, Dekker M, Kleckner N. Capturing chromosome conformation. Science. 2002;295(5558):1306–11. doi: 10.1126/science.1067799. [DOI] [PubMed] [Google Scholar]
- 60.Wold B, Myers RM. Sequence census methods for functional genomics. Nat Methods. 2008;5(1):19–21. doi: 10.1038/nmeth1157. [DOI] [PubMed] [Google Scholar]
- 61.Lieberman-Aiden E, van Berkum NL, Williams L, Imakaev M, Ragoczy T, Telling A, Amit I, Lajoie BR, Sabo PJ, Dorschner MO, Sandstrom R, Bernstein B, Bender MA, Groudine M, Gnirke A, Stamatoyannopoulos J, Mirny LA, Lander ES, Dekker J. Comprehensive mapping of long-range interactions reveals folding principles of the human genome. Science. 2009;326(5950):289–93. doi: 10.1126/science.1181369. [DOI] [PMC free article] [PubMed] [Google Scholar]
- 62.Goodman DB, Church GM, Kosuri S. Causes and effects of N-terminal codon bias in bacterial genes. Science. 2013;342(6157):475–9. doi: 10.1126/science.1241934. [DOI] [PubMed] [Google Scholar]
- 63.Gertz J, Siggia ED, Cohen BA. Analysis of combinatorial cisregulation in synthetic and genomic promoters. Nature. 2009;457(7226):215–8. doi: 10.1038/nature07521. [DOI] [PMC free article] [PubMed] [Google Scholar]
- 64.Sharon E, Kalma Y, Sharp A, Raveh-Sadka T, Levo M, Zeevi D, Keren L, Yakhini Z, Weinberger A, Segal E. Inferring gene regulatory logic from high-throughput measurements of thousands of systematically designed promoters. Nat Biotechnol. 2012;30(6):521–30. doi: 10.1038/nbt.2205. [DOI] [PMC free article] [PubMed] [Google Scholar]
- 65.White MA, Myers CA, Corbo JC, Cohen BA. Massively parallel in vivo enhancer assay reveals that highly local features determine the cis-regulatory function of ChIP-seq peaks. Proc Natl Acad Sci U S A. 2013;110(29):11952–7. doi: 10.1073/pnas.1307449110. [DOI] [PMC free article] [PubMed] [Google Scholar]
- 66.Wolpert L. Positional information and the spatial pattern of cellular differentiation. J Theor Biol. 1969;25(1):1–47. doi: 10.1016/s0022-5193(69)80016-0. [DOI] [PubMed] [Google Scholar]
- 67.Kraut R, Levine M. Mutually repressive interactions between the gap genes giant and Kruppel define middle body regions of the Drosophila embryo. Development. 1991;111(2):611–21. doi: 10.1242/dev.111.2.611. [DOI] [PubMed] [Google Scholar]
- 68.Margolis JS, Borowsky ML, Steingrimsson E, Shim CW, Lengyel JA, Posakony JW. Posterior stripe expression of hunchback is driven from two promoters by a common enhancer element. Development. 1995;121(9):3067–77. doi: 10.1242/dev.121.9.3067. [DOI] [PubMed] [Google Scholar]
- 69.Clyde DE, Corado MS, Wu X, Pare A, Papatsenko D, Small S. A self-organizing system of repressor gradients establishes segmental complexity in Drosophila. Nature. 2003;426(6968):849–53. doi: 10.1038/nature02189. [DOI] [PubMed] [Google Scholar]
- 70.Chen H, Xu Z, Mei C, Yu D, Small S. A system of repressor gradients spatially organizes the boundaries of bicoid-dependent target genes. Cell. 2012;149(3):618–29. doi: 10.1016/j.cell.2012.03.018. [DOI] [PMC free article] [PubMed] [Google Scholar]
- 71.Nusslein-Volhard C, Frohnhofer HG, Lehmann R. Determination of anteroposterior polarity in Drosophila. Science. 1987;238(4834):1675–81. doi: 10.1126/science.3686007. [DOI] [PubMed] [Google Scholar]
- 72.Liu F, Morrison AH, Gregor T. Dynamic interpretation of maternal inputs by the Drosophila segmentation gene network. Proc Natl Acad Sci U S A. 2013;110(17):6724–9. doi: 10.1073/pnas.1220912110. [DOI] [PMC free article] [PubMed] [Google Scholar]
- 73.Driever W, Nusslein-Volhard C. The bicoid protein determines position in the Drosophila embryo in a concentration-dependent manner. Cell. 1988;54(1):95–104. doi: 10.1016/0092-8674(88)90183-3. [DOI] [PubMed] [Google Scholar]
- 74.Basu S, Gerchman Y, Collins CH, Arnold FH, Weiss R. A synthetic multicellular system for programmed pattern formation. Nature. 2005;434(7037):1130–4. doi: 10.1038/nature03461. [DOI] [PubMed] [Google Scholar]
- 75.Mermin ND. Is the Moon There When Nobody Looks - Reality and the Quantum-Theory. Physics Today. 1985;38(4):38–47. [Google Scholar]
- 76.Keller JB. The Probability of Heads. American Mathematical Monthly. 1986;93(3):191–197. [Google Scholar]
- 77.Ptashne M. A genetic switch: phage lambda revisited. 3rd. Cold Spring Harbor Laboratory Press; Cold Spring Harbor, N.Y.: 2004. [Google Scholar]
- 78.Zeng L, Skinner SO, Zong C, Sippy J, Feiss M, Golding I. Decision making at a subcellular level determines the outcome of bacteriophage infection. Cell. 2010;141(4):682–91. doi: 10.1016/j.cell.2010.03.034. [DOI] [PMC free article] [PubMed] [Google Scholar]
- 79.Weinert FM, Brewster RC, Rydenfelt M, Phillips R, Kegel WK. Scaling of gene expression with transcription-factor fugacity. Phys Rev Lett. 2014;113(25):258101. doi: 10.1103/PhysRevLett.113.258101. [DOI] [PMC free article] [PubMed] [Google Scholar]
- 80.Buri P. Gene-Frequency in Small Populations of Mutant Drosophila. Evolution. 1956;10(4):367–402. [Google Scholar]
- 81.Cavener DR, Clegg MT. Multigenic Response to Ethanol in Drosophila-Melanogaster. Evolution. 1981;35(1):1–10. doi: 10.1111/j.1558-5646.1981.tb04853.x. [DOI] [PubMed] [Google Scholar]
- 82.Blount ZD, Borland CZ, Lenski RE. Historical contingency and the evolution of a key innovation in an experimental population of Escherichia coli. Proc Natl Acad Sci U S A. 2008;105(23):7899–906. doi: 10.1073/pnas.0803151105. [DOI] [PMC free article] [PubMed] [Google Scholar]
- 83.Beaumont HJ, Gallie J, Kost C, Ferguson GC, Rainey PB. Experimental evolution of bet hedging. Nature. 2009;462(7269):90–3. doi: 10.1038/nature08504. [DOI] [PubMed] [Google Scholar]
- 84.Blount ZD, Barrick JE, Davidson CJ, Lenski RE. Genomic analysis of a key innovation in an experimental Escherichia coli population. Nature. 2012;489(7417):513–8. doi: 10.1038/nature11514. [DOI] [PMC free article] [PubMed] [Google Scholar]
- 85.Barrick JE, Lenski RE. Genome dynamics during experimental evolution. Nat Rev Genet. 2013;14(12):827–39. doi: 10.1038/nrg3564. [DOI] [PMC free article] [PubMed] [Google Scholar]
- 86.Lang GI, Rice DP, Hickman MJ, Sodergren E, Weinstock GM, Botstein D, Desai MM. Pervasive genetic hitchhiking and clonal interference in forty evolving yeast populations. Nature. 2013;500(7464):571–4. doi: 10.1038/nature12344. [DOI] [PMC free article] [PubMed] [Google Scholar]
- 87.Echols H, Gross C. Operators and promoters: the story of molecular biology and its creators. University of California Press; Berkeley: 2001. [Google Scholar]
- 88.Mullis K, Faloona F, Scharf S, Saiki R, Horn G, Erlich H. Specific enzymatic amplification of DNA in vitro: the polymerase chain reaction. Cold Spring Harb Symp Quant Biol. 1986;51(Pt 1):263–73. doi: 10.1101/sqb.1986.051.01.032. [DOI] [PubMed] [Google Scholar]
- 89.Sanger F. Sequences, sequences, and sequences. Annu Rev Biochem. 1988;57:1–28. doi: 10.1146/annurev.bi.57.070188.000245. [DOI] [PubMed] [Google Scholar]
- 90.Wright AV, Nunez JK, Doudna JA. Biology and Applications of CRISPR Systems: Harnessing Nature’s Toolbox for Genome Engineering. Cell. 2016;164(1–2):29–44. doi: 10.1016/j.cell.2015.12.035. [DOI] [PubMed] [Google Scholar]
- 91.Lim W, Mayer B, Pawson T. Cell signaling: principles and mechanisms. Garland Science, Taylor & Francis Group; New York: 2015. [Google Scholar]
- 92.Oehler S, Alberti S, Muller-Hill B. Induction of the lac promoter in the absence of DNA loops and the stoichiometry of induction. Nucleic Acids Res. 2006;34(2):606–12. doi: 10.1093/nar/gkj453. [DOI] [PMC free article] [PubMed] [Google Scholar]
- 93.Kuhlman T, Zhang Z, Saier MH, Jr, Hwa T. Combinatorial transcriptional control of the lactose operon of Escherichia coli. Proc Natl Acad Sci U S A. 2007;104(14):6043–8. doi: 10.1073/pnas.0606717104. [DOI] [PMC free article] [PubMed] [Google Scholar]
Associated Data
This section collects any data citations, data availability statements, or supplementary materials included in this article.