Abstract
Evaluation of clonal plasma cells (PCs) in the bone marrow (BM) of multiple myeloma (MM) patients reveals two distinct clonal PC populations based on the presence or absence of CD45 expression. We explored the prognostic significance of CD45 expression by clonal PCs in the BM of MM patients in the era of novel agent therapy. All 156 MM patients seen at the Mayo Clinic, Rochester from 2009 to 2011 who had their BM evaluated by multiparametric flow cytometry were included. Patients whose BM had ≥ 20% of the clonal PCs expressing CD45 were classified as CD45 positive (+) and the rest as CD45 negative (−). Of these patients, the median overall survival (OS) for patients in the CD45 (+) group (n = 43, 28%) was 38 months versus not reached for the CD45 (−) group (n = 113, 72%) (P = 0.009). In a multivariable analysis, CD45 (+) status was an independent predictor of inferior OS among newly diagnosed patients with MM. CD45 expression may be a surrogate for a more aggressive phenotype of MM and warrants further investigation.
Keywords: CD45, multiple myeloma, survival
INTRODUCTION
Multiple myeloma (MM) is characterized by the clonal proliferation of plasma cells (PCs) in the bone marrow (BM) leading to end organ damage such as anemia, bone destruction, hypercalcemia or renal insufficiency.(1) Multiparameter flow cytometry has been utilized routinely in clinical practice to characterize the PCs in the BM as normal or malignant/clonal based on their immunophenotypic signatures.(2) CD45 is a receptor-like protein tyrosine phosphatase expressed on the surface of all nucleated hematopoietic cells and is a critical regulator of antigen mediated signaling and activation in B- and T lymphocytes.(3, 4) However, its role in the biology of MM remains controversial. During normal PC development and differentiation, there is a progressive in vivo decline in CD45 expression; i.e. CD45 is brightly expressed in normal immature PCs but weakly expressed in mature PCs of the BM.(5) Consequently, evaluation of clonal PCs in the BM of MM patients reveals two distinct PC populations: CD45 negative (−) and CD45 positive (+) PCs.(6, 7)
A number of in vitro studies using normal and clonal PCs indicate that bright CD45 expression is seen on the most actively proliferating PCs.(8) Yet, prior clinical studies have made the counterintuitive observation that an increased proportion of CD45 (+) clonal PCs in MM is associated with a better prognosis.(9–11) Many of these prior studies utilized three or four color flow cytometry technologies and were conducted in an era devoid of novel agent induction therapy. The advent of six-color multiparameter flow cytometry in clinical practice has allowed for greater sensitivity in detecting the CD45 expressing clonal PC component. Thus, in the modern era of novel agent induction therapies, we explored the prognostic significance of CD45 expression by clonal PCs in newly diagnosed MM patients using six-color multiparameter flow cytometry.
METHODS
We retrospectively evaluated all newly diagnosed MM patients seen at the Mayo Clinic, Rochester between October 2009 and November 2011 who had their BM samples evaluated by multiparameter flow cytometry. Approval for this study was obtained from the Mayo Clinic IRB in accordance with the federal regulations and the principles of the Declaration of Helsinki.
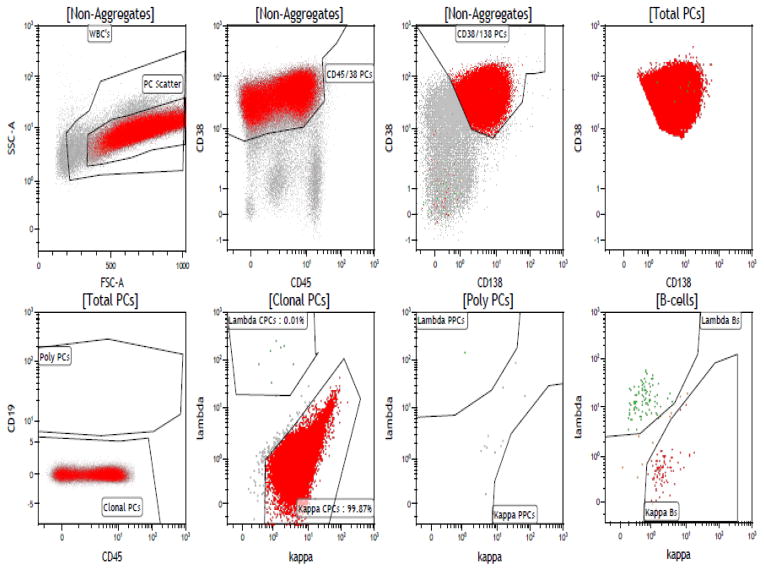
Immunophenotyping was performed on fresh bone marrow using six-color multiparametric flow cytometry. The fresh whole bone marrow obtained from each patient underwent lysis with ammonium chloride and then was suspended in phosphate buffered saline (PBS) with 3.0% bovine serum albumin (BSA). Cell surface antigens were assessed by direct immunofluorescence using fluorescein isothiocyanate (FITC), phycoerythrin (PE), phycoerythrin-cyanide-5 (PE-Cy7), and allophycocyanin (APC) conjugated to monoclonal antibodies (Becton Dickinson, San Diego, CA, USA and BD Pharmingen). The BM mononuclear cells were isolated by Ficoll gradient and stained with six antibodies in a single tube: kappa FITC and lambda PE (both polyclonal antibodies were obtained from Dako, Carpinteria, Ca), CD138 Percp Cy-5.5, CD19 PE Cy-7, CD38 APC, CD45 APC-H7 (All monoclonal antibodies were obtained from BD Biosciences, San Jose, CA). The flow cytometry data was collected using the Becton Dickinson FACSCanto II instruments that analyzed 150,000 events (cells); this data was then analyzed by multi-parameter analysis using the BD FACS DIVA Software. PCs were selectively analyzed through combinatorial gating using light scatter properties and CD38, CD138, CD19, and CD45. Normal PC’s were then separated from clonal PCs based on the differential expression of CD45, CD19 and polytypic immunoglobulin light chains. The clonal PCs detected were reported out as the number of clonal events/150,000 collected total events. Figure 1 depicts a typical flow cytometry gating pattern in a patient with a kappa-restricted clonal PC population that strongly expresses CD45. The PCs were first identified based on their expression of CD138 and CD38 and then further separated from polyclonal PCs based on their lack of CD19 expression. As seen in the figure, a large portion of this selected population expresses CD45 and is kappa light chain restricted. A proportion of the patients also had their peripheral blood evaluated by six-color multiparametric flow cytometry for clonal circulating plasma cells (cPCs) as described in prior studies.(12, 13)
Figure 1.
A typical flow cytometry pattern in a patient with a kappa-restricted clonal PC population that strongly expresses CD45.
The primary end-points of the study were OS and time to next therapy (TTNT). OS was measured from the day of diagnosis to death from any cause, with censoring performed at the date of last contact. TTNT was determined from the day of diagnosis to the day of initiating the next therapy due to a documented relapse or progression of disease, with those alive and relapse free censored at the day of last follow up. Patients who had fluorescent in situ hybridization (FISH) analysis performed on their bone marrow aspirate at diagnosis were categorized as having high risk disease if they had any of the following abnormalities: t(4;14), t(14;16), t(14;20) and del17p. Host and disease variables at diagnosis that were examined for prognostic significance included: age, bone marrow plasma cell percentage, presence of high-risk FISH, ISS stage at diagnosis, plasma cell labeling index (PCLI), serum M spike, urine M spike, hemoglobin, creatinine and LDH. FISH studies and PCLI were performed as previously described.(14, 15) PCLI levels of greater than 3% were considered high as they have been conventionally associated with an aggressive disease course.(16) LDH levels greater than 222 U/L were considered abnormally elevated by our clinical laboratory assay used in this study. Receiver operating characteristics (ROC) analysis was performed to determine the optimal cut off for percent of CD45 expressing clonal PCs that predicted for worse two-year OS outcomes.
Statistical analysis was performed using the SAS biostatistical software JMP 10.0.1 (SAS Institute Inc., Cary, NC). Chi-square tests and Fisher exact tests were used to compare differences between the sub-groups of interest. A Kaplan-Meier analysis was used to analyze and create the OS and TTNT curves, and log rank test was used to compare these curves. Finally, a multivariable analysis was performed using the Cox proportions hazards model to assess the influence of various prognostic factors on OS and TTNT.
RESULTS
There were 156 consecutive newly diagnosed MM patients who had their BM samples evaluated by multiparameter flow cytometry as part of their routine clinical evaluation. Using a ROC analysis, the optimum cutoff for percent of clonal PCs expressing CD45 within the BM that predicted for worse 2-year OS outcomes was 20%: AUC of 0.63 with a sensitivity of 53% and specificity of 80%, Thus, for the rest of the analyses, BM samples where ≥ 20% of the clonal PCs detected expressed CD45 were classified as CD45 positive (+) and the rest were CD45 negative (−).
Among this entire cohort of newly diagnosed patients with MM, the median follow up was 50 months (95% CI: 47–53). The patient and disease characteristics of these newly diagnosed MM patients are listed in Table 1. The median age in this group was 67 years and 60% were male. Most patients (98%) received induction therapy containing novel agents but only 32% received an upfront ASCT as part of their initial therapy. At the time of this analysis, 62% were still alive and 61% had disease progression after their initial induction therapy requiring salvage therapy. There were 43 patients (28%) who had high-risk disease by FISH and 19 (13%) had a PCLI > 3%. There were 44 (30%) patients whose beta-2-microglobulin was greater than 5.5 mcg/mL and 67 (43%) patients whose albumin was less than 3.5 g/dL.
Table 1.
Demographic and clinical characteristics of the MM patients
| Variables | Newly diagnosed MM
|
||
|---|---|---|---|
| All patients (N = 156) | CD45+ cohort (N= 43) | CD45− cohort (N=113) | |
|
| |||
| Age * | 67 (39 – 95) | 66 (48 – 95) | 68 (39–90) |
|
| |||
| Male (No, %) | 94 (60%) | 29 (67%) | 65 (58%) |
|
| |||
| PCLI %* | 0.8 (0 – 8.6) | 1 (0 – 8.6) | 0.8 (0 – 6) |
|
| |||
| Bone marrow PC%* | 45 (5 – 100) | 50 (5 – 95) | 45 (5 – 100) |
|
| |||
| LDH * | 159 (3 – 878) | 160 (75 – 878) | 159 (3 – 656) |
|
| |||
| Beta-2-microglobulin * | 5.0 (1.7 – 27.2) | 5.0 (2.4 – 27.2) | 3.8 (1.4 – 19.3) |
|
| |||
| Creatinine * | 1 (0.4 – 7.6) | 1.1 (0.6 – 4.9) | 1.0 (0.4 – 7.6) |
|
| |||
| Albumin * | 3.5 (2.3 – 4.5) | 3.5 (2.4 – 4.5) | 3.5 (2.3 – 4.3) |
|
| |||
| High risk FISH (152 pts only) (No, %) | 43 (28%) | 7 (17%) | 36 (32%) |
| Deletion 17p/Monosomy 17 | 28 | 4 | 24 |
| t(4;14) | 14 | 2 | 12 |
| t(14;16) | 7 | 1 | 6 |
| t(14;20) | 1 | 0 | 1 |
|
| |||
| ISS stage at diagnosis (Available on 147 pts only) (No, %) | |||
| • Stage 1 | 43 (29%) | 12 (29%) | 31 (29%) |
| • Stage 2 | 59 (40%) | 13 (32%) | 46 (43%) |
| • Stage 3 | 45 (31%) | 16 (39%) | 29 (28%) |
|
| |||
| Induction therapy (No, %) | |||
| Novel agents | 153 (98%) | 42 (98%) | 111 (98%) |
| • Thalidomide | 10 (6%) | 1 (2%) | 9 (8%) |
| • Lenalidomide | 104 (67%) | 28 (65%) | 76 (67%) |
| • Bortezomib | 56 (35%) | 20 (47%) | 36 (32%) |
|
| |||
| Upfront post-induction ASCT (No, %) | 50 (32%) | 13 (30%) | 37 (33%) |
Median (Range)
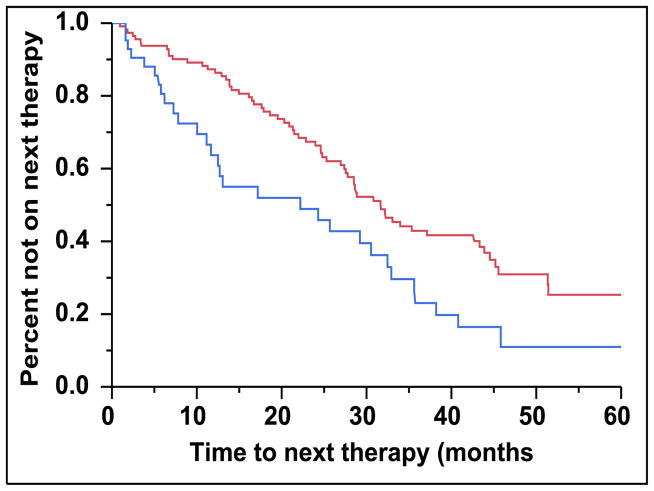
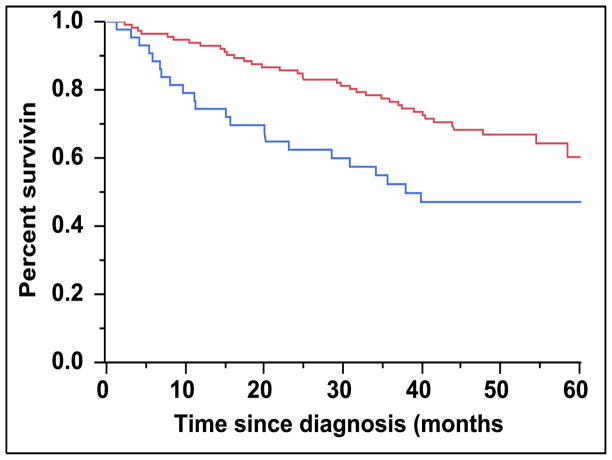
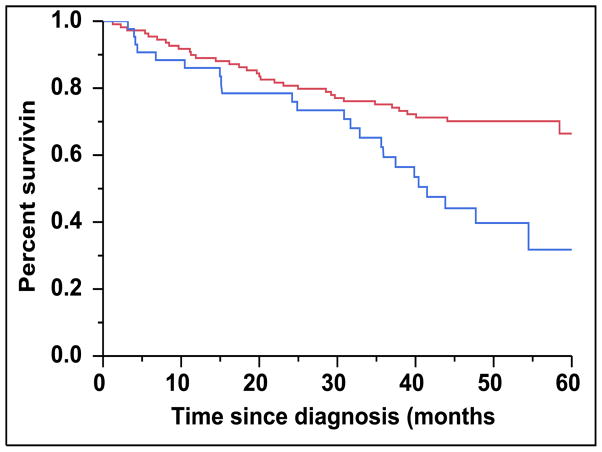
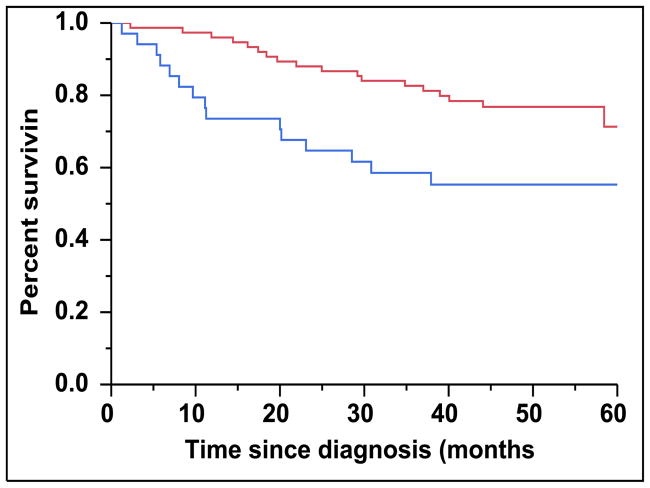
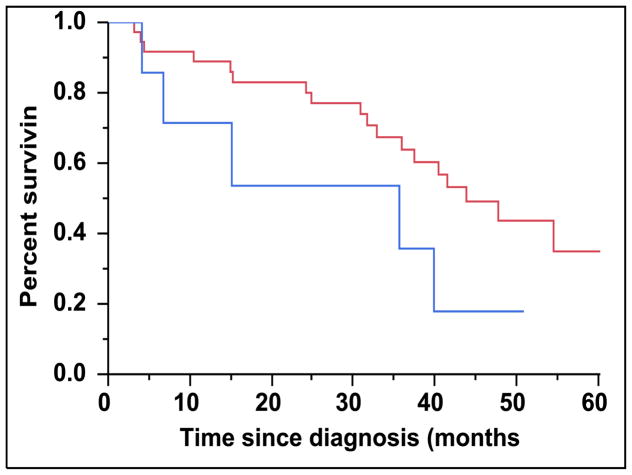
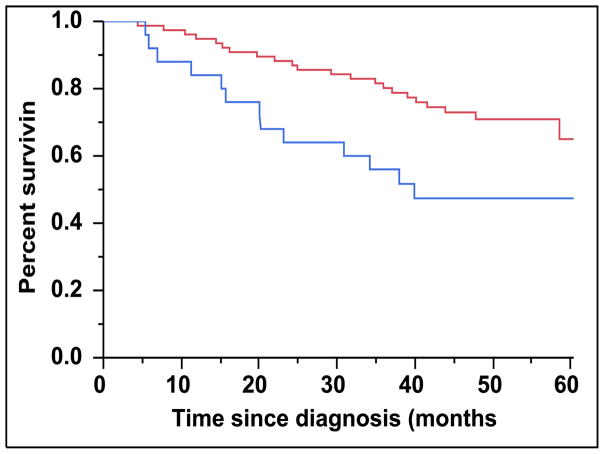
There were 43 (28%) newly diagnosed patients with MM who were categorized as being CD45 (+). There was a direct association between the presence of CD45 (+) immunophenotype among patients with newly diagnosed MM and the presence of PCLI > 3% (P = 0.004). There were 28 (27%) patients in the CD45 (−) cohort that had a beta-2-microglobulin greater than 5.5 mcg/mL versus 16 (39%) patients in the CD45 (+) cohort (P = 0.163). The median TTNT for patients in the CD45 (+) group was 22 months compared to 32 months for patients in the CD45 (−) group (P=0.005) (Figure 2A). The median OS for patients in the CD45 (+) group was 38 months versus not reached for the CD45 (−) group (P = 0.009) (Figure 2B). When risk-stratified by interphase FISH, the median OS for standard risk patients (n = 109, 72%) was not reached versus 42 months for the high risk patients (n = 43, 28%) (P = 0.003) (Figure 3A). Amongst the standard risk patients, though the median OS for patients in the CD45 (+) group (n = 34, 31%) was not reached, it was lower than the CD45 (−) group (n = 75, 69%) (P = 0.012) (Figure 3B). Among the high risk patients, the median OS for patients in the CD45 (+) group (n = 7, 16%) was 36 months versus 44 months for the CD45 (−) group (P = 0.097) (n = 36, 84%) (Figure 3C).
Figure 2.
A: Kaplan-Meier plot comparing TTNT between patients with newly diagnosed MM based on the proportion of CD45 expression on the clonal PCs in the bone marrow. B: Kaplan-Meier plot comparing OS between patients with newly diagnosed MM based on the proportion of CD45 expression on the clonal PCs in the bone marrow.
Figure 3.
A: Kaplan-Meier plot comparing OS between patients with newly diagnosed MM based on their molecular cytogenetics classification as high risk versus standard risk. B: Kaplan-Meier plot comparing OS between patients with newly diagnosed MM and standard-risk cytogenetics based on the proportion of CD45 expression on the clonal PCs in the bone marrow. C: Kaplan-Meier plot comparing OS between patients with newly diagnosed MM and high-risk cytogenetics based on the proportion of CD45 expression on the clonal PCs in the bone marrow.
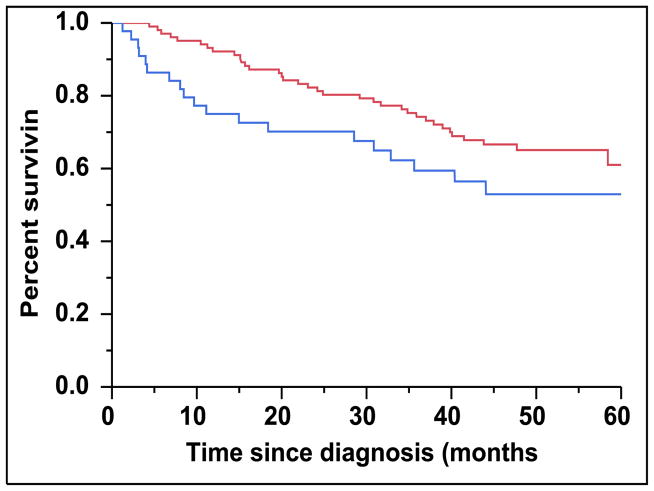
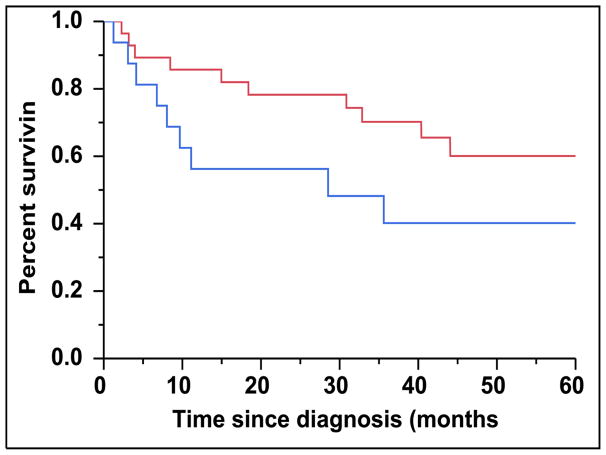
When risk-stratified by the ISS scoring system, the median OS for patients with ISS 3 (n = 45, 31%) was not reached but trended towards being inferior than patients with either ISS 1 or 2 (n = 102, 69%) (Figure 4A) (P = 0.098). For patients with an ISS score of 3, the median OS for patients in the CD45 (+) group (n = 16, 36%) was 29 months compared to not reached in the CD45 (−) group (n = 29, 64%) (P = 0.102) (Figure 4B). However, among patients with an ISS score of 1 or 2, the median OS for patients in the CD45 (+) group (n = 25, 25%) was 40 months versus not reached for the CD45 (−) group (n = 77, 75%) (P = 0.015) (Figure 4C).
Figure 4.
A: Kaplan-Meier plot comparing OS between patients with newly diagnosed MM and an ISS score of 3 versus an ISS score of 1 or 2. B: Kaplan-Meier plot comparing OS between patients with newly diagnosed MM and ISS score of 3 based on the proportion of CD45 expression on the clonal PCs in the bone marrow. C: Kaplan-Meier plot comparing OS between patients with newly diagnosed MM and ISS score of 1 or 2 based on the proportion of CD45 expression on the clonal PCs in the bone marrow.
The following variables were assessed in a univariate analysis to determine their effects on TTNT and OS: the presence of ≥ 20% CD45 (+) clonal PCs, age, beta-2-microglobulin, serum albumin, LDH, high risk FISH and PCLI. In a univariate model, the presence of ≥ 20% CD45 (+) clonal PCs, age ≥70, high risk FISH status, β-2-microglobulin > 5.5 mcg/mL, serum albumin < 3.5 g/dL, LDH > 222 U/L and PCLI >3% were associated with worse OS. In a multivariable analysis (Table 2), only age ≥ 70 (P=0.001), the presence of ≥ 20% CD45 (+) clonal PCs (P=0.013), LDH > 222 U/L (P=0.026), high risk FISH status (P=0.002) and PCLI >3% (P=0.007) retained statistical significance in predicting worse OS. Only the presence of ≥ 20% CD45 (+) clonal PCs predicted for worse TTNT in a multivariable analysis (HR: 1.84, 95% CI: 1.17–2.81; P=0.009).
Table 2.
Univariable and Multivariable analysis of factors predicting worse OS in newly diagnosed MM patients
| Variable | Overall survival (OS) | |||
|---|---|---|---|---|
| Univariable | Multivariable | |||
| Risk Ratio | p | Risk Ratio | p | |
| ≥ 20% CD45 (+) clonal PCs | 2.01 (1.16–3.37) | 0.013 | 2.28 (1.20–4.27) | 0.013 |
| Age 70+ | 3.24 (1.93–5.47) | <0.001 | 2.94 (1.55–5.64) | 0.001 |
| β-2-microglobulin > 5.5 | 1.80 (1.01–3.14) | 0.048 | 0.72 (0.32–1.51) | 0.400 |
| LDH > 222 U/L | 2.42 (1.10–4.76) | 0.030 | 2.93 (1.14–7.20) | 0.026 |
| PCLI > 3% | 2.83 (1.46–5.10) | 0.003 | 3.32 (1.42–7.46) | 0.007 |
| High risk status by FISH | 2.22 (1.29–3.78) | 0.005 | 2.86 (1.48–5.49) | 0.002 |
| Serum Albumin < 3.5 g/dL | 2.04 (1.22–3.45) | 0.007 | 1.37 (0.75–2.56) | 0.308 |
Incorporation of CD45 expression into an integrated risk stratification model
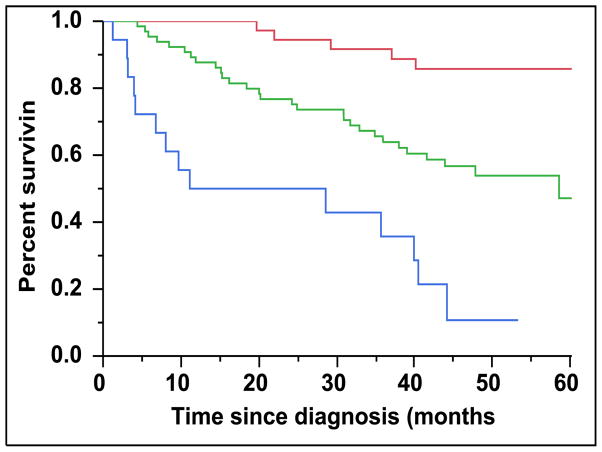
We assigned a score of 1 for each of the following variables found to be prognostic for OS in the multivariable analysis (Table 2): age ≥ 70, presence of ≥ 20% CD45 (+) clonal PCs, LDH > 222 U/L, ISS score of 3 and high risk FISH status. PCLI was not included in this model given that its use was not universal outside of our institution. This scoring system was used to assign patients to Group 1 (n = 36, 30%), Group 2 (n = 65, 55%) or Group 3 (n = 18, 15%) based on whether they had a score of 0, 1–2 and 3–5 respectively. There were 119 (76%) patients in this cohort who had values for all five variables available and were able to be classified appropriately. The median OS was not reached, 59 months and 20 months for patients in Group 1, Group 2 and Group 3 respectively (Figure 5) (P < 0.001). The two-year OS was 93% for Group 1, 75% for Group 2 and 41% for Group 3.
Figure 5.
Kaplan-Meier plot comparing OS between patients with newly diagnosed MM who are risk stratified into Groups 1, 2 and 3 based on cumulative number of adverse prognostic features present.
DISCUSSION
This is the largest study evaluating the prognostic significance of CD45 expression on clonal PCs in patients with MM. The results of this study demonstrates that the presence of ≥20% clonal PCs in the BM expressing CD45 bears negative prognostic value in patients with newly diagnosed MM. These results suggest that the higher proportion of clonal PCs expressing CD45 serves as a surrogate marker for a more aggressive phenotype of MM.
Current clinical practice utilizes a MM risk stratification system to distinguish between high-risk and standard risk patients by emphasizing the biology of the clonal PCs through their molecular cytogenetics or FISH, PCLI and gene expression profiling.(17) However, this study demonstrates that the assessment of CD45 expression on the clonal PCs within the BM may be biologically relevant and identifies a subset of newly diagnosed patients with MM who will experience a shorter OS earlier than predicted by traditional prognostic markers such as standard-risk cytogenetics by FISH and low ISS stage (1 or 2).(18, 19) For example, in this study, among the newly diagnosed patients with MM who had standard risk molecular cytogenetics, the presence of the CD45 (+) immunophenotype was able to further identify a subset of patients with worse OS. Furthermore, when combining the CD45 (+) immunophenotype with other well established prognostic markers such as ISS score of 3, high risk molecular cytogenetics, age ≥ 70 years and an elevated LDH, significant differences in OS can be detected in groups of patients based on the cumulative number of these adverse prognostic markers present (Figure 5).
Several studies have confirmed the presence of significant intra-clonal heterogeneity within the clonal PC population of patients with MM.(20–23) Similarly, with respect to CD45 expression on clonal PCs, prior studies have demonstrated the presence of two subsets of clonal PCs within patients with MM(24); i.e. those that highly express CD45 and those that have dim or do not express CD45. Furthermore, CD45 is expressed mostly in early stages of clonal PCs and subsequent more mature clonal PCs in patients with MM lose their CD45 expression.(5) Prior functional studies have evaluated the role of CD45 and its relationship to the IL-6 cytokine axis and have demonstrated that CD45 expression on clonal PCs can be induced by IL-6.(25, 26) However, only the CD45 (+) PC population, but not the CD45 (−) clonal PCs proliferate after IL-6 stimulation. Furthermore, CD45 (+) clonal PCs have been found to be the predominantly proliferative fraction when compared to the CD45 (−) clonal PC population and the proliferation decreases parallel to that of CD45 expression.(27) In our study we also found that the patients in the CD45 (+) group were associated with a higher PCLI compared to patients in the CD45 (−) group.
Given the higher proliferative nature of the CD45 expressing clonal PCs, one would expect it to be associated with more aggressive clinical disease. Yet, prior clinical studies have provided conflicting observations that an increased proportion of CD45 (+) clonal PCs in myeloma is associated with a better prognosis. Moreau et al retrospectively evaluated 95 newly diagnosed MM patients treated with high dose chemotherapy using four-color flow cytometry to determine the CD45 expression on their clonal PCs in their bone marrow.(9) The patients with MM who had a CD45 (−) immunophenotype had a significantly worse OS than patients characterized as the CD45 (+) immunophenotype of MM (42 months vs not reached; p = 0.004). Furthermore, the CD45 (−) immunophenotype remained the only parameter adversely affecting OS in the multivariate analysis. Although their findings contradict those reported in our study, it is likely explainable as a results of a few significant differences between the two studies. First, different flow cytometry techniques used as well as different patient populations included in both studies. Moreau et al used a four-color flow cytometer with antibody detection against CD45, CD38 and CD138 to identify the clonal PCs and then calculated their CD45 mean fluorescence intensities (MFI) in order to characterize patients as CD45 (+) or CD45 (−). These differences in flow cytometry techniques between studies could explain the discrepant results as we have previously demonstrated that such differences in flow cytometry strategies can lead to different detection levels of CD45 (+) PCs.(7) When comparing four-color and three-color flow cytometry data to study clonal PCs and specifically evaluating for CD45 expression, the degree of CD45 expression on the clonal PCs detected by six color flow cytometry was greater than expected.(7) This is likely because the six-color flow cytometry has greater sensitivity in detecting this PC component through the ability to gate through both CD38 and CD138 and to coincidently analyze CD19 and cytoplasmic immunoglobulin light chain expression. Furthermore, it is possible that the lack of CD19 gating in the study by Moreau et al could have led to the inclusion of non-clonal PCs in their analysis. A larger study clarifying our results would be useful in the future. Nevertheless, a recent study by Guo et al also assessed the immunophenotype of clonal PCs in the BM of 79 newly diagnosed patients with MM through four color flow cytometry.(11) They also demonstrated that patients who had more than 20% of their clonal PCs in the BM expressing CD45 had an inferior progression free survival.(11) These results in addition to those presented in our study suggest the negative prognostic implications of CD45 expression on the clonal PCs in the BM of patients with newly diagnosed MM.
Finally, we have previously demonstrated that increasing numbers of cPCs detected by six-color multiparameter flow cytometry is a strong negative prognostic factor for OS in both newly diagnosed and previously treated patients with MM.(12, 13) The presence of cPCs was not included in the multivariable model of this study due to the small sample size of patients having had their peripheral blood assessed by flow cytometry at the same time of their BM evaluations. Apart from just holding prognostic value, CD45 expression may bear valuable predictive value towards novel therapies in the future. Recent data has suggested that CD45 (+) clonal PCs with an IL-6 activated JAK/STAT3 pathway are particularly sensitive to Hsp-90 inhibitors as compared to the clonal PCs with low or no CD45 expression; this may provide a rational basis for the selection of MM patients amenable to HSP-90 inhibition.(28) Finally, evaluation of U266 MM cell lines and patient cells, which have a mix of CD45 positive and negative cells, demonstrated more profound cytotoxicity and antiproliferative activity of the novel JAK-2 inhibitor, TG101209, on the CD45 (+) population relative to the CD45 (−) clonal PCs.(29) Even though this study was underpowered and unable to evaluate the impact of induction therapies on the clinical responses of patients, majority of patients initially received immunomodulatory agents. This could influence the results because of these agents’ action on the bone marrow microenvironment and cytokine secretion, both of which have can affect clonal CD45 positive PCs.
There are several limitations to our study, the first being its retrospective nature. Second, the cutoff of ≥20% clonal marrow PCs expressing CD45 as an optimal cutoff for classifying the CD45 (+) immunophenotype is based on our single institution data and needs to be validated across other institutions. Third, the heterogeneity in induction treatments as well as the use of upfront ASCT used limits our ability to assess the predictive value of response to various treatments. Nevertheless, this study suggests that assessing the CD45 expression on clonal PCs in the BM is a powerful predictor of mortality in patients with newly diagnosed MM. This is especially useful given the short follow-up time of this study. Thus, these findings hold promise and may have implications for revising our definitions of high-risk disease as well as our practice of a personalized approach to anti-myeloma therapy in the future.
Key point.
CD45 expression on clonal plasma cells within the bone marrow may be an adverse prognostic marker in patients with multiple myeloma.
Highlights.
Clonal plasma cells from patients with multiple myeloma can express CD45.
Expression of CD45 on clonal plasma cells may bear negative prognostic value.
CD45 expression on clonal plasma cells is associated with higher proliferation.
Acknowledgments
Mayo Clinic Hematological Malignancies Program and in part by grants CA107476, CA62242, CA100707, CA168762 and CA 83724 from the National Cancer Institute, Rockville, MD, USA. It is also supported in part by the Jabbs Foundation, Birmingham, United Kingdom and the Henry J. Predolin Foundation, USA as well as the CTSA Grant UL1 TR000135 from the National Center for Advancing Translational Sciences (NCATS), a component of the National Institutes of Health (NIH).
Footnotes
Contribution: S.K.K. and W.I.G. designed the study, collected the data, analyzed the data and wrote the manuscript; M.M.T. reviewed all the flow cytometry testing and gating procedures for accuracy and consistency; S.V.R., M.A.G., A.D., M.Q.L., W.G.M., M.M.T., F.K.B., D.D., N.L., R.A.K., and P.K. contributed to writing and reviewing the manuscript.
Publisher's Disclaimer: This is a PDF file of an unedited manuscript that has been accepted for publication. As a service to our customers we are providing this early version of the manuscript. The manuscript will undergo copyediting, typesetting, and review of the resulting proof before it is published in its final citable form. Please note that during the production process errors may be discovered which could affect the content, and all legal disclaimers that apply to the journal pertain.
References
- 1.Kyle RA, Rajkumar SV. Multiple myeloma. The New England journal of medicine. 2004 Oct 28;351(18):1860–1873. doi: 10.1056/NEJMra041875. [DOI] [PubMed] [Google Scholar]
- 2.Rawstron AC, Orfao A, Beksac M, Bezdickova L, Brooimans RA, Bumbea H, et al. Report of the European Myeloma Network on multiparametric flow cytometry in multiple myeloma and related disorders. Haematologica. 2008 Mar;93(3):431–438. doi: 10.3324/haematol.11080. [DOI] [PubMed] [Google Scholar]
- 3.Thomas ML. The leukocyte common antigen family. Annual review of immunology. 1989;7:339–369. doi: 10.1146/annurev.iy.07.040189.002011. [DOI] [PubMed] [Google Scholar]
- 4.Trowbridge IS, Thomas ML. CD45: an emerging role as a protein tyrosine phosphatase required for lymphocyte activation and development. Annual review of immunology. 1994;12:85–116. doi: 10.1146/annurev.iy.12.040194.000505. [DOI] [PubMed] [Google Scholar]
- 5.Pellat-Deceunynck C, Bataille R. Normal and malignant human plasma cells: proliferation, differentiation, and expansions in relation to CD45 expression. Blood Cells Mol Dis. 2004 Mar-Apr;32(2):293–301. doi: 10.1016/j.bcmd.2003.12.001. [DOI] [PubMed] [Google Scholar]
- 6.Kumar S, Rajkumar SV, Kimlinger T, Greipp PR, Witzig TE. CD45 expression by bone marrow plasma cells in multiple myeloma: clinical and biological correlations. Leukemia. 2005 Aug;19(8):1466–1470. doi: 10.1038/sj.leu.2403823. [DOI] [PubMed] [Google Scholar]
- 7.Morice WG, Hanson CA, Kumar S, Frederick LA, Lesnick CE, Greipp PR. Novel multi-parameter flow cytometry sensitively detects phenotypically distinct plasma cell subsets in plasma cell proliferative disorders. Leukemia. 2007 Sep;21(9):2043–2046. doi: 10.1038/sj.leu.2404712. [DOI] [PubMed] [Google Scholar]
- 8.Bataille R, Robillard N, Pellat-Deceunynck C, Amiot M. A cellular model for myeloma cell growth and maturation based on an intraclonal CD45 hierarchy. Immunological reviews. 2003 Aug;194:105–111. doi: 10.1034/j.1600-065x.2003.00039.x. [DOI] [PubMed] [Google Scholar]
- 9.Moreau P, Robillard N, Avet-Loiseau H, Pineau D, Morineau N, Milpied N, et al. Patients with CD45 negative multiple myeloma receiving high-dose therapy have a shorter survival than those with CD45 positive multiple myeloma. Haematologica. 2004 May;89(5):547–551. [PubMed] [Google Scholar]
- 10.Johnsen HE, Bogsted M, Klausen TW, Gimsing P, Schmitz A, Kjaersgaard E, et al. Multiparametric flow cytometry profiling of neoplastic plasma cells in multiple myeloma. Cytometry Part B, Clinical cytometry. 2010 Sep;78(5):338–347. doi: 10.1002/cyto.b.20523. [DOI] [PubMed] [Google Scholar]
- 11.Guo J, Su J, He Q, Li X, Zhao Y, Gu S, et al. The prognostic impact of multiparameter flow cytometry immunophenotyping and cytogenetic aberrancies in patients with multiple myeloma. Hematology. 2015 Apr 10; doi: 10.1179/1607845415Y.0000000010. [DOI] [PubMed] [Google Scholar]
- 12.Gonsalves WI, Morice WG, Rajkumar V, Gupta V, Timm MM, Dispenzieri A, et al. Quantification of clonal circulating plasma cells in relapsed multiple myeloma. Br J Haematol. 2014 Nov;167(4):500–505. doi: 10.1111/bjh.13067. [DOI] [PMC free article] [PubMed] [Google Scholar]
- 13.Gonsalves WI, Rajkumar SV, Gupta V, Morice WG, Timm MM, Singh PP, et al. Quantification of clonal circulating plasma cells in newly diagnosed multiple myeloma: implications for redefining high-risk myeloma. Leukemia. 2014 Oct;28(10):2060–2065. doi: 10.1038/leu.2014.98. [DOI] [PMC free article] [PubMed] [Google Scholar]
- 14.Greipp PR, Kumar S. Plasma cell labeling index. Methods Mol Med. 2005;113:25–35. doi: 10.1385/1-59259-916-8:25. [DOI] [PubMed] [Google Scholar]
- 15.Kapoor P, Fonseca R, Rajkumar SV, Sinha S, Gertz MA, Stewart AK, et al. Evidence for cytogenetic and fluorescence in situ hybridization risk stratification of newly diagnosed multiple myeloma in the era of novel therapie. Mayo Clin Proc. 2010 Jun;85(6):532–537. doi: 10.4065/mcp.2009.0677. [DOI] [PMC free article] [PubMed] [Google Scholar]
- 16.Trendle MC, Leong T, Kyle RA, Katzmann JA, Oken MM, Kay NE, et al. Prognostic significance of the S-phase fraction of light-chain-restricted cytoplasmic immunoglobulin (cIg) positive plasma cells in patients with newly diagnosed multiple myeloma enrolled on Eastern Cooperative Oncology Group treatment trial E9486. Am J Hematol. 1999 Aug;61(4):232–237. doi: 10.1002/(sici)1096-8652(199908)61:4<232::aid-ajh2>3.0.co;2-t. [DOI] [PubMed] [Google Scholar]
- 17.Mikhael JR, Dingli D, Roy V, Reeder CB, Buadi FK, Hayman SR, et al. Management of newly diagnosed symptomatic multiple myeloma: updated Mayo Stratification of Myeloma and Risk-Adapted Therapy (mSMART) consensus guidelines 2013. Mayo Clin Proc. 2013 Apr;88(4):360–376. doi: 10.1016/j.mayocp.2013.01.019. [DOI] [PubMed] [Google Scholar]
- 18.Munshi NC, Anderson KC, Bergsagel PL, Shaughnessy J, Palumbo A, Durie B, et al. Consensus recommendations for risk stratification in multiple myeloma: report of the International Myeloma Workshop Consensus Panel 2. Blood. 2011 May 5;117(18):4696–4700. doi: 10.1182/blood-2010-10-300970. [DOI] [PMC free article] [PubMed] [Google Scholar]
- 19.Greipp PR, San Miguel J, Durie BG, Crowley JJ, Barlogie B, Blade J, et al. International staging system for multiple myeloma. J Clin Oncol. 2005 May 20;23(15):3412–3420. doi: 10.1200/JCO.2005.04.242. [DOI] [PubMed] [Google Scholar]
- 20.Brioli A, Giles H, Pawlyn C, Campbell JP, Kaiser MF, Melchor L, et al. Serum free immunoglobulin light chain evaluation as a marker of impact from intraclonal heterogeneity on myeloma outcome. Blood. 2014 May 29;123(22):3414–3419. doi: 10.1182/blood-2013-12-542662. [DOI] [PubMed] [Google Scholar]
- 21.Melchor L, Brioli A, Wardell CP, Murison A, Potter NE, Kaiser MF, et al. Single-cell genetic analysis reveals the composition of initiating clones and phylogenetic patterns of branching and parallel evolution in myeloma. Leukemia. 2014 Aug;28(8):1705–1715. doi: 10.1038/leu.2014.13. [DOI] [PubMed] [Google Scholar]
- 22.Paino T, Paiva B, Sayagues JM, Mota I, Carvalheiro T, Corchete LA, et al. Phenotypic identification of subclones in multiple myeloma with different chemoresistant, cytogenetic and clonogenic potential. Leukemia. 2015 May;29(5):1186–1194. doi: 10.1038/leu.2014.321. [DOI] [PubMed] [Google Scholar]
- 23.Walker BA, Wardell CP, Melchor L, Hulkki S, Potter NE, Johnson DC, et al. Intraclonal heterogeneity and distinct molecular mechanisms characterize the development of t(4;14) and t(11;14) myeloma. Blood. 2012 Aug 2;120(5):1077–1086. doi: 10.1182/blood-2012-03-412981. [DOI] [PubMed] [Google Scholar]
- 24.Schneider U, van Lessen A, Huhn D, Serke S. Two subsets of peripheral blood plasma cells defined by differential expression of CD45 antigen. Br J Haematol. 1997 Apr;97(1):56–64. doi: 10.1046/j.1365-2141.1997.d01-2115.x. [DOI] [PubMed] [Google Scholar]
- 25.Mahmoud MS, Ishikawa H, Fujii R, Kawano MM. Induction of CD45 expression and proliferation in U-266 myeloma cell line by interleukin-6. Blood. 1998 Nov 15;92(10):3887–3897. [PubMed] [Google Scholar]
- 26.Ishikawa H, Mahmoud MS, Fujii R, Abroun S, Kawano MM. Proliferation of immature myeloma cells by interleukin-6 is associated with CD45 expression in human multiple myeloma. Leuk Lymphoma. 2000 Sep;39(1–2):51–55. doi: 10.3109/10428190009053538. [DOI] [PubMed] [Google Scholar]
- 27.Pope B, Brown R, Gibson J, Joshua D. The bone marrow plasma cell labeling index by flow cytometry. Cytometry. 1999 Dec 15;38(6):286–292. doi: 10.1002/(sici)1097-0320(19991215)38:6<286::aid-cyto5>3.0.co;2-7. [DOI] [PubMed] [Google Scholar]
- 28.Lin H, Kolosenko I, Bjorklund AC, Protsyuk D, Osterborg A, Grander D, et al. An activated JAK/STAT3 pathway and CD45 expression are associated with sensitivity to Hsp90 inhibitors in multiple myeloma. Exp Cell Res. 2013 Mar 10;319(5):600–611. doi: 10.1016/j.yexcr.2012.12.006. [DOI] [PubMed] [Google Scholar]
- 29.Ramakrishnan V, Kimlinger T, Haug J, Timm M, Wellik L, Halling T, et al. TG101209, a novel JAK2 inhibitor, has significant in vitro activity in multiple myeloma and displays preferential cytotoxicity for CD45+ myeloma cells. Am J Hematol. 2010 Sep;85(9):675–686. doi: 10.1002/ajh.21785. [DOI] [PMC free article] [PubMed] [Google Scholar]


