Abstract
In vitro, replacing KCl by potassium glutamate (KGlu), the E. coli cytoplasmic salt and osmolyte, stabilizes folded proteins and protein-nucleic acid complexes. To understand the chemical basis for these effects and rank Glu− in the Hofmeister anion series for protein unfolding, we quantify and interpret the strong stabilizing effect of KGlu on the ribosomal protein domain NTL9, relative to other stabilizers (KCl, KF, K2SO4) and destabilizers (GuHCl, GuHSCN). GuHSCN titrations at 20 °C, performed as a function of concentration of KGlu or other salt and monitored by NTL9-fluorescence, are analyzed to obtain r-values quantifying the Hofmeister salt concentration (m3)-dependence of the unfolding equilibrium constant Kobs (r-value = −dlnKobs/dm3 = (1/RT) dΔG°obs/dm3 = m-value/RT). r-Values for both stabilizing K+ salts and destabilizing GuH+ salts are compared with predictions from model-compound data. For two-salt mixtures, we find that contributions of stabilizing and destabilizing salts to observed r-values are additive and independent. At 20 °C, we determine a KGlu r-value of 3.22 m−1, and K2SO4, KF, KCl, GuHCl and GuHSCN r-values of 5.38, 1.05, 0.64, −1.38 and −3.00 m−1 respectively. The KGlu r-value represents a 25-fold (1.9 kcal) stabilization per molal KGlu added. KGlu is much more stabilizing than KF, and the stabilizing effect of KGlu is larger in magnitude than the destabilizing effect of GuHSCN. Interpretation of the data reveals good agreement between predicted and observed relative r-values, and indicates the presence of significant residual structure in GuHSCN-unfolded NTL9 at 20 °C.
Graphical abstract
INTRODUCTION
Potassium glutamate (KGlu), the primary cytoplasmic salt in E. coli is accumulated at high concentration (> 0.3 M Glu−) in response to osmotic stress1, 2. In vitro, replacing Cl− by Glu− stabilizes folded proteins3 and greatly stabilizes protein-nucleic acid complexes4–7. While an increase in concentration of KGlu destabilizes protein-nucleic acid complexes because of the dominance of the Coulombic (polyelectrolyte) effect of K+, binding constants of lac repressor – lac operator, IHF – H' DNA and closed RNA polymerase – λPR complexes all increase 30 – 40 fold when Cl− is replaced by Glu− 8–10 at constant K+ concentration, and the folding and assembly of a jaw/clamp to stabilize the RNAP-promoter open complex is favored by up to 100 fold10.
In this study, we quantify effects of KGlu on protein stability and compare it with other stabilizing K+ salts from the Hofmeister series11, 12. Salt effects on many biopolymer processes that change the exposure of biopolymer surface to water follow this series at moderate to high salt concentration (> 0.1 M), where Coulombic salt effects are minimized13–17. Hofmeister salt effects on biopolymer and model processes arise from the net accumulation or exclusion of the ions of the salt from the surface exposed or buried in the process (i.e. the ΔASA)18, 19. Effects of nonelectrolytes like urea, amino acids and polyols on these processes also arise from local accumulation or exclusion of the solutes from the ΔASA14.
The Hofmeister series order observed for salt effects on protein processes is typically the same as the order of interaction of these salts with hydrocarbon surface13–16. Many of these salts also interact significantly with amide groups, but in general salt-amide interactions do not follow the classical Hofmeister order. Potassium sulfate (K2SO4) and fluoride (KF) are at one end of the Hofmeister series for protein processes, functioning as strong protein stabilizers and precipitants because their ions are highly excluded from hydrocarbon groups. GuHCl and especially GuHSCN are at the other end of the Hofmeister series, functioning as strong destabilizers and solubilizers of proteins. Interpretation of salt-peptide interaction data revealed that GuH+ (like K+ and Na+) is highly accumulated at amide groups but (unlike K+ and Na+) is only weakly excluded from hydrocarbon groups18–20. Anions SCN− and (to a lesser extent) Cl− are accumulated at hydrocarbon groups, and both are moderately excluded from amide groups11–14.
Pegram and Record18, 19 developed an analysis to predict or interpret Hofmeister salt effects on processes in aqueous solution in terms of the amount and composition of the ΔASA of the process. Extant data quantifying Hofmeister salt effects on solubility of uncharged amides and hydrocarbons were interpreted to determine the local accumulation or exclusion of salts and salt ions in the vicinity of amide and hydrocarbon groups. As demonstrations of the utility of this approach, effects of stabilizing and destabilizing Hofmeister salts on a variety of processes including micelle formation and folding of the lac repressor DNA binding domain were predicted and compared with experimental data. Key quantities for these analyses are i) ion-specific microscopic local-bulk partition coefficients (KP) that quantify the accumulation or exclusion of the ion in the vicinity of hydrocarbon and amide groups, and ii) the amount and composition of the water-accessible surface area exposed or buried in the process (ΔASA). Guinn et al20 used this approach to interpret effects of the Hofmeister salt GuHCl as well as urea on protein folding rate constants and thereby characterize the high-free-energy transition state of protein folding. Here we apply this analysis to interpret effects of KGlu, KCl, KF and K2SO4 as well as GuHCl and GuHSCN, on the stability of folded NTL9 in terms of the interactions of these salts and their ions with hydrocarbon and amide groups exposed upon unfolding.
For these studies we use the well-characterized protein NTL9, the N-terminal domain of the ribosomal protein L9. NTL9 is a 56 residue protein with both α-helix and β-sheet secondary structure. The decrease in fluorescence of a core residue (Y25) in unfolding is well-fit by a two state model21, while CD data indicates pre-transition fraying of a surface helix21. In the absence of a denaturant, NTL9 is a very stable protein at 20 °C (Tm = 78 °C)21, and becomes more stable with addition of the K+ salts investigated. Hence we use the strong chemical denaturant GuHSCN instead of urea or GuHCl to unfold it. All unfolding transitions occur at total salt concentrations in the molar range, where Coulombic salt effects are suppressed or eliminated, and Hofmeister salt effects are dominant.
MATERIALS AND METHODS
Chemicals
Sodium chloride (99.8%), sodium acetate (99.5%) and guanidinium chloride (≥99.5%) were purchased from Fisher Scientific. Potassium chloride and guanidinium thiocyanate (both >99%) were purchased from Sigma Aldrich. Potassium glutamate (>99%) was purchased from Fluka. Potassium fluoride (>99%) was purchased from Acros Organic. Potassium sulfate (≥99%) was purchased from J. T. Baker.
Buffers
The buffer for NTL9 unfolding experiments, designated NB, is 20 mM sodium acetate, 100 mM sodium chloride, pH 6.322, to which a K+ salt (chloride, fluoride, glutamate, or sulfate) was added. Final K+ salt concentrations in NB ranged from 0 to 0.8 M in 0.1 M increments for chloride, fluoride and glutamate, and 0 to 0.3 M in 0.05 M increments for sulfate, a much less soluble salt. Concentrated stock solutions of guanidinium salts (6 M GuHCl; 4 M GuHSCN) for use in unfolding titrations were prepared in NB with or without a K+ salt. Weights of each component in all solutions were determined and used to convert from molar to molal concentration scale.
Preparation of NTL9
Wild-type NTL9 protein was expressed in the E. coli strain BL21 (DE3) containing the NTL9-pET3a plasmid with ampicillin resistance. Cells were grown in 1 L of Luria – Bertani broth containing 100 mg/l ampicillin, and after reaching an optical density of 0.8 at 600 nm, they were induced with 1 mM of isopropyl-β-d-1-thiogalactopyranoside (IPTG). Four hours after induction, the cells were harvested by centrifugation for 10 min at 5000 rpm. Cell pellets were lysed, and protein was purified from the supernatant by cation-exchange chromatography, followed by reverse-phase HPLC on a C8 preparative column. For HPLC purification, an A – B gradient system was used in which buffer A consisted of 0.1% (v/v) solution of trifluoroacetic acid (TFA) in water, and buffer B consisted of 90% (v/v) acetonitrile, 10% (v/v) water, and 0.1% (v/v) TFA. The yield was ~80 mg/L. Final protein samples were stored at −20°C in NB buffer. A fluorescent impurity in some samples was eliminated by dialyzing against 1000-fold excess volume of NB at 4°C for 48 hrs.
Unfolding Experiments with GuH+ Salts
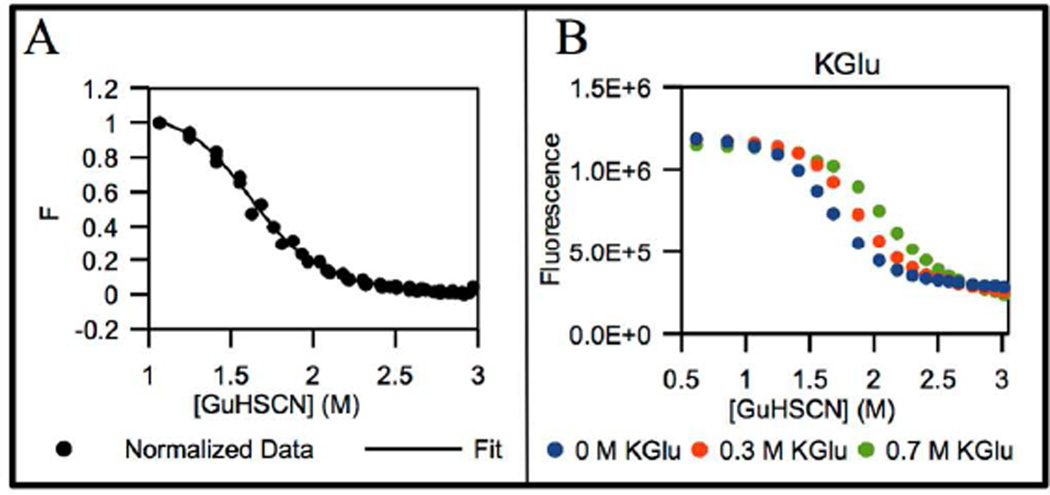
A 20 µM NTL9 solution in NB at a particular K+ salt concentration was titrated with a 4 M GuHSCN solution at same K+ salt concentration. Titrations were performed to a final GuHSCN concentration of 3.5 M where NTL9 is completely unfolded (see Fig 1A below). Molar concentrations of K+ salts were kept constant in experiments and subsequently converted to molal concentrations for the analysis. Unfolding experiments with GuHCl were performed analogously, using 6 M GuHCl to titrate NTL9 solutions in NB in small volumetric steps. Titrations were continued to a GuHCl concentration of 5.5 M where NTL9 is completely unfolded (Fig S1).
Fig 1.
NTL9 fluorescence in NB at 20 °C as a function of GuHSCN concentration (M) without added salt and at 0.3 M and 0.7 M KGlu. Panel A: normalized fluorescence F (Eq. S1) obtained from multiple determinations (triplicate) of GuHSCN unfolding in absence of added K+ salt. Panel B: background corrected fluorescence intensities (Fbkgd.corr in Eq. 1) from individual experiments. The curve in panel A is the fit to Eq. S1.
Quantifying NTL9 Unfolding by Tyrosine Fluorescence Measurements
Fluorescence data were acquired with a QuantaMaster Model C-60/2000 Spectrofluorometer (Photon Technologies International) at 20 °C and pH 6.3. Y25 fluorescence of NTL9 was excited at 285 nm and emission intensities were determined at 303 nm, the emission maximum. GuHCl and, to a lesser extent, GuHSCN solutions exhibit reproducible background fluorescence which increases with increasing GuH+ salt concentration, as shown in Figs. S2A and S2B. All fluorescence readings in GuHCl and GuHSCN unfolding titrations were corrected for this background to obtain quantities designated Fbkgd.corr. For GuHSCN, this is a 5% correction of the fluorescence intensity of folded NTL9, but up to a 40% correction of the fluorescence intensity of unfolded NTL9.
Data Analysis
To compare data between experiments, fluorescence intensities from individual GuHSCN titrations were normalized using Eq. 1:
| (Eq. 1) |
In Eq. 1, Fbkgd.corr is the background corrected fluorescence intensity (see above), F3.0 and F1.1 are the background corrected intensities at GuHSCN concentrations of ~3.0 M (NTL9 completely unfolded) and 1.1 M respectively, and F is the normalized fluorescence change. A small NTL9 Y25 fluorescence quenching is observed at low GuHSCN concentration (< 0.8 M), possibly due to interaction of the anion SCN− with NTL9 Y25. To avoid this artifact in the baseline, the fluorescence intensity at 1.1 M GuHSCN, at the beginning of the transition region and free of this quenching effect, was used for normalization. Data points at low GuHSCN concentration (<0.8M) that are affected by this quenching effect were not included in the data analysis.
Corrections for baseline fluorescence effects as a function of molal concentrations of GuHSCN and K+ salt were carried out globally on the normalized intensities F, to obtain θ, the fraction of NTL9 molecules unfolded, for each salt studied.
| (Eq. 2) |
In Eq. 2, Ff is the fluorescence baseline at low GuHSCN concentration where the protein is folded. This baseline is observed to be independent of salt concentration in the range studied. Also in Eq. 2, Fu is the fluorescence baseline at high GuHSCN concentration where the protein is unfolded. Fu varies linearly with denaturant and salt concentration and was expressed using an intercept and GuHSCN- and K+ salt-dependent slopes s3 and s4, respectively; . Here, m3 and m4 are molal concentrations of GuHSCN and K+ salt, respectively.
NTL9 Y25 fluorescence unfolding data are well-described by the two – state model folded (f) ↔ unfolded(u)21. Observed equilibrium constants for two-state unfolding (Kobs) as a function of GuHSCN concentration are related to θ, the fraction of NTL9 molecules that are unfolded by Eq. 3.
| (Eq. 3) |
Effects on lnKobs of unfolding from changes in molal concentration of two salts in a 4 component system (where GuHSCN is component 3 and K+ salt is component 4) are given by:
| (Eq. 4) |
In Eq. 4, r3 and r4 are defined as:
| (Eq. 5) |
where ΔGoobs = −RTlnKobs is the standard free energy of unfolding. If r3 and r4 are independent of m3 and m4, as is found to be the case for the pairs of salts investigated here (see Results), the integrated form of Eq. 4 is
| (Eq. 6) |
where K0 is the extrapolated value of Kobs in NB without added GuHSCN or K+ salt. For this situation, from Eqs. 3 – 6,
| (Eq. 7) |
Ko was obtained from the fit to the unfolding data in the absence of any K+ salt using Eq. 8 for one salt (m4 = 0) (Fig S3). Using Eqs. 2 – 7, together with the concentration dependence of the unfolded baseline , we obtain the final fitting equation.
| (Eq. 8) |
Eq. 8 was used to globally fit normalized fluorescence intensities (F) in terms of the baseline parameters and the r-values (r3, r4) using Igor23. Uncertainties in the r-values obtained from the global fits to the data are not significantly different from the experimental uncertainties.
In the case of titrations using GuHCl, background corrected intensities (Fbkgd.corr) were used for the fit in Eq. 2 instead of normalized fluorescence (F). The baselines Ff and Fu in Eq. 2 were both found to be GuHCl concentration dependent (Fig S1) and were defined as such using slopes (sf, su) and intercepts for the lower (folded) and upper (unfolded) baselines respectively: . As this system has only one salt, a slightly modified version of Eq. 7 was used (m4 = 0) to obtain the final fitting equation.
| (Eq. 9) |
The GuHCl unfolding data and fit using Eq. 9 are shown in Fig S1.
Accessible Surface Area (ASA) Calculation
The accessible surface area of the folded protein (ASAf) was calculated from the NMR solution structure for NTL924 (1CQU)25 using SurfRacer26 with the same set of van der Waals radii (from Richards27) and the same probe (water) radius (1.4Å) as used to analyze model compound data18, 28. The unfolded conformation was modeled as an extended (all-β) chain to calculate its ASA (ASAu, max) (Fig S4). This model was built with an extended backbone conformation (ϕ = 180°, ψ = 180°) generated using PyMol29 and with statistically preferred rotamers for the side-chains while avoiding steric clashes using Coot30.
The maximum ΔASA of unfolding (ΔASAmax) was calculated as
| (Eq. 10) |
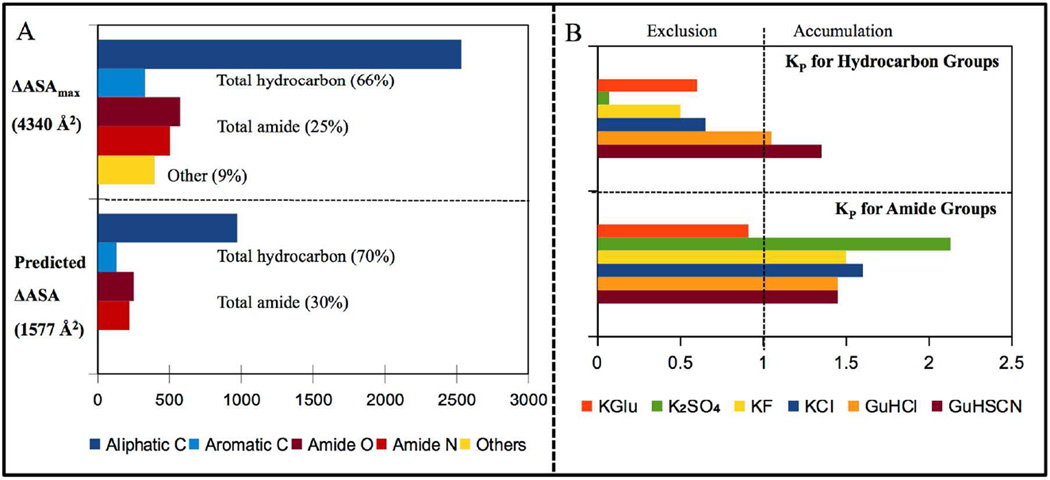
For NTL9, ΔASAmax = 4340 A2 (Table S1). Individual contributions to ΔASAmax from the seven major types of protein functional groups (aliphatic and aromatic C; amide, carboxylate and hydroxyl O; amide and cationic N) were determined (Table S1). The aliphatic to aromatic ratio of the ΔASAmax is ~7.3 and the amide O to amide N ratio is ~1.1 (Fig 4A and Table S1). Hydrocarbon and amide groups together account for 91% of ΔASAmax.
RESULTS
Effects of KGlu and Other Salts on NTL9 Unfolding by GuHSCN
Chemical unfolding of NTL9 by GuHCl and GuHSCN was observed by monitoring Y25 fluorescence at 20 °C. NTL9 has one tyrosine (Y25) and no tryptophan. Y25 fluorescence intensity decreases during unfolding22 (Fig 1, Fig S1, Fig S5). Data for GuHSCN and GuHCl unfolding in the absence of K+ salts are shown in Figs 1A and S1, respectively. Midpoint concentrations (Cm) for unfolding by GuHSCN and GuHCl are 1.6 M (2.1 m) and 2.8 M (3.8 m). To quantify effects of KGlu on protein folding relative to other Hofmeister salts at 20 °C, where model compound data for interactions of Hofmeister salts with hydrocarbon and amide groups are available, chemical denaturation with GuHSCN in the presence of a second K+ salt is used to unfold NTL9.
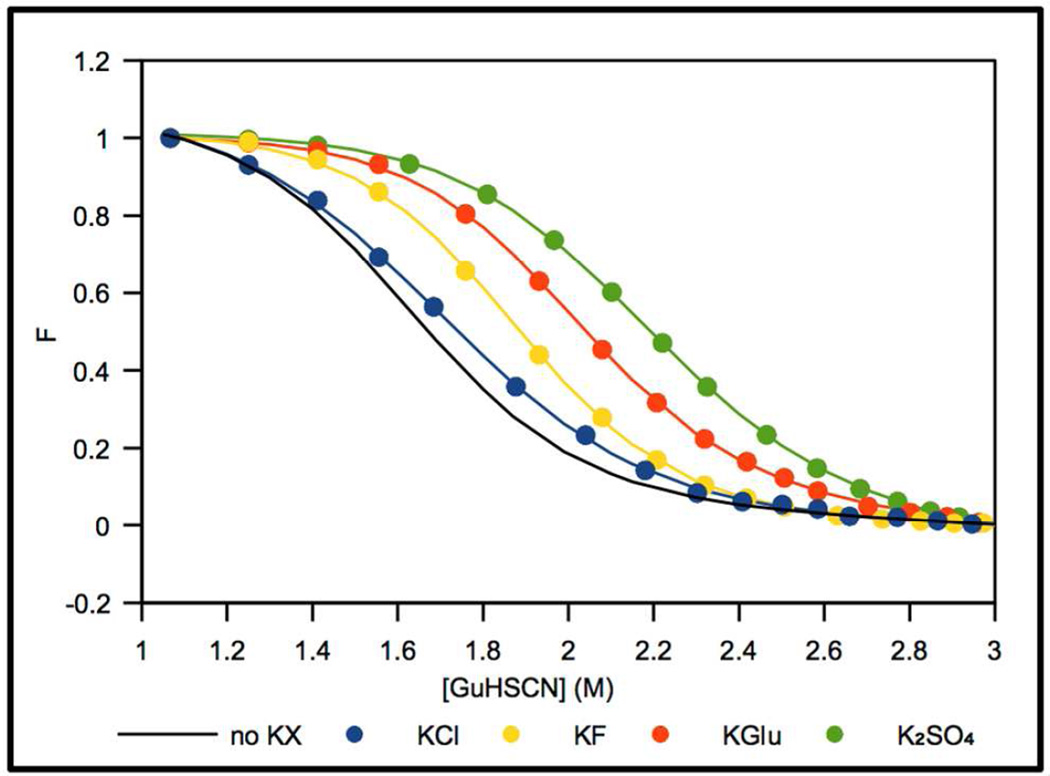
For each stabilizing K+ salt investigated, the unfolding transition for NTL9 shifts to a higher GuHSCN concentration with increasing K+ salt concentration. The extent of stabilization depends on the nature of the salt anion, as shown in Fig 2 where the normalized fluorescence of NTL9 is plotted as a function of GuHSCN concentration in the absence and presence of 1M total ion concentration for each K+ salt. KGlu clearly is highly stabilizing, with a per-ion stabilizing effect midway between KF and K2SO4. KF exerts a more modest stabilizing effect, while KCl is only slightly stabilizing. The GuHSCN Cm value increases from 1.6 M in the absence of added salt to 2.0 M in 0.5 M KGlu. For comparison, Cm = 2.1 M in 0.33 M K2SO4, Cm = 1.9 M in 0.5 M KF, and Cm = 1.7 M in 0.5 M KCl. Since the total salt concentration always is in the molar range, Coulombic contributions to these stabilizing effects are small19.
Fig 2.
Normalized NTL9 fluorescence changes, F (●) in NB at 20 °C as a function of GuHSCN concentration (M) for 1 M total ion concentration of the following K+ salts: KGlu (red), K2SO4 (green), KF (yellow) and KCl (blue) compared with no added salt (black). Curves represent fits to the data using Eq. S1.
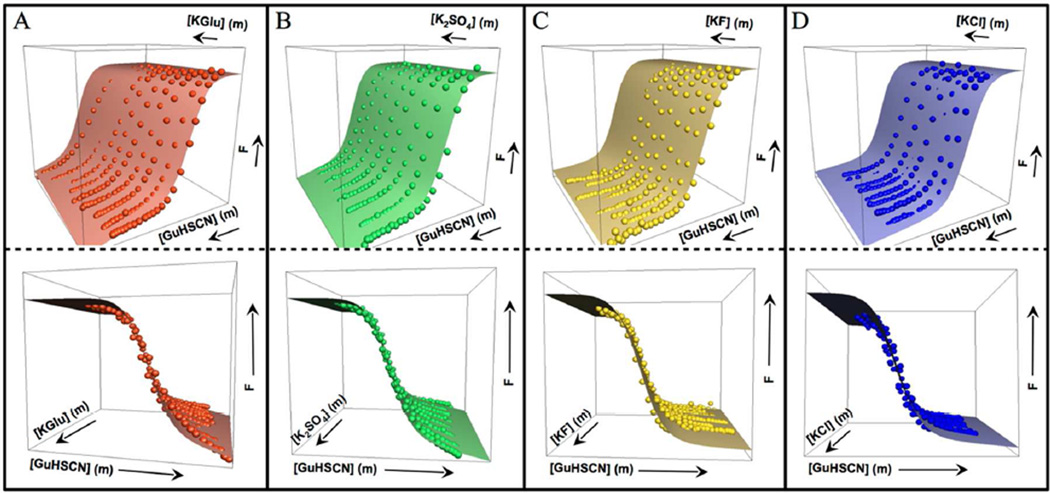
Normalized fluorescence changes for unfolding NTL9 at 20 °C as a function of molal concentrations of K+ salt and of GuHSCN are shown in Fig 3. A global fit to the normalized fluorescence data using Eq. 8 yields r-values for all four K+ salts and GuHSCN, listed in Table 1. KGlu (r-value = 3.22 m−1) is highly stabilizing; this r-value corresponds to a 25-fold reduction in the unfolding equilibrium constant and a 1.9 kcal increase in ΔGoobs of unfolding at 20 °C per molal KGlu added. By comparison, K2SO4 (r-value = 5.38 m−1), the most stabilizing salt, reduces Kobs of unfolding by 220-fold per molal, while GuHSCN (r-value = −3.00 m−1) increases Kobs by 20 fold per molal. Compared per ion of the salt, r-values for both KGlu (1.61 per molal of ions) and K2SO4 (1.79 per molal of ions) are larger in magnitude than the per ion effect of the strong destabilizer GuHSCN (−1.50 per molal of ions), where both cation and anion are at the destabilizing end of Hofmeister cation and anion series14. Hence, Glu− must rank at the extreme stabilizing end of the Hofmeister anion series for protein folding. KGlu is much more stabilizing than KF (r-value = 1.05 m−1, or 0.52 m−1 per ion) and KCl (r-value = 0.64 m−1, or 0.32 m−1 per ion). The stabilizing KF r-value is somewhat smaller in magnitude than that of the moderately strong destabilizer GuHCl (r-value = −1.38 m−1 (Table 1); see also reference 22).
Fig 3.
Normalized fluorescence intensity F of NTL9 Y25 in NB at 20 °C as a function of molal concentrations of GuHSCN and K+ salt: (A) KGlu (red), (B) K2SO4 (green), (C) KF (yellow) and (D) KCl (blue). Each surface shows the global fit (Eq. 8) to the data points (●); top and bottom panels show different views of the fit. K+ salt concentration ranges in panels A, C and D are 0 to 1.5 m; the K2SO4 range (B) is from 0 to 0.5 m. The GuHSCN concentration range in all cases is from 0 to 6 m.
Table 1.
Summary of GuH+ and K+ salt r-values for chemical denaturation of NTL9a.
| Salt | (r-value)4 (m−1) | (r-value)3 (m−1) | |
|---|---|---|---|
| Component | |||
| 3 | 4 | (K+ salt) | (GuH+ salt) |
| GuHCl | - | - | −1.38 ± 0.11 |
| GuHSCN | - | - | −3.00 ± 0.08 |
| GuHSCN | KCl | 0.64 ± 0.12 | −2.94 ± 0.04 |
| GuHSCN | KF | 1.05 ± 0.07 | −2.93 ± 0.02 |
| GuHSCN | KGlu | 3.22 ± 0.09 | −3.08 ± 0.03 |
| GuHSCN | K2SO4 | 5.38 ± 0.17 | −3.07 ± 0.02 |
Errors shown are fitting errors.
DISCUSSION
Predicting Effects of KGlu and Other Hofmeister Salts on NTL9 Stability from Model Compound Data
To predict and/or interpret r-values that quantify Hofmeister effects of the six salts investigated on NTL9 stability, we first calculate the amount and composition of the ΔASA for unfolding of NTL9 to an extended (all-β) chain (ΔASAmax) as described in Methods. This provides an upper bound value for the ΔASA of unfolding, which was found to be useful in previous analyses of protein unfolding r-values for denaturants like urea and GuHCl20, 31, but which overestimated the ΔASA of unfolding of lacDBD in stabilizing salts and solutes18, 19. Results for ΔASAmax are given in Figure 4A (top panel) and Table S1.
Fig 4.
(A) Comparison of the amount and composition (coarse-grained by functional group) of the ΔASA of unfolding NTL9 to an unstructured polypeptide (ΔASAmax; top) and to a compact unfolded state (predicted ΔASA; bottom). (B) Partition coefficients (KP) quantifying net accumulation or exclusion of the ions of these salts in the vicinity of hydrocarbon (top) and amide (bottom) groups. KP values for all salts except KGlu are from reference 18; KP values for KGlu are from reference 28.
To predict r-values from the ΔASA information, quantitative information about the interactions of each salt with the hydrocarbon and amide groups that make up the ΔASA is needed. From analysis of literature data for salt-hydrocarbon and salt-oligopeptide interactions, Pegram and Record quantified interactions of K+, GuH+, SCN−, Cl−, F− and SO42− ions and their salts with hydrocarbon and amide groups18. Recently, Cheng et al28 determined interactions of KGlu with these and other protein groups. Results are expressed as local-bulk partition coefficients KP,salt quantifying the net favorable (KP,salt > 1; net accumulation) or unfavorable (KP,salt < 1; net exclusion) interaction of the ions of each salt with these groups.
KP,salt values for the stabilizing and destabilizing salts investigated here are given in the bar graphs of Figure 4B. KGlu interacts moderately unfavorably with hydrocarbon (C) groups (KP, C-KGlu = 0.6), indicating that the arithmetic average local concentration of K+ and Glu− ions near hydrobarbon groups is 60% of the bulk KGlu concentration28. KGlu interacts slightly unfavorably with amide (A) groups (KP, A-KGlu = 0.9), indicating that the arithmetic average local concentration of K+ and Glu− ions near amide groups is 90% of the bulk KGlu concentration28. Comparison with other protein stabilizing salts investigated here reveals that KGlu ranks between KCl and KF in terms of net unfavorable interactions of its ions with hydrocarbon groups. Strikingly, KGlu differs very significantly from all other salts investigated because its interaction with amide groups is also unfavorable28. If unfolding exposed only hydrocarbon groups, Figure 4 predicts that KGlu would be a moderate stabilizer, better than KCl but not as good as KF. But because protein unfolding also exposes amide groups KGlu is predicted to be a strong stabilizer, as described below. By comparison, strong stabilizer K2SO4 exhibits a much more unfavorable interaction with hydrocarbon groups than KGlu, but exhibits a favorable (destabilizing) interaction with amide groups. These interactions are discussed below at the level of the individual ions, and Glu− is compared with other anions of the Hofmeister series.
Maximum magnitudes of NTL9 unfolding r-values for GuHSCN, GuHCl, KCl, KF, KGlu and K2SO4 are predicted using Eq. 10 and 11 from the areas of hydrocarbon and amide surface in ΔASAmax (Fig 4A) and KP values quantifying the favorable or unfavorable interactions of these salts with these surfaces (Fig 4B)18, 28. In making these predictions, we assume that salt interactions with other protein groups for which no model compound data is available (e.g hydroxyl and carboxylate O, cationic N, which together are only 9% of ΔASAmax) are insignificant (collective Kp ≈ 1), making no contribution to the r-value. Neglecting these groups, the ΔASAmax of unfolding NTL9 (see Fig 4A, lower panel) is 3944 Å2 and its composition is 73% hydrocarbon, 27% amide.
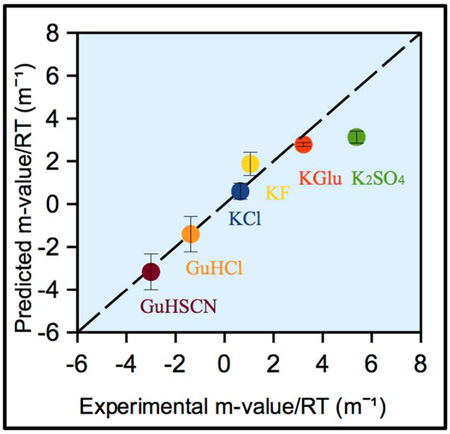
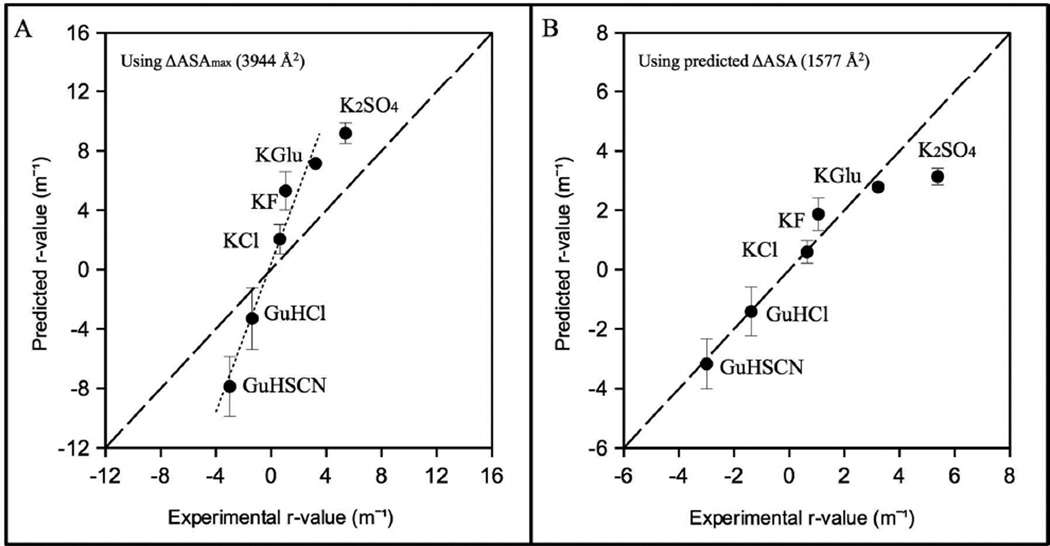
Predicted and observed r-values for all salts are compared in Fig 5A, which shows that the rank order of predicted and observed r-values agree well for all salts, but magnitudes of r-values predicted using ΔASAmax greatly exceed observed r-values. With the exception of K2SO4, magnitudes of predicted r-values of all salts exceed observed r-values by a factor of ~ 2.5: r-valuepredicted = 2.5 r-valueobserved + 0.4. Hence the predicted ΔASA of unfolding is only ~ 40% of ΔASAmax. The small non-zero intercept (0.4) indicates that amide groups make up a slightly larger fraction of the predicted ΔASA of unfolding than predicted from ΔASAmax, as shown in Table S1.
Fig 5.
Comparison of experimentally obtained and predicted Hofmeister salt effects on NTL9 unfolding (r-values) using (A) ΔASAmax (hydrocarbon and amide only; see text) and (B) best-fitted (predicted) ΔASA obtained by analysis of the best-fit (dotted) line in A (slope 2.5, intercept 0.4) for all salts except K2SO4. Predictions of GuH+ and K+ salt r-values, except KGlu, are made using KP values from reference 18; predictions for KGlu use KP values from reference 28.
To find the predicted composition and amount of ΔASA for unfolding NTL9 from the above information, the hydrocarbon : amide ratio of the ΔASA was adjusted by trial and error to obtain proportionality between predicted and observed r-values. This is accomplished for a composition of the ΔASA of 70% hydrocarbon and 30% amide, for which r-valuepredicted = 2.5 r-valueobserved. Hence the predicted ΔASA of unfolding is 1577 Å2 (40% of ΔASAmax). Part of the 2.5-fold difference between ΔASAmax and ΔASA arises because unfolding of the exterior α-helix occurs before the transition monitored by fluorescence21. Unfolding of this exterior helix is predicted to contribute ~10% of the ΔASA (i.e. a 1.1 fold difference). Hence most of the difference between ΔASA and ΔASAmax must arise from extensive residual structure in the unfolded form. This is in agreement with previous findings for single domain proteins in general32 and also specifically NTL933–35.
Predicted r-values for GuHSCN, GuHCl, KCl, KF and KGlu using ΔASA = 1577 Å2 and a composition of the ΔASA of 70% hydrocarbon and 30% amide agree very well with experimental r-values (Fig 5B). However, the experimental r-value for K2SO4 (5.38 m−1) exceeds the r-value predicted from ΔASA = 1577 Å2 (3.13 m−1) by ~1.7-fold. It is unlikely that the ΔASA of unfolding NTL9 in K2SO4 is 1.7 times larger than in the other salts. A more likely interpretation is that sulfate ion binds weakly to a site on folded NTL9 (estimated binding constant Ksite = 2.65 m−1; see supplemental) which is absent on unfolded NTL9. (This could be a RNA phosphate binding site36.) Over the K2SO4 concentration range investigated, weak binding of sulfate to folded NTL9 would be difficult to distinguish from preferential exclusion of K2SO4 from the ΔASA of unfolding NTL9.
Unique Features of the Stabilization of NTL9 by Potassium Glutamate
As summarized in Fig 4B, KGlu differs from other salts investigated here because its interactions with amide groups are predicted from model compound data to be net unfavorable, while other salts investigated (both stabilizing and destabilizing) are predicted to have net favorable interactions with amide groups. All stabilizing K+ salts investigated, including KGlu, are predicted to have net unfavorable interactions with hydrocarbon groups, while the destabilizing GuH+ salts investigated have favorable hydrocarbon interactions. KGlu – hydrocarbon interactions are predicted to be moderately unfavorable, ranking between KCl and KF.
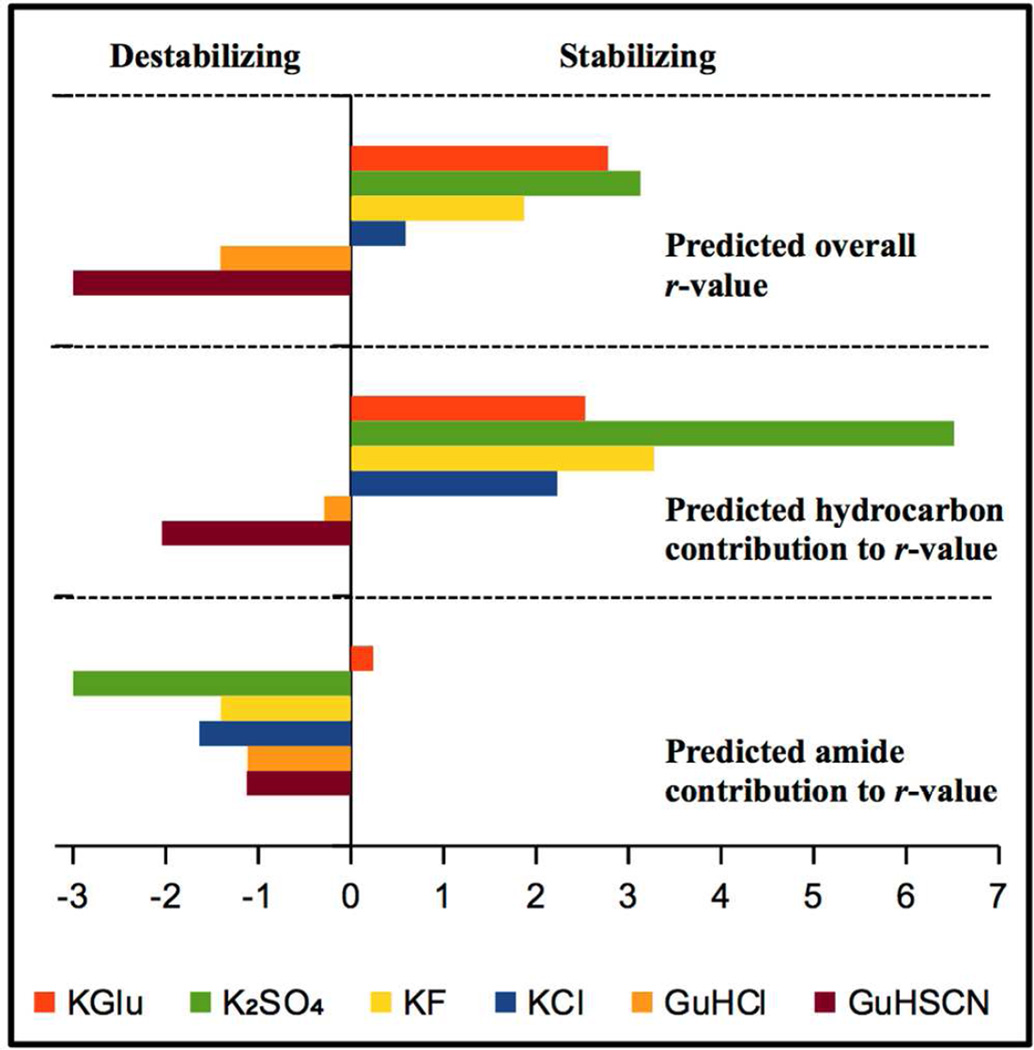
Predicted NTL9 unfolding r-values and the contributions to these r-values from hydrocarbon and amide ΔASA are summarized in Figure 6. The prediction for K2SO4 does not include the proposed sulfate binding to folded NTL9.
Fig 6.
Upper panel: predicted NTL9 unfolding r-values for KGlu and other Hofmeister salts. Lower panels: contributions to these unfolding r-values from salt interactions with hydrocarbon and amide surface area exposed on unfolding. Predictions use Eqs. S2–S5 with KP values from Fig 4B18, 28 and ΔASA = 1577A2 (Fig. 4A, lower panel; 70% hydrocarbon, 30% amide).
Figure 6 shows how the different interactions of KGlu and other stabilizing and destabilizing salts with hydrocarbon and amide groups translate into differences in predicted NTL9 unfolding r-values and generate the ranking of KGlu relative to other Hofmeister salts as a stabilizer of this protein. The top panel shows that, overall, KGlu is predicted to be a more effective NTL9 stabilizer than KF, as observed experimentally (Fig. 5). Indeed, in terms of preferential interactions with hydrocarbon and amide ΔASA, KGlu is predicted to be only slightly less effective than K2SO4.
The lower panels of Fig. 6 show that KGlu is particularly effective at stabilizing NTL9 because of the net unfavorable interactions (Fig 4B) of its ions with both amide groups and hydrocarbon groups. These panels of Fig 6 show that K2SO4, KF and KCl all stabilize NTL9 because the stabilizing contributions to their r-values from their unfavorable interactions with hydrocarbon groups outweigh the destabilizing contributions from their favorable interactions with amide groups. KGlu stabilizes NTL9 more than KF does only because the contribution to the salt r-value from salt-amide interactions is much more unfavorable for KGlu than for KF. Reasoning only from hydrocarbon contributions, one would predict KGlu would be comparable to KCl in stabilizing power instead of ranking between KF and K2SO4.
The destabilizing salt GuHCl is the mirror image of KGlu; GuHCl destabilizes NTL9 almost entirely because of the favorable contribution to its r-value from interactions with amide groups18–20. GuHSCN is much more destabilizing than GuHCl because the contribution to its r-value from hydrocarbon interactions is much more favorable, while the contribution to the r-value from amide interactions is similarly favorable for both GuH+ salts.
In general, the same Hofmeister series order of salts or salt ions is observed for all protein processes that expose protein surface to water (dissolving, unfolding, dissociation of protein- protein complexes)14, 15. This Hofmeister series order is determined by the order of interactions of the salts or salt ions with hydrocarbon surface, which in general represents the majority (50–75%) of the protein surface exposed in the process20, 37. Comparison of upper and middle panels of Fig. 6 shows the order of overall r-values for effects of GuHSCN, GuHCl, KCl, KF and K2SO4 on NTL9 unfolding (shown in the top panel) is the same as the order of hydrocarbon contributions to those r-values (shown in the middle panel). Fig 6 shows that the KGlu r-value does not fit this pattern; its unusually unfavorable contribution from KGlu – amide interactions, as compared with other K+ and GuH+ salts, shifts it to the stabilizing end of the r-value series (top panel of Fig. 6) and out of order with its place in the hydrocarbon r-value series (middle panel of Fig. 6). Hence the strong stabilizer KGlu is an exception to the normal pattern of Hofmeister salt effects.
Because K+ interacts very unfavorably with hydrocarbon groups, being almost completely excluded from both aliphatic and aromatic hydrocarbon groups (KP = 0.1)18, KP values for K+ salt – hydrocarbon interactions can be interpreted to obtain KP values for Glu− to compare with the other anions of stabilizing salts28. This comparison shows that while Cl−, F− and especially SO42− are excluded from all hydrocarbon groups, Glu− anion is somewhat accumulated. Likewise, from the observation that K+ interacts very favorably with (i.e. is strongly accumulated at) amide groups, it follows that Glu− anion interacts very unfavorably with (i.e. is very strongly excluded from) amide groups28. Hence the molecular basis for the action of KGlu as a strong protein stabilizer differs from that of other strongly stabilizing inorganic salts like KF and K2SO4.
We previously quantified and discussed why GuHCl is a protein-destabilizing salt while KCl is a stabilizer18, 19. Coulombic effects of the two salts are similar, and the two cations interact similarly and quite favorably with amide groups (KP ~ 2.5). The difference is in the interaction of the cations with hydrocarbon groups: K+ interacts highly unfavorably with hydrocarbon (KP ~ 0.1), as discussed above, while the interaction of GuH+ with hydrocarbon, while much more favorable than K+, is not favorable but rather neutral to weakly unfavorable (KP ~ 0.7 for GuH+ – aliphatic C and KP ~ 1 for GuH+ – aromatic C). These weakly unfavorable interactions nonetheless place GuH+ (the cationic group of arginine) at the favorable end of the cation-hydrocarbon series. The reason that GuH+ is a protein-destabilizer and K+ is a stabilizer is that GuH+ interacts favorably with amide groups exposed in unfolding and only weakly unfavorably with hydrocarbon groups, so the favorable GuH+-amide interaction is dominant. K+ also interacts favorably with amide groups but interacts very unfavorably with hydrocarbon groups; for the surface exposed in unfolding the K+-hydrocarbon interaction is dominant. For Cl− as the salt anion (GuHCl vs KCl) these cation interactions determine the effect of the salt because interactions of Cl− with both hydrocarbon and amide groups are relatively weak. For other anions like SCN− and SO42−, which have stronger interactions with hydrocarbon groups than Cl− does (favorable for SCN−, unfavorable for SO42−), the anion can either reinforce (for GuHSCN, K2SO4) or compensate (for KSCN, (GuH)2SO4) the effect of the cation.
Supplementary Material
Acknowledgments
We thank Bowu Luan for assistance with preparation of NTL9. This research was supported by National Institutes of Health Grant GM047022 (to M. T. R.) and National Science Foundation Grant MCB-1330259 (to D. P. R.).
ABBREVIATIONS
- KGlu
potassium glutamate
- NTL9
n-terminal domain of ribosomal L9 protein
- ASA
water accessible surface area
- KP
partition coefficient
- NB
NTL9 buffer
- Y25
tyrosine residue number 25
Footnotes
ASSOCIATED CONTENT
- Details for KP and r-value calculation for all salts for NTL9 unfolding, results for ΔASA prediction, data for GuHCl unfolding and all supporting figures (Figs. S1 – S5) and tables (Tables S1 – S3).
REFERENCES
- 1.Dinnbier U, Limpinsel E, Schmid R, Bakker EP. Transient accumulation of potassium glutamate and its replacement by trehalose during adaptation of growing cells of Escherichia coli K-12 to elevated sodium chloride concentrations. Arch. Microbiol. 1988;150(4):348–357. doi: 10.1007/BF00408306. [DOI] [PubMed] [Google Scholar]
- 2.Cayley DS, Guttman HJ, Record MT., Jr Biophysical characterization of changes in amounts and activity of Escherichia coli cell and compartment water and turgor pressure in response to osmotic stress. Biophysical J. 2000;78:1748–1764. doi: 10.1016/s0006-3495(00)76726-9. [DOI] [PMC free article] [PubMed] [Google Scholar]
- 3.Arakawa T, Timasheff SN. The mechanism of action of Na glutamate, lysine HCl, and piperazine-N, N'-bis(2-ethanesulfonic acid) in the stabilization of tubulin and microtubule formation. J. Biol. Chem. 1984;259(8):4979–4986. [PubMed] [Google Scholar]
- 4.Leirmo S, Harrison C, Cayley DS, Burgess RR, Record MT., Jr Replacement of potassium chloride by potassium glutamate dramatically enhances protein – DNA interactions in vitro. Biochemistry. 1987;26:2095–2101. doi: 10.1021/bi00382a006. [DOI] [PubMed] [Google Scholar]
- 5.Lohman TM, Chao K, Green JM, Sage S, Runyon GT. Large-scale purification and characterization of Escherichia coli rep gene product. J. Biol. Chem. 1989;264(17):10139–10147. [PubMed] [Google Scholar]
- 6.Deredge DJ, Baker JT, Datta K, LiCata VJ. The glutamate effect on DNA binding by Pol I DNA polymerases: Osmotic stress and the effective reversal of salt linkage. J. Mol. Biol. 2010;401:223–238. doi: 10.1016/j.jmb.2010.06.009. [DOI] [PubMed] [Google Scholar]
- 7.Menetski JP, Varghese A, Kowalczykowski SC. The physical and enzymatic properties of Escherichia coli recA protein display anion-specific inhibition. J. Biol. Chem. 1992;267(15):10400–10404. [PubMed] [Google Scholar]
- 8.Ha J-H, Capp MW, Hohenwalter MD, Baskerville M, Record MT., Jr Thermodynamic stoichiometries of participation of water, cations and anions in specific and non – specific binding of lac repressor to DNA. Possible thermodynamic origins of the “glutamate effect” on protein – DNA interactions. J. Mol. Biol. 1992;228:252–264. doi: 10.1016/0022-2836(92)90504-d. [DOI] [PubMed] [Google Scholar]
- 9.Kontur WS, Capp MW, Gries TJ, Saecker RM, Record MT., Jr Probing DNA binding, DNA opening, and assembly of a downstream clamp/jaw in Escherichia coli RNA polymerase – λPR promoter complexes using salt and the physiological anion glutamate. Biochemistry. 2010;49:4361–4373. doi: 10.1021/bi100092a. [DOI] [PMC free article] [PubMed] [Google Scholar]
- 10.Vander Meulen KA, Saecker RM, Record MT., Jr Formation of a wrapped DNA – protein interface: Experimental characterization and analysis of the large contributions of ions and water to the thermodynamics of binding of IHF to H' DNA. J. Mol. Biol. 2008;377:9–27. doi: 10.1016/j.jmb.2007.11.104. [DOI] [PMC free article] [PubMed] [Google Scholar]
- 11.Hofmeister F. Zur lehre von der wirkung der salze. Arch. Exp. Pathol. Pharmakol. 1888;24:247–260. [Google Scholar]
- 12.Kunz W, Henle J, Ninham BW. 'Zur lehre von der wirkung der salze' (about the science of the effect of salts): Franz Hofmeister's historical papers. Curr. Opin. Colloid Interface Sci. 2004;9:19–37. [Google Scholar]
- 13.von Hippel PH, Schleich T. Ion effects on the solution structure of biological macromolecules. Accounts of Chem. Res. 1969;2(9):257–265. [Google Scholar]
- 14.Record MT, Jr, Guinn E, Pegram L, Capp M. Introductory lecture: interpreting and predicting Hofmeister salt ion and solute effects on biopolymer and model processes using the solute partitioning model. Faraday Disc. 2012;160:9–44. doi: 10.1039/c2fd20128c. [DOI] [PMC free article] [PubMed] [Google Scholar]
- 15.Baldwin RL. How Hofmeister ion interactions affect protein stability. Biophysical J. 1996;71:2056–2063. doi: 10.1016/S0006-3495(96)79404-3. [DOI] [PMC free article] [PubMed] [Google Scholar]
- 16.Nandi PK, Robinson DR. Effects of salts on the free energies of nonpolar groups in model peptides. J. Am. Chem. Soc. 1972;94(4):1308–1315. doi: 10.1021/ja00759a043. [DOI] [PubMed] [Google Scholar]
- 17.Zhang Y, Cremer PS. The inverse and direct Hofmeister series for lysozyme. Proc. Natl. Assoc. Sci. 2009;106(36):15249–15253. doi: 10.1073/pnas.0907616106. [DOI] [PMC free article] [PubMed] [Google Scholar]
- 18.Pegram LM, Record MT., Jr Thermodynamic origin of Hofmeister effects. J. Phys. Chem. B. 2008;112:9428–9436. doi: 10.1021/jp800816a. [DOI] [PMC free article] [PubMed] [Google Scholar]
- 19.Pegram LM, Wendorff T, Erdmann R, Shkel I, Bellisimo D, Felitsky DJ, Record MT., Jr Why Hofmeister effects of many salts favor protein folding but not DNA helix formation. Proc. Natl. Assoc. Sci. 2010;107(17):7716–7721. doi: 10.1073/pnas.0913376107. [DOI] [PMC free article] [PubMed] [Google Scholar]
- 20.Guinn EJ, Kontur WS, Tsodikov OV, Shkel I, Record MT., Jr Probing the protein – folding mechanism using denaturant and temperature effects on rate constants. Proc. Nat. Assoc. Sci. 2013;110(42):16784–16789. doi: 10.1073/pnas.1311948110. [DOI] [PMC free article] [PubMed] [Google Scholar]
- 21.Kuhlman B, Boice JA, Fairman R, Raleigh DP. Structure and stability of the N-terminal domain of the ribosomal protein L9: Evidence for rapid two-state folding. Biochemistry. 1998;37:1025–1032. doi: 10.1021/bi972352x. [DOI] [PubMed] [Google Scholar]
- 22.Kuhlman B, Luisi DL, Evans PA, Raleigh DP. Global analysis of the effects of temperature and denaturant on the folding and unfolding kinetics of the N-terminal domain of the protein L9. J. Mol. Biol. 1998;284:1661–1670. doi: 10.1006/jmbi.1998.2246. [DOI] [PubMed] [Google Scholar]
- 23.Igor Pro, WaveMetrics. Lake Oswego, OR, USA: [Google Scholar]
- 24.Berman HM, Westbrook J, Feng Z, Gilliland G, Bhat T, Weissig H, Shindyalov IN, Bourne PE. The protein data bank. Nucleic Acids Research. 2000;28:235–242. doi: 10.1093/nar/28.1.235. [DOI] [PMC free article] [PubMed] [Google Scholar]
- 25.Luisi DL, Kuhlman B, Sideras K, Evans PA, Raleigh DP. Effects of varying the local propensity to form secondary structure on the stability and folding kinetics of a rapid folding mixed alpha/beta protein: characterization of a truncation mutant of the N-terminal domain of the ribosomal protein L9. J. Mol. Biol. 1999;289(1):167–174. doi: 10.1006/jmbi.1999.2742. [DOI] [PubMed] [Google Scholar]
- 26.Tsodikov OV, Record MT, Jr, Sergeev YV. Novel computer program for fast exact calculation of accessible and molecular surface areas and average surface curvature. J. Comp. Chem. 2002;23(6):600–609. doi: 10.1002/jcc.10061. [DOI] [PubMed] [Google Scholar]
- 27.Richards FM. Areas, volumes, packing, and protein structure. Annu. Rev. Biophys. Bioeng. 1977;6:151–176. doi: 10.1146/annurev.bb.06.060177.001055. [DOI] [PubMed] [Google Scholar]
- 28.Cheng X, Guinn EJ, Buechel E, Wong R, Sengupta R, Record MT., Jr Interaction of KGlu with amide and hydrocarbon groups: why KGlu is a protein stabilizer. (in preparation). [Google Scholar]
- 29.Version 1.5.0.4. Schrodinger, LLC: The PyMol Molecular Graphics System. [Google Scholar]
- 30.Emsley P, Lohkamp B, Scott WG, Coetan K. Features and development of Coot. Acta Crystallogr. D – Biol. Crystallogr. 2010;66:486–501. doi: 10.1107/S0907444910007493. [DOI] [PMC free article] [PubMed] [Google Scholar]
- 31.Guinn EJ, Pegram LM, Capp MW, Pollock MN, Record MT., Jr Quantifying why urea is a protein denaturant, whereas glycine betaine is a protein stabilizer. Proc. Natl. Assoc. Sci. 2011;108(41):16932–16937. doi: 10.1073/pnas.1109372108. [DOI] [PMC free article] [PubMed] [Google Scholar]
- 32.Sosnick TR, Barrick D. The folding of single domain proteins – have we reached a consensus? Curr. Opin. Struct. Biol. 2011;21(1):12–24. doi: 10.1016/j.sbi.2010.11.002. [DOI] [PMC free article] [PubMed] [Google Scholar]
- 33.Cho J-H, Sato S, Raleigh DP. Thermodynamics and kinetics of non-native interactions in protein folding: A single point mutant significantly stabilizes the N-terminal domain of L9 by modulating non-native interactions in the denatured state. J. Mol. Biol. 2004;338:827–837. doi: 10.1016/j.jmb.2004.02.073. [DOI] [PubMed] [Google Scholar]
- 34.Anil B, Li Y, Cho J-H, Raleigh DP. The unfolded state of NTL9 is compact in the absence of denaturant. Biochemistry. 2006;45:10110–10116. doi: 10.1021/bi060636o. [DOI] [PubMed] [Google Scholar]
- 35.Meng W, Lyle N, Luan B, Raleigh DP, Pappu RV. Experiments and simulations show how long-range contacts can form in expanded unfolded proteins with negligible secondary structure. Proc. Nat. Assoc. Sci. 2013;110(6):2123–2128. doi: 10.1073/pnas.1216979110. [DOI] [PMC free article] [PubMed] [Google Scholar]
- 36.Hoffman DW, Davies C, Gerchman SE, Kycia JH, Porter SJ, White SW, Ramakrishnan V. Crystal structure of prokaryotic ribosomal protein L9: A bi-lobed RNA – binding protein. The EMBO Journal. 1994;13(1):205–212. doi: 10.1002/j.1460-2075.1994.tb06250.x. [DOI] [PMC free article] [PubMed] [Google Scholar]
- 37.Sosnick TR, Baxa MC. Revealing what gets buried first in protein folding. Proc. Nat. Assoc. Sci. 2013;110(42):16704–16705. doi: 10.1073/pnas.1316158110. [DOI] [PMC free article] [PubMed] [Google Scholar]
Associated Data
This section collects any data citations, data availability statements, or supplementary materials included in this article.


