

Summary
Behcet's disease (BD) is a systemic inflammatory disease with a still unclear pathogenesis. Although several inflammatory molecules have been studied, current biomarkers are largely insensitive in BD and unable to predict disease progression and response to treatment. Our primary aim was to explore serum levels of soluble CD40 L (sCD40L), soluble intracellular adhesion molecule (sICAM‐1), monocyte chemoattractant protein‐1 (MCP‐1), myeloperoxidase (MPO), leptin, resistin, osteoprotegerin (OPG), soluble type 1 tumour necrosis factor receptor (sTNFR), interleukin (IL)−6 and serum amyloid A (SAA) serum concentration in a cohort of 27 BD patients. The secondary aim was to evaluate potential correlations between the putative circulating biomarkers, demographic profile of patients, the status of disease activity, the specific organ involvement at the time of sample collection and different therapeutic regimens. Serum concentrations of sTNFR (P = 0·008), leptin (P = 0·0011), sCD40L (P < 0·0001) and IL‐6 (P = 0·0154) were significantly higher in BD patients than in HC, while no difference was found in MCP‐1, MPO and resistin serum levels. Moreover, we observed significantly higher sTNFR serum concentrations in BD patients presenting inactive disease than HC (P = 0·0108). A correlation between sTNFR and age was also found, with higher levels in patients over 40 years than HC (P = 0·0329). Although further research is warranted to elucidate the role of circulating biomarkers, some of that may contribute to the understanding of the physiopathology processes underlying BD activity and damage as well as to provide useful tools for prognostic purposes and a personalized treatment approach.
Keywords: Behçet's disease, cytokines, metabolism, leptin, sTNFR
Introduction
Behçet's disease (BD) is a systemic inflammatory disease, characterized by recurrent orogenital ulcers, ocular inflammation and skin manifestations; articular, vascular, gastroenteric and neurological involvement may also occur 1; several data suggest that BD represents a chronic systemic inflammatory syndrome at the crossroad between autoimmune and autoinflammatory diseases 2, 3. It is well known that there are differences in the disease course, severity and organ involvement between patients, depending on the age at presentation and sex; thus, this crucial issue may justify the growing research aimed at exploring specific putative biomarkers useful at monitoring disease activity and response to therapy 4, 5. Although disease pathogenesis is still unclear, both innate and adaptive immunity have been shown to play a pivotal role 6, 7; specifically, the current hypothesis for the pathogenesis of BD suggests that genetic factors induce a general hyperactivity of the immune system, and bacterial or viral infection stimulates the expression of heat shock proteins and major histocompatibility complex (MHC) class I chain‐related molecules A. As a consequence, this putative process could induce the over‐expression of endothelial adhesion molecules [intercellular adhesion molecule‐1 (ICAM‐1 and vascular cell adhesion molecule‐1 VCAM‐1)], activation of coagulation and stimulation of T cells by secreting interleukin (IL)‐6, IL‐8, and monocyte chemoattractant protein‐1 (MCP‐1), among others, essentially perpetuating cytokine production that leads eventually to tissue damage and vasculitis 8. Moreover, recently, the role of serum amyloid A (SAA) levels as a potential marker of disease activity in BD patients has been explored, and it has been reported that the occurrence of oral aphthosis, neurological and ocular disease are associated significantly with high serum levels of SAA 9. Recent findings have expanded our knowledge of how aspects of cellular metabolism can modulate several immune responses, thereby controlling the fine balance between inflammation and immune tolerance 10. The metabolic status of immune cells influences their function during homeostasis and inflammation 11. Alterations of this delicate signalling network could lead to the onset of chronic inflammation and the break of immune tolerance. In this context, experimental data have suggested that the pathogenesis of several immune‐mediated disorders might involve factors, hormones and neural mediators at the crossroad between metabolism and immunity 12.
Even though numerous data have suggested the involvement of several molecules in the immune response process of BD, so far it is still unclear whether specific molecules may serve as markers of disease activity, severity and/or long‐term outcome. Therefore, the present study was aimed at exploring serum levels of specific circulating biomarkers of inflammation in a cohort of patients with BD and studying theirs potential correlations with disease activity and therapy.
Materials and methods
Patients and healthy controls
Fifty‐seven serum samples were collected routinely from 27 BD patients (12 males, 15 females, mean age 45·7 ± 13·5 years) who met the International Study Group (ISG) classification criteria for BD 13 and from 35 healthy volunteers; the samples were collected during routine follow‐up visits.
The primary aim of the study was to explore serum levels of a core set of circulating biomarkers of inflammation in a cohort of patients with BD; the secondary aims were to: (1) study any potential correlation between the putative circulating biomarkers and the demographic profile of patients enrolled; and (2) evaluate any potential correlation with the status of disease activity, with the specific organ involvement at the time of sample collection and with different therapeutic regimens.
Patients were included into the active BD group if they had at least two of the following BD‐related clinical findings: uveitis, oral and/or genital aphthosis, cutaneous disease, central nervous system and/or vascular and/or gastrointestinal involvement. Disease activity was evaluated in according to the Behçet's Disease Current Activity Form (BDCAF) 14. We considered prednisone and methylprednisolone at 0·1–0·5 mg/kg/day as low‐corticosteroid dosages. Higher dosages were regarded as high‐corticosteroid dosages. Table 1 summarizes the clinical and demographic characteristics of BD patients and samples collected.
Table 1.
Demographic and clinical data of Behçet's disease (BD) patients
| BD patients | BD serum samples | |
|---|---|---|
| Males/females | 12/15 | 27/30 |
| Age (mean ± s.d.), years | 45·7 ± 13·54 | 51·19 ± 30·26 |
| Disease onset (mean ± s.d.), years | 32·55 ± 14·35 | 34·15 ± 13·48 |
| Disease duration (mean ± s.d.), years | 13·59 ± 12·67 | 13·85 ± 12·34 |
| HLA‐B51 positivity; n (%) | 17 (62·96) | 40 (70·17) |
| Clinical manifestations (%) | ||
| Oral/genital aphtosis | 23 (85·18) | 39 (68·42) |
| Skin manifestations | 10 (37·03) | 12 (21·05) |
| Uveitis | 11 (40·74) | 20 (35·08) |
| SNC involvement | 18 (66·66) | 26 (45·61) |
| Vascular involvement | 2 (7·40) | 4 (07·01) |
| Gastrointestinal manifestations | 4 (14·81) | 4 (07·01) |
| Musculoskeletal involvement | 20 (74·07) | 27 (47·36) |
The end‐points of the study were: (1) to determine serum levels of soluble CD40 L (sCD40L), soluble ICAM‐1 (sICAM‐1), MCP‐1, myeloperoxidase (MPO), leptin, resistin, osteoprotegerin (OPG), soluble type 1 tumour necrosis factor receptor (sTNFR), IL‐6 and SAA serum concentration; and (2) to correlate sCD40L, sICAM‐1, MCP‐1, MPO, leptin, resistin, OPG, sTNFR and IL‐6, erithrocyte sedimentation rate (ESR), C‐reactive protein (CRP), SAA and homocysteine serum concentration with the status of disease activity, specific organ involvement and therapeutic agents [i.e. categories: no therapy, traditional disease‐modifying anti‐rheumatic drugs (DMARDs), biological drugs].
Written informed consent was obtained from all patients and healthy volunteers; moreover, the study protocol was reviewed and approved by the local Ethical Committee. Demographic and clinical information was obtained through the consultation of the data set containing all the information regarding epidemiological, clinical and therapeutic data of the cohort studied.
Laboratory analysis
The main biochemical parameters, inflammatory and anti‐inflammatory markers and adipokines were evaluated in sera from Behçet and healthy control (HC) subjects. In particular, sCD40 L, sICAM‐1, MCP‐1, MPO, leptin, resistin, OPG, sTNFR and IL‐6 were analysed using the bead‐based analyte detection system Human Obesity 9plex kit (Bender Med Systems Inc., Burlingame, CA, USA). Preparation of the samples was performed according to the manufacturer's instructions. A 96‐well plate format was used, including two eight‐point standard curves (inclusive blank). Concentrations of analytes were proportional to fluorescent intensity measured on a BD fluorescence activated cell sorter (FACS)Canto (BD Biosciences, San Jose, CA, USA). Data were acquired using a BD FACSCanto (BD Biosciences) and analysed using FlowCytomixPro 2·2 Software (Bender Med Systems Inc.).
SAA serum concentration was determined with a commercial solid‐phase sandwich enzyme linked‐immunosorbent assay (ELISA) (human SAA; BioSource Europe S.A., Nivelles, Belgium), according to the manufacturer's protocol.
Statistical analysis
Statistical analyses were performed using GraphPad Prism version 5 software. Results were expressed as mean ± standard deviation. Analysis of variance (anova) was used to analyse differences between groups. We used anova or the Kruskal–Wallis test to identify statistical differences. For variables that reached global significance, pairwise comparisons were performed by the Mann–Whitney U‐test. Significance was defined as P < 0·05. Correlations were calculated using Spearman's correlation (two‐tailed P‐value), as well as Pearson's correlation test when required.
Results
Circulating immunometabolic biomarkers in BD patients and relation to disease activity
Serum levels of sCD40L, sTNFR, MCP‐1, MPO, IL‐6, OPG, resistin and leptin were analysed in 57 samples from 27 BD patients and 36 HC. ESR, CRP, SAA and homocysteine serum levels were evaluated only in BD patients. At the time of sera collection, the median BDCAF was 2 (range = 0–6). Specifically, 21 of 57 (36·84%) serum samples were collected from patients with active disease. Detectable levels of OPG were found in a few samples, both in BD and in HC; for this reason, this molecule was not included in the statistical analysis. Correlations among patients were identified between IL‐6 and sICAM (r = 0·873, P = 0·001) and between SAA with CRP serum levels (r = 0·515, P < 0·0001) based on the Spearman's rho test (data not shown). Table 2 shows adipocytokine serum levels in HC and BD patients. Patients were also divided into subgroups according to the disease activity and treatment approaches.
Table 2.
Serum levels of circulating immunometabolic biomarkers in healthy control (HC) subjects and Behçet's disease (BD) patients; BD patients were also divided into subgroups according to active/inactive disease and different therapeutic approaches.
| HC | BD | Active BD | Inactive BD | No therapy | DMARDs | Biologicals | |
|---|---|---|---|---|---|---|---|
| sCD40L (ng/ml) | 2016·16 ± 888·35 | 3445·78 ± 967·09 | 3354·76 ± 927·24 | 3489·88 ± 998·63 | 3544·01 ± 800·74 | 3735·15 ± 847·03 | 3184·54 ± 1112·1 |
| sTNFR (ng/ml) | 1·48 ± 0·60 | 2·58 ± 3·00 | 2·48 ± 2·67 | 2·64 ± 3·21 | 1·74 ± 0·81 | 1·48 ± 0·45 | 3·87 ± 4·27 |
| MCP‐1 (ng/ml) | 458·01 ± 2683·95 | 692·76 ± 735·15 | 574·69 ± 119·56 | 760·63 ± 916·66 | 515·31 ± 123·34 | 676·22 ± 143·22 | 851·18 ± 1140·20 |
| MPO (ng/ml) | 260·86 ± 85·54 | 241·69 ± 64·24 | 252·68 ± 64·48 | 235·28 ± 64·13 | 527·18 ± 40·15 | 245·54 ± 59·15 | 237·47 ± 75·01 |
| sICAM (ng/ml) | 347·34 ± 124·38 | 389·31 ± 175·09 | 328·28 ± 99·16 | 424·91 ± 199·73 | 410·31 ± 181·36 | 388·98 ± 138·65 | 379·94 ± 198·16 |
| IL‐6 (ng/ml) | 119·64 ± 107·06 | 412·16 ± 1276·75 | DNE | 453·26 ± 1404·16 | DNE | 11·98 ± 11·46 | 747·40 ± 1813·66 |
| Resistin (ng/ml) | 12631·34 ± 7376·51 | 9665·37 ± 4126·36 | 10950·16 ± 4443·84 | 8915·23 ± 3793·47 | 9323·66 ± 2537·79 | 10932·45 ± 4432·67 | 9607·5 ± 4863·72 |
| Leptin (ng/ml) | 6·38 ± 3·54 | 16·43 ± 13·63 | 15·25 ± 14·02 | 17·11 ± 18·13 | 19·37 ± 19·08 | 6·50 ± 5·99 | 20·28 ± 17·34 |
| ESR (mm/h) | – | 22·22 ± 15·87 | 29·00 ± 16·91 | 17·79 ± 13·69 | 20·21 ± 12·55 | 12·75 ± 10·46 | 27·85 ± 17·67 |
| CRP (mg/dl) | – | 0·46 ± 0·92 | 0·86 ± 1·40 | 0·21 ± 0·24 | 0·66 ± 1·00 | 0·23 ± 0·36 | 0·46 ± 1·10 |
| SAA (mg/l) | – | 71·57 ± 136·12 | 80·95 ± 125·87 | 66·61 ± 142·71 | 59·47 ± 121·67 | 60·19 ± 78·95 | 92·05 ± 173·16 |
| Homocysteine (μm/l) | – | 15·24 ± 7·38 | 16·39 ± 9·83 | 14·57 ± 5·63 | 12·8 ± 3·64 | 17·48 ± 6·48 | 17·36 ± 10·43 |
HLA = human leucocyte antigen; SNC = sistema nervioso central (central nervous system); s.d. = standard deviation.
CRP = C‐reactive protein; ESR = erythrocyte sedimentation rate; DND = data not detectable; IL =interleukin; SAA = serum amyloid A; MCP‐1 = monocyte chemoattractant protein‐1; MPO = myeloperoxidase; sTNFR = soluble type 1 tumour necrosis factor receptor; sICAM‐1 = soluble intracellular adhesion molecule 1; sCD40L = soluble CD40L.
HC = healthy controls; CNS = central nervous system; PCR = polymerase chain reaction; ESR = erythrocyte sedimentation rate; SAA = serum amyloid A; CRP = C‐reactive protein; sTNFR = soluble type 1 tumour necrosis factor receptor.
With regard to disease activity, we found that ESR showed a statistically significant difference between active and inactive BD patients (P = 0·0226) (Fig. 1). However, CRP and SAA serum levels showed no significant difference (data not shown). A statistical difference was identified in sTNFR levels between total BD patients and HC (P = 0·008) (Fig. 2) as well as between inactive patients and HC (P = 0·0108) (Fig. 3), while no difference was highlighted between active and inactive patients (P = 0·5086) and between active patients and HC (P = 0·0723) (Fig. 3). A significant difference was identified in leptin serum levels between BD patients and HC (P = 0·0011) (Fig. 2); when patients were subdivided into active and inactive disease, leptin serum levels were significantly higher in both groups compared to HC (P = 0·0279 and P = 0·0129, respectively) (Fig. 3). By contrast, no significant difference was found in serum leptin level between active and inactive disease patients (P = 0·9863) (Fig. 3). Similarly, sCD40L levels were significantly higher in BD patients than in HC both when patients were studied as a whole (P = 0·0145) (Fig. 2) and when they were divided into active and inactive disease patients (P < 0·0001 in both cases); conversely, no difference was highlighted according to disease activity (P = 0·9623) (Fig. 3). With regard to IL‐6 serum concentration, BD patients showed significantly higher levels than HC (P = 0·0154) (Fig. 2). Table 3 summarizes statistically significant differences of circulating biomarkers according to the presence/absence of any clinical BD‐related clinical manifestation.
Figure 1.
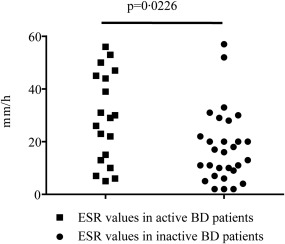
Erythrocyte sedimentation rate (ESR) values in Behçet's disease (BD) patients with active (n = 29) and inactive (n =19) disease. Comparison was performed by the Mann–Whitney U‐test; n = number of samples.
Figure 2.
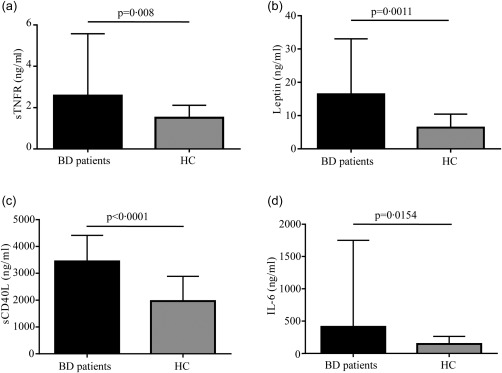
Serum levels of adipocytokines in Behçet's disease (BD) patients and healthy controls (HC). Serum levels of soluble type 1 tumour necrosis factor receptor (sTNFR), leptin, soluble CD40L (sCD40L) and interleukin (IL)‐6 were detected in BD patients (n = 57) and HC (n = 33) samples. Pairwise comparisons were performed by the Mann–Whitney U‐test; n = number of samples.
Figure 3.
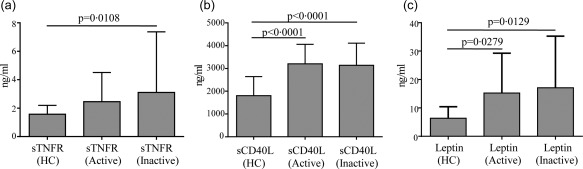
Adipocytokine serum levels according to disease activity. Serum levels of soluble type 1 tumour necrosis factor receptor (sTNFR), soluble CD40L (sCD40L) and leptin in Behçet's disease (BD) patients with active (n = 29) or inactive disease (n = 24) compared with healthy controls (HC) (n = 33). Comparisons of baseline data among the three groups were performed using the Kruskal–Wallis test for sTNFR and leptin serum levels and using analysis of variance (anova) for sCD40L circulating levels. Pairwise comparisons were performed by the Mann–Whitney U‐test in all cases; n = number of samples.
Table 3.
Inflammatory biomarkers in Behçet's disease (BD) patients with (+) or without (–) BD‐related clinical variables and healthy controls (HC).
| Examined clinical variable | Patients (+) versus patients (–) (P‐value) | Patients (+) versus HC (P‐value) | Patients (–) versus HC (P‐value) |
|---|---|---|---|
| Skin | SAA (0·0291) | sTNFR (0·0158) | Leptin (0·0011)sTNFR (0·0429) |
| Mucosal | PCR (0·0078)sICAM‐1 (0·0173) |
sTNFR (0·0099) Leptin (0·0003) |
IL‐6 (0·019) |
| Musculoskeletal | – | Resistin (0·0256) |
sTNFR (0·0023) Leptin (0·0008) MPO (0·0195) |
| CNS | – | Leptin (0·0052) |
sTNFR (0·0028) Leptin (0·0045) |
| Uveitis | ESR (0·0404) | sTNFR (0·003) | Leptin (0·0167) |
| Vascular | – | – |
sTNFR (0·0052) Leptin (0·0007) |
| SAA | Leptin (0·0063) |
sTNFR (0·0005) Leptin (<0·0001) |
– |
| CRP |
ESR (0·0114) SAA (0·0097)sTNFR (0·0036) |
sTNFR (<0·0001) Leptin (0·0258) |
Leptin (0·0028) |
| ESR |
PCR (0·0338) SAA (0·0343) |
sTNFR (0·0001) | Leptin (0·0015) |
Circulating immunometabolic biomarkers correlate with demographic, genetic and body mass index (BMI) profile in BD patients
Patients aged more than 40 years showed significantly higher sTNFR serum levels than HC (P = 0·0329), while no difference was found between patients aged up to 40 years and HC (P = 0·1253). Moreover, leptin serum levels were significantly higher in patients aged both more than 40 years and fewer than 40 years when compared to HC (P = 0·0165 and P = 0·0101, respectively). Regarding disease duration, leptin serum levels were higher in patients with more than 10 years of disease than in HC (P = 0·0007). Conversely, no difference was identified in leptin serum levels between patients with fewer than 10 years of disease duration and HC (P = 0·1664). Furthermore, homocysteine serum levels were higher in patients with a more than 10‐year disease duration than in patients with a lower disease duration (P = 0·0475).
Regarding gender distinction, leptin serum levels were significantly higher in female BD patients than in male patients (P = 0·0114) and HC (P < 0·0001). Similarly, IL‐6 serum levels were higher in female patients than in HC (P = 0·0173), but no statistical difference was found in IL‐6 serum levels between females and males (P = 0·4156). Conversely, sTNFR serum levels were higher in BD males than in HC (P = 0·0210), but no difference was found between females and HC (P = 0·1971) and between genders (P = 0·999).
Patients with human leucocyte antigen (HLA)‐B51 positivity showed higher IL‐6 serum levels than HC (P = 0·0087), but no difference was identified in IL‐6 serum levels between patients with and without the HLA‐B51 allele (P = 0·3524). Patients HLA‐B51‐negative had higher sTNFR and sICAM‐1 serum levels than controls (P = 0·0034 and P = 0·0037, respectively), while sICAM levels were significantly higher in HLA‐B51‐negative patients than in HLAB51‐positive patients (P = 0·0010). Moreover, leptin was significantly higher in patients both positive and negative for the HLA‐B51 allele than in HC (P = 0·0183 and P = 0·0303, respectively).
When patients were subdivided into three groups according to body mass index (BMI 17–25; BMI 25–30; BMI > 30), leptin was found to be significantly lower in patients with BMI 17–25 than in patients with BMI > 30 (P < 0·0001). Similarly, sTNFR levels were significantly lower in patients with BMI 17–25 than in patients with BMI 25–30 (P = 0·0182) and BMI > 30 (P < 0·0001). Conversely, MPO serum levels were significantly higher in patients with BMI 17–25 and BMI 25–30 than in HC (P = 0·0197 and P = 0·0007, respectively). Figure 4 shows some of the above significant differences in healthy controls (HC) and different BD subgroups according to demographic, genetic and weight distinctions.
Figure 4.
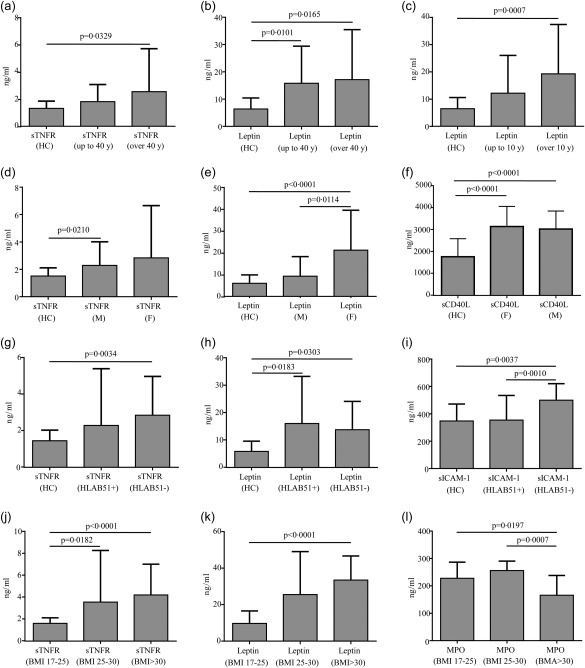
Serum levels of circulating adipocytokines according to age, disease duration, gender, genotype and body mass index (BMI) in Behçet's disease (BD) patients. Serum levels of soluble type 1 tumour necrosis factor receptor (sTNFR), leptin, soluble intracellular adhesion molecule 1 (sICAM‐1), soluble CD40L (sCD40L) and myeloperoxidase (MPO) in BD patients in according to the age (a,b), disease duration (c), gender (d–f), human leucocyte antigen (HLA)‐B51 (g–i) and BMI (j–l) at the time of serum collection. Comparisons of data among the three groups were performed by means of using analysis of variance (anova) or Kruskal–Wallis test according to the type of distribution; pairwise comparisons were performed by the Mann–Whitney U‐test; n = number of samples.
Impact of therapy on BD patients' immunometabolic profile
We subdivided samples according to therapy administered at the time of serum collection. More precisely, 18 samples were collected from patients with no therapy: 12 and 41 from patients on low and high corticosteroids, respectively; 13 sera were collected when patients were on DMARDs and 24 when biological agents were administered (Table 4). Patients treated with biological agents showed significantly higher sTNFR and leptin serum levels when compared to DMARD‐treated patients (P = 0·0246 and P = 0·0023, respectively) and HC (P = 0·0014 and P = 0·0002, respectively). In addition, sCD40L levels showed to be increased significantly in BD patients irrespective of the specific treatment approach, when compared to HC. This difference was also observed in patients treated with anti‐IL‐1 and anti‐TNF biological agents (data not shown). However, no statistically significant difference was identified in sTNFR (P = 0·5191) and leptin (P = 0·7617) serum levels between patients administered with anti‐IL‐1 and anti‐TNF agents (data not shown). Compared to HC, patients treated with both high‐ and low‐dose corticosteroids showed significantly higher sCD40L serum levels (P < 0·0001 in both cases). In contrast, leptin serum levels resulted higher only in patients treated with low‐dose corticosteroids when compared to HC (P = 0·0012). No statistically significant difference was observed in leptin levels between patients administered with low and high corticosteroid dosages (P = 0·3108) and between high corticosteroid dosage‐treated patients and HC (P = 0·1624). In addition, patients treated with high‐dose corticosteroids showed significantly higher homocysteine serum levels compared to patients treated with low‐dose corticosteroids (P = 0·0075). No significant difference was found in the other inflammatory biomarkers investigated between different treatment groups. Figure 5 shows significant difference in serum levels of inflammatory biomarker according to several treatment approaches.
Table 4.
Therapeutic approaches at the time of serum collection.
| Treatment approaches (%) | Combined with low‐dose CTS (%) | Combined with high‐dose CTS (%) | |
|---|---|---|---|
| DMARDs | Cyclosporin: 6 (46·15) | 2 (33·33) | 4 (66.67) |
| Salazopyrin: 3 (23·07) | 0 (0) | 0 (0) | |
| Azathioprine: 2 (15·38) | 1 (50) | 0 (0) | |
| Methotrexate: 2 (15·38) | 1 (50) | 1 (50) | |
| Biological agents | Infliximab: 10 (41·66) | 0 (0) | 1 (10) |
| Etanercept: 5 (20·83) | 1 (20) | 1 (20) | |
| Adalimumab: 1 (4·16) | 1 (100) | 0 (0) | |
| Anakinra: 7 (29·16) | 3 (42·85) | 3 (42.85) | |
| Canakinumab: 1 (4·16) | 0 (0) | 0 (0) | |
| No therapy | 1 (5·55) | 0 (0) | |
CTS = corticosteroids; DMARDs = disease‐modifying anti‐rheumatic drugs.
Figure 5.
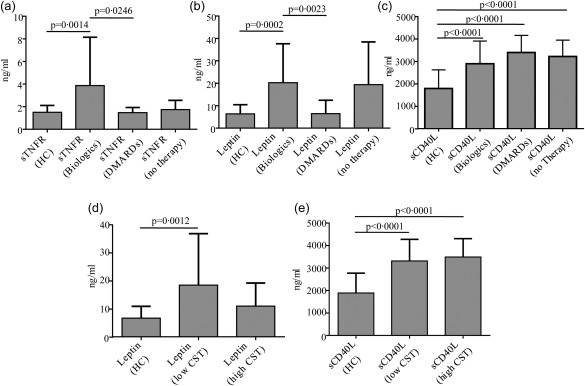
Immunometabolic profile of Behçet's disease (BD) patients according to different drug treatments. Serum levels of soluble type 1 tumour necrosis factor receptor (sTNFR), leptin and soluble CD40L (sCD40L) in BD patients in according to different treatment approaches. Histograms (a–c) refer to patients treated with disease‐modifying anti‐rheumatic drugs (DMARDs) (n = 15) or biological agents (n = 24) compared with healthy controls (HC) (n = 18) and patients with no therapy (n = 18); histograms (d,e) are related to BD patients administered with high (n = 41) and low corticosteroid (CTS) dosages (n = 12). Comparisons of data among multiple groups were performed using analysis of variance (anova) or Kruskal–Wallis test according to the type of distribution; pairwise comparisons were performed using the Mann–Whitney U‐test; n = number of samples.
Discussion
In the present study we evaluated the serum levels of a core set of circulating biomarkers of inflammation in a cohort of patients with BD. As reported previously, many differences have been detected between active and inactive BD patients and HC; in particular, serum concentrations of leptin sCD40L and sTNFR showed significant differences among groups. Leptin is a peptide hormone involved in the regulation of body weight as well as several endocrine and immune functions 15, 16, 17, 18; because it has structural and functional similarities with some elements of the cytokine family, leptin shares the same signal transduction pathway with cytokines. Leptin regulates both innate and adaptive immunity 18 and modulates several T cell subpopulation functions through interaction with the mammalian target of the rapamycin (mTOR) pathway 19, 20, 21. Of note, leptin inhibits regulatory T cell (Treg) proliferation 19 from one side and enhances conventional T cells (Tconv) proliferation 20, 22 on the other side. The enhanced proliferation of CD4+CD25− Tconv is associated with inflammatory cytokine secretion, whereas leptin neutralization has the opposite effect, suggesting that this adipokine plays a key role in T cell homeostasis and function 18. Moreover, data from animal models have shown that the production of leptin during infectious and inflammatory processes has similar kinetics to that of cytokine induction 23. Literature data suggest a correlation between leptin levels and disease activity in BD 24, 25, even though serum leptin concentrations were not associated significantly with the presence of eye disease in such studies 25, 26. Our results are in agreement with previously published data that reported increased levels of serum leptin in BD patients when compared to HC; moreover, we detected a significant correlation between leptin serum levels and the presence of the HLAB51, while the association with a higher BMI is not surprising. However, we did not observe a significant increase in the concentrations of serum leptin in patients with active disease; because serum leptin levels are associated closely with the amount of body fat and differ according to sex, BMI and disease duration, we hypothesize that the lack of association could be due most probably to the relatively low number of samples, which were inadequate to perform an appropriate stratification in the group of active diseases. Based on these findings, we could attribute a possible role for leptin in the pathogenesis of BD, although future studies would be useful to clarify the influence of leptin in a certain type of organ involvement and, as a consequence, to explore the potential value of leptin as a predictive biomarker of disease activity.
So far, several studies have analysed the profile of cytokine production in BD, even though the specific mechanism for the potential differences in the preponderance of the Th1 or Th2 population is unclear. IL‐6 is an inflammatory cytokine responsible of multiple effects including the ability to stimulate the differentiation and the proliferation of cytotoxic T cells, and the differentiation of B cells into plasma cells. Several in‐vivo and in‐vitro data have shown a significant increase of IL‐6 in BD 5, 27, and in some cases a correlation was reported between serum levels of IL‐6 and some of the main clinical features of BD 28. Our data have confirmed the results, suggesting a possible role for IL‐6 in the immune complex‐mediated pathology; however, the number of samples analysed did not allow us to investigate correctly whether IL‐6 levels change according to organ involvement. Conversely, no differences were detected in MCP‐1, MPO and resistin serum levels between BD patients and HC, but studies on larger cohorts and samples are needed to explore those results more effectively.
CD40L, expressed primarily on activated T cells and platelets, is a transmembrane molecule playing an important role in innate and adaptive immunity. The soluble forms of CD40L retain their ability in the formation of trimers, which deliver several biological signals by binding several receptors, including CD40 on antigen‐presenting cells 29. sCD40L has been reported to be involved in several immune‐related and vascular pathologies, including BD 30. In particular, previous published data reported that platelet‐derived sCD40L levels were higher in BD patients than HC 31. Accordingly, the percentages of CD4+ T cells containing CD40L were higher in active BD compared to healthy controls upon in‐vitro stimulation 5. In line with these findings, we found that sCD40L was significantly higher in both active and inactive BD patients compared with HC, and none of the different treatment approaches determined a significant decrease.
An interesting hypothesis can be postulated on sTNFR serum levels and the pathogenesis of BD. TNF and the sTNFR superfamily play very important roles in the pathogenesis of several inflammatory diseases 32. In particular, it has been shown that mutations of TNFR1 are associated with reduced Treg cell numbers and altered Treg cell suppressive function, together with a hyperactivation of Tconv cells in autoinflammatory disorders 32.
Biological activities of TNF are mediated by two distinct receptors, p55 type 1 and p75 type 2 33. In the present study we evaluated type 1 TNFR, composed of a trimeric cytokine receptor that binds TNF; the receptor co‐operates with an adaptor protein, which is important in determining the outcome of the response (i.e. inflammation). TNFR members are being used or evaluated as drug targets for the treatment of immune or dysfunction or other diseases 34, 35; previous studies have also investigated the production of soluble sTNFR as a biological markers of disease activity in BD, demonstrating that sTNFR2 plasma concentrations are linked closely with active BD, especially with arthritis 36, 37. We found that BD patients presenting inactive disease showed significantly higher sTNFR serum concentrations than HC, while this was not the case for active patients, leading us to suggest a possible role of sTNFR in regulating BD activity. In line with this observation, sTNFR are reported to be able to affect TNF activity augmenting some of its effects, thus confirming a protective role exerted by sTNFR during inflammation 38. In addition, we observed a correlation between sTNFR and age; specifically, older patients (aged more than 40 years) presented higher levels of sTNFR. This observation seems to be in line with the general opinion that BD activity is usually less aggressive over time. Also in line with previously reported data 39, 40, sTNFR levels increased according to BMI. Interestingly, we found that sTNFR was significantly higher in HLAB51‐negative patients than in HC. On the contrary, there was no difference between HLAB51‐positive patients and HC. Recently, a meta‐analysis showed that HLAB51 was associated with a moderately higher prevalence of genital ulcers, ocular and skin manifestations and a decreased prevalence of gastrointestinal involvement 41. The protean clinical spectrum in BD patients could be linked to different imbalances in cytokine networks, and sTNFR serum levels could represent an indicator in this sense. Another important result was represented by the detection of higher levels of sTNFR in patients who were receiving biologicals at time of serum sampling, even though we cannot confirm any difference in terms of the choice of biological agent. The last data have important clinical implications, further allowing the identification of a novel biomarker of disease activity and response to treatment. It is desirable that drug research invests resources aimed at investigating more thoroughly a more specific target of action in the function of a specific organ involvement. Currently, we are conducting a validation study on a larger and multi‐ethnic cohort in order to confirm the results obtained. Although further research is warranted to elucidate the exact role of sTNFR in BD, its profiling may contribute to the understanding of the physiopathology processes underlying BD activity and damage and to provide useful tools for biomarkers and personalized therapeutic approaches.
Disclosure
The authors declare have no disclosures.
Author contributions
All authors made substantial contributions to all the following: L. C., V. P. and G. Matarese conceived and designed the study; A. V., L. C., O. M. L., R. T. and F. M. enrolled the subjects and patients and collected clinical data; V. P., V. D. R. and M. Galgani performed the experiments, the analysis and interpretation of the data; C. A., G. Marone and M. Galeazzi performed critical reading of the manuscript; L. C., A. V., V. P. and G. Matarese wrote the paper; L. C., M. Galeazzi and G. Matarese revised and approved the final submitted version.
Acknowledgements
The work was supported by grants from Novartis Farma SpA, CNR‐Medicina Personalizzata Program, Italian Space Agency (2014‐033‐R.O.), the Ministero della Salute (GR‐2010‐2315414, the Fondo per gli Investimenti della Ricerca di Base (RBFR12I3UB_004), SIMBA Onlus (Associazione Italiana Sindrome e Malattia di Behcet), CREME (Campania Research in Experimental Medicine) and TIMING (Terapie Innovative di Malattie Infiammatorie croniche, metaboliche, Neoplastiche e Geriatriche), UniNA and Compagnia di San Paolo, in the frame of Programme STAR (Sostegno Territoriale alle Attivitá di Ricerca). None of the funding bodies had a role in the collection, analysis and interpretation of data, or in writing the manuscript. We thank Dr Claudio Procaccini for critical reading of the manuscript. This work is dedicated to the memory of Eugenia Papa and Serafino Zappacosta.
References
- 1. Hatemi G, Yazici Y, Yazici H. Behçet's syndrome. Rheum Dis Clin North Am 2013; 39:245–61. [DOI] [PubMed] [Google Scholar]
- 2. Cantarini L, Lopalco G, Caso F et al Effectiveness and tuberculosis‐related safety profile of interleukin‐1 blocking agents in the management of Behçet's disease. Autoimmun Rev 2015; 14:1–9. [DOI] [PubMed] [Google Scholar]
- 3. Cantarini L, Vitale A, Lucherini OM et al The labyrinth of autoinflammatory disorders: a snapshot on the activity of a third‐level center in Italy. Clin Rheumatol 2015; 34:17–28. [DOI] [PubMed] [Google Scholar]
- 4. Direskeneli H. Behcet's disease: infectious aetiology, new autoantigens, and HLA‐B51. Ann Rheum Dis 2001; 60:996–1002. [DOI] [PMC free article] [PubMed] [Google Scholar]
- 5. Hamzaoui K, Hamzaoui A, Guemira F, Bessioud M, Hamza M, Ayed K. Cytokine profile in Behçet's disease patients. Relationship with disease activity. Scand J Rheumatol 2002; 31:205–10. [DOI] [PubMed] [Google Scholar]
- 6. Aktas Cetin E, Cosan F, Cefle A, Deniz G. IL‐22‐secreting Th22 and IFN‐γ‐secreting Th17 cells in Behçet's disease. Mod Rheumatol 2014; 24:802–7. [DOI] [PubMed] [Google Scholar]
- 7. Shimizu J, Kaneko F, Suzuki N. Skewed helper T‐cell responses to IL‐12 family cytokines produced by antigen‐presenting cells and the genetic background in Behçet's disease. Genet Res Int 2013; 2013:363859. [DOI] [PMC free article] [PubMed] [Google Scholar]
- 8. Mesquida M, Molins B, Llorenç V et al Proinflammatory cytokines and C‐reactive protein in uveitis associated with Behçet's disease. Mediators Inflamm 2014; 2014:396204. [DOI] [PMC free article] [PubMed] [Google Scholar]
- 9. Vitale A, Rigante D, Lopalco G et al Serum amyloid‐A in Behçet's disease. Clin Rheumatol 2014; 33:1165–7. [DOI] [PubMed] [Google Scholar]
- 10. Norata GD, Caligiuri G, Chavakis T et al The cellular and molecular basis of translational immunometabolism. Immunity 2015; 43:421–34. [DOI] [PubMed] [Google Scholar]
- 11. De Rosa V, Galgani M, Porcellini A et al Glycolysis controls the induction of human regulatory T cells by modulating the expression of FOXP3 exon 2 splicing variants. Nat Immunol 2015; 16:1174–84. [DOI] [PMC free article] [PubMed] [Google Scholar]
- 12. Procaccini C, Pucino V, De Rosa V, Marone G, Matarese G. Neuro‐endocrine networks controlling immune system in health and disease. Front Immunol 2014; 5:143. [DOI] [PMC free article] [PubMed] [Google Scholar]
- 13.International Study Group for Behçet's Disease (ISGBD). Criteria for diagnosis of Behçet's disease. International Study Group for Behçet's Disease. Lancet 1990; 335:1078–80. [PubMed] [Google Scholar]
- 14. Neves FS, Moraes JC, Kowalski SC, Goldenstein‐Schainberg C, Lage LV, Goncalves CR. Cross‐cultural adaptation of the Behçet's Disease Current Activity Form (BDCAF) to Brazilian Portuguese language. Clin Rheumatol 2007; 26:1263–7. [DOI] [PubMed] [Google Scholar]
- 15. Fantuzzi G, Faggioni R. Leptin in the regulation of immunity, inflammation, and hematopoiesis. J Leukoc Biol 2000; 68:437–46. [PubMed] [Google Scholar]
- 16. Palmer G, Gabay C. A role for leptin in rheumatic diseases? Ann Rheum Dis 2003; 62:913–5. [DOI] [PMC free article] [PubMed] [Google Scholar]
- 17. Procaccini C, Pucino V, Mantzoros CS, Matarese G. Leptin in autoimmune diseases. Metabolism 2015; 64:92–104. [DOI] [PubMed] [Google Scholar]
- 18. La Cava A, Matarese G. The weight of leptin in immunity. Nat Rev Immunol 2004; 4:371–9. [DOI] [PubMed] [Google Scholar]
- 19. De Rosa V, Procaccini C, Calì G et al A key role of leptin in the control of regulatory T cell proliferation. Immunity 2007; 26:241–55. [DOI] [PubMed] [Google Scholar]
- 20. Procaccini C, De Rosa V, Galgani M et al Leptin‐induced mTOR activation defines a specific molecular and transcriptional signature controlling CD4+ effector T cell responses. J Immunol 2012; 189:2941–53. [DOI] [PubMed] [Google Scholar]
- 21. Procaccini C, De Rosa V, Galgani M et al An oscillatory switch in mTOR kinase activity sets regulatory T cell responsiveness. Immunity 2010; 33:929–41. [DOI] [PMC free article] [PubMed] [Google Scholar]
- 22. Cassano S, Pucino V, La Rocca C et al Leptin modulates autophagy in human CD4+CD25– conventional T cells. Metabolism 2014; 63:1272–9. [DOI] [PMC free article] [PubMed] [Google Scholar]
- 23. Sarraf P, Frederich RC, Turner EM et al Multiple cytokines and acute inflammation raise mouse leptin levels: potential role in inflammatory anorexia. J Exp Med 1997; 185:171–5. [DOI] [PMC free article] [PubMed] [Google Scholar]
- 24. Evereklioglu C, Inalöz HS, Kirtak N et al Serum leptin concentration is increased in patients with Behçet's syndrome and is correlated with disease activity. Br J Dermatol 2002; 147:331–6. [DOI] [PubMed] [Google Scholar]
- 25. Yalçindağ FN, Kisa U, Batioğlu F, Yalçindağ A, Ozdemir O, Cağlayan O. Serum leptin levels in patients with ocular and nonocular Behçet's disease. Mediators Inflamm 2007; 2007:31986. [DOI] [PMC free article] [PubMed] [Google Scholar]
- 26. Kavuncu S, Koç F, Kurt M et al Evaluation of serum leptin concentration in Behçet's disease with ocular involvement. Graefes Arch Clin Exp Ophthalmol 2005; 243:1158–60. [DOI] [PubMed] [Google Scholar]
- 27. Hamzaoui K, Hamzaoui A, Kahan A, Hamza M, Chabbou A, Ayed K. Interleukin‐6 in peripheral blood and inflammatory sites in Behçet's disease. Mediators Inflamm 1992; 1:281–5. [DOI] [PMC free article] [PubMed] [Google Scholar]
- 28. Hirohata S, Isshi K, Oguchi H et al Cerebrospinal fluid interleukin‐6 in progressive Neuro‐ Behçet's syndrome. Clin Immunol Immunopathol 1997; 82:12–7. [DOI] [PubMed] [Google Scholar]
- 29. Elgueta R, Benson MJ, de Vries VC, Wasiuk A, Guo Y, Noelle RJ. Molecular mechanism and function of CD40/CD40L engagement in the immune system. Immunol Rev 2009; 229:152–72. [DOI] [PMC free article] [PubMed] [Google Scholar]
- 30. Toubi E, Shoenfeld Y. The role of CD40–CD154 interactions in autoimmunity and the benefit of disrupting this pathway. Autoimmunity 2004; 37:457–64. [DOI] [PubMed] [Google Scholar]
- 31. Fernández Bello I, Álvarez MT, López‐Longo FJ et al Platelet soluble CD40L and matrix metalloproteinase 9 activity are proinflammatory mediators in Behçet disease patients. Thromb Haemost 2012; 107:88–98. [DOI] [PubMed] [Google Scholar]
- 32. Pucino V, Lucherini OM, Perna F, Obici L, Merlini G, Cattalini M, La Torre F, Maggio MC, Lepore MT, Magnotti F, Galgani M, Galeazzi M, Marone G, De Rosa V, Talarico R, Cantarini L, Matarese G. Differential impact of high and low penetrance TNFRSF1A gene mutations on conventional and regulatory CD4+ T cell functions in TNFR1‐associated periodic syndrome. J Leukoc Biol 2015. Nov 23. pii: jlb.3A0915–399R. [Epub ahead of print] PubMed PMID: 26598380. [DOI] [PubMed] [Google Scholar]
- 33. Hehlgans T, Pfeffer K. The intriguing biology of the tumour necrosis factor/tumour necrosis factor receptor superfamily: players, rules and the games. Immunology 2005; 115:1–20. [DOI] [PMC free article] [PubMed] [Google Scholar]
- 34. Feldmann M, Brennan FM, Foxwell BM, Taylor PC, Williams RO, Maini RN. Anti‐TNF therapy: where have we got to in 2005? J Autoimmun 2005; 25:26–8. [DOI] [PubMed] [Google Scholar]
- 35. Caso F, Costa L, Rigante D et al Biological treatments in Behçet's disease: beyond anti‐TNF therapy. Mediators Inflamm 2014; 2014:107421. [DOI] [PMC free article] [PubMed] [Google Scholar]
- 36. Turan B, Pfister K, Diener PA et al Soluble tumour necrosis factor receptors sTNFR1 and sTNFR2 are produced at sites of inflammation and are markers of arthritis activity in Behçet's disease. Scand J Rheumatol 2008; 37:135–41. [DOI] [PubMed] [Google Scholar]
- 37. Turan B, Gallati H, Erdi H, Gürler A, Michel BA, Villiger PM. Systemic levels of the T cell regulatory cytokines IL‐10 and IL‐12 in Behçet's disease; soluble sTNFR‐75 as a biological marker of disease activity. J Rheumatol 1997; 24:128–32. [PubMed] [Google Scholar]
- 38. Aderka D, Engelmann H, Maor Y, Brakebusch C, Wallach D. Stabilization of the bioactivity of tumor necrosis factor by its soluble receptors. J Exp Med 1992; 175:323–9. [DOI] [PMC free article] [PubMed] [Google Scholar]
- 39. Malavazos AE, Corsi MM, Ermetici F et al Proinflammatory cytokines and cardiac abnormalities in uncomplicated obesity: relationship with abdominal fat deposition. Nutr Metab Cardiovasc Dis 2007; 17:294–302. [DOI] [PubMed] [Google Scholar]
- 40. Mohamed‐Ali V, Goodrick S, Bulmer K, Holly JM, Yudkin JS, Coppack SW. Production of soluble tumor necrosis factor receptors by human subcutaneous adipose tissue in vivo . Am J Physiol 1999; 277:E971–5. [DOI] [PubMed] [Google Scholar]
- 41. Maldini C, Lavalley MP, Cheminant M, de Menthon M, Mahr A. Relationships of HLA‐B51 or B5 genotype with Behçet's disease clinical characteristics: systematic review and meta‐analyses of observational studies. Rheumatology (Oxf) 2012; 51:887–900. [DOI] [PubMed] [Google Scholar]