

Abstract
Ongoing cortical activity consists of sequences of synchronized bursts, named neuronal avalanches, whose size and duration are power law distributed. These features have been observed in a variety of systems and conditions, at all spatial scales, supporting scale invariance, universality and therefore criticality. However, the mechanisms leading to burst triggering, as well as the relationship between bursts and quiescence, are still unclear. The analysis of temporal correlations constitutes a major step towards a deeper understanding of burst dynamics. Here, we investigate the relation between avalanche sizes and quiet times, as well as between sizes of consecutive avalanches recorded in cortex slice cultures. We show that quiet times depend on the size of preceding avalanches and, at the same time, influence the size of the following one. Moreover we evidence that sizes of consecutive avalanches are correlated. In particular, we show that an avalanche tends to be larger or smaller than the following one for short or long time separation, respectively. Our analysis represents the first attempt to provide a quantitative estimate of correlations between activity and quiescence in the framework of neuronal avalanches and will help to enlighten the mechanisms underlying spontaneous activity.
Bursty dynamics characterizes a wide variety of physical systems. Examples include earthquakes in the earth’s crust1, chemical reactions2, solar flares3,4 or Barkhausen noise in ferromagnets5, to cite only a few. In neuronal networks, both in vitro and in vivo, bursts arise from the near synchronous firing of many neurons6,7,8,9,10,11,12,13,14. Burst sequences in ongoing cortical activity generally have an irregular character15, similar to physical systems with intermittent dynamics. This translates in a power spectral density (PSD) which exhibits a 1/f-like decay, as observed in ongoing neuronal activity measured using the electroencephalogram (EEG), the magnetoencephalogram (MEG) or the local field potential (LFP)16,17,18,19.
In the last decade, a particular approach to neuronal synchronization has been proposed, that captures both the intermittent and oscillatory features of spontaneous activity20 in the form of ‘neuronal avalanches’7,8,11,21,22. In neuronal avalanches, activity bursts distribute in sizes and durations according to power laws with specific exponents characteristic of a critical branching process23,24, thus providing experimental evidences that the brain might self-organize into a critical state25. This interpretation has unveiled similarities with other natural phenomena exhibiting scale-free statistics, for instance earthquakes26, and suggests a further analysis of the temporal features of neuronal avalanches based on the theory of stochastic processes. In this framework the time intervals between consecutive events, also called inter-event intervals, quiet times27,28 or waiting times29,30,31, play an important role in the characterization of a process32. Here we notice that the definition of inter-event interval or quiet time generally differs from the one of waiting time: While the quiet time is defined as the difference between the ending and starting time of consecutive events, the waiting time describes the time interval between the starting times of consecutive events27. These two definitions only coincide when the event durations are negligible compared to quiet times, as it happens for earthquakes. The statistics of quiet times has been recently investigated for neuronal avalanches recorded in cortex slice cultures28,33. It has been found that the quiet time distribution P(Δt) follows a power law at short time scales, namely from a few to 200–300 ms, which indicates that avalanches are temporally correlated if sufficiently close in time. For longer quiet times this distribution is generally characterized by a local maximum that coincides with the characteristic time of underlying slow oscillations, which leads to a peculiar non-monotonic behaviour. The systematic removal of smaller avalanches from experimental time series and the analysis of the resulting quiet time distributions, has further revealed that avalanche occurrence preserves the temporal features of θ and β/γ oscillations and correlations exist between avalanche sizes and quiet times28.
The relationship between sizes of synchronized bursts and quiet times is still poorly understood. This problem is related to many open questions about the mechanisms controlling spontaneous activity and its function. In particular, which factors determine the duration or size of a burst and which the duration of quiet times? Several experimental studies suggest that synchronized bursts are terminated by an activity dependent depression of network excitability12,34,35, which is then recovered during quiet times. In this scheme quiet times do not usually correlate with the size of preceding bursts and network excitability is reset to the same value after each burst13,36,37,38,39. For instance, in the CA3 region of hippocampal slices of adult rats12 it has been observed that burst termination is mainly due to the exhaustion of releasable glutamate at recurrent synapses. In this case the burst size is positively correlated with the duration of the previous inter-burst interval, but not with the duration of the following one. This means that the size of a given burst does not influence the duration of the following quiet time. Similar correlations have been measured in several different networks13,37,38,39. The positive correlation observed between bursts and preceding quiet times suggests that burst sizes depend on the level of network excitability reached at the end of the quiescence. If this level was determined solely by the length of the quiet time, then it should be reset to the same value after each burst, as the absence of correlations between burst sizes and following quiet times would suggest. In the opposite scenario a larger burst would be followed by a longer quiet time and a positive correlation should be measured between burst sizes and following quiet times. Such a correlation has been only observed in dissociated cultures of rat spinal neurons40 and linked to the role of synaptic inhibition in the termination of bursts. More precisely, the length of quiet times has been found to depend on the spike rate during preceding bursts, which suggests a possible role of spike adaptation in the termination of a burst. In summary, excluding a few particular cases, the existing literature suggests that, independently of the intensity and length of a burst, the network excitability decays always to the same resting value. During the following quiescent period excitability is recovered and a new burst is triggered, for example by spontaneous single action potentials or spontaneous miniature synaptic release which can be rapidly amplified and generate larger depolarizing events6,41.
In order to better understand the relationship between quiescence and activity, here we propose an alternative approach to the study of correlations in spontaneous cortical activity, which has been successfully introduced to address the longstanding problem of magnitude correlations in seismic and solar flare activity3,4,42 and has recently been applied to the analysis of the fMRI BOLD signal43,44. This approach is based on the method of surrogate data45 and consists in a systematic comparison of conditional probabilities evaluated in the real time series with the ones evaluated in a time series where avalanche sizes are randomly reshuffled. Such a procedure is very efficient in case of large statistical fluctuations in the data3,4,42, as for the avalanche time series we analyze. Indeed, in the Supplementary Information (SI) we show that both correlation functions and scatter plots, which are commonly used to investigate the relationship between avalanche sizes and quiet times, are strongly affected by statistical noise, exhibiting fluctuations as large as the ones measured in uncorrelated data sets (Supplementary Figs S1–S3). In particular, scatter plots do not give any clear indication about correlations between avalanche sizes and quiet times (Supplementary Figs S2, S3), as discussed in a previous work28.
We consider spontaneous avalanche activity recorded in cortex slice cultures under normal and disinhibited conditions. Firstly we look at correlations between quiet times Δt and avalanche sizes, s. We find that avalanche sizes are significantly correlated with both the preceding and the following quiet times. The correlation with the preceding quiet times is stronger at all time scales. Nevertheless, we show that correlations between avalanche sizes and following quiet times are not negligible and are particularly relevant for Δt < 400 ms. In all cases, the specific relationship between quiet times and avalanche sizes is strongly altered in disinhibited cultures. Finally we investigate the relationship between sizes of consecutive avalanches. In normal conditions, we observe that, given an avalanche of a certain size, the following one tends to be smaller if close in time, larger otherwise. In contrast, in disinhibited cultures, an avalanche can be significantly larger than the preceding one, even when avalanches are very close in time.
Methods
Experimental setup
All experimental procedures were approved by the Animal Care and User Committee (ACUC) of the National Institute of Mental Health, USA and were carried out in accordance with the approved guidelines. Coronal slices from rat dorsolateral cortex (postnatal day 0–2; 350 μm thick) were attached to a poly-D-lysine coated 60-microelectrode array (MEA; Multichannelsystems, Germany) and grown at 35.5 in normal atmosphere in standard culture medium without antibiotics for 4–6 weeks before recording. Cortex slice cultures retain the cortical architecture of layers and corresponding cell types, as well as the mesoscopic and microcircuit organization in intrinsic cortical connectivity. Three sets of data have been used for the study, recorded in non-driven, driven and disinhibited conditions. The first one has been taken from Beggs et al.8 and consists of avalanche activity measured from cortex-striatum-substantia nigra triple cultures or single cortex cultures. In short, spontaneous avalanche activity is recorded outside the incubator in standard artificial cerebrospinal fluid (ACSF; laminar flow of 1 ml/min) under stationary conditions for up to 10 hrs. The second set has been taken from Stewart et al.46. Spontaneous avalanche activity is recorded inside an incubator in 600 μl of culture medium under sterile conditions for at least 5 hrs. The head stage with the MEA is rocked between ±75° with a sinusoidal trajectory and a pause of 10 s at the steepest angles before reversing direction (cycle time 200 s). The exposure to atmosphere at the steepest trajectory angles triggers transient neuronal activity increases. For the third data set, which has been described in Shew et al.47, bath application of the GABAA-receptor antagonist picrotoxin (PTX; ~3 μmol) is used. In all the three conditions we only consider spontaneous, non-stimulated activity. The spontaneous local field potential (LFP) is sampled continuously at 1 kHz at each electrode and low-pass filtered at 50 Hz. Negative deflections in the LFP (nLFP) are detected by crossing a noise threshold of −3 SD followed by negative peak detection within 20 ms. nLFP times and nLFP amplitudes are extracted. Neuronal avalanches are defined as spatio-temporal clusters of nLFPs on the MEA8. A neuronal avalanche consists of a consecutive series of time bins of width  that contain at least one nLFP on any of the electrodes. Each avalanche is preceded and ended by at least one time bin with no activity. Without loss of generality, the present analysis is done with width
  individually estimated for each culture as the average inter nLFP interval on the array at which the power law in avalanche sizes s, P(s) ~ s−α, yields α = 3/2.
  ranged between 3–6 ms for all cultures. Avalanche size is defined as the sum of absolute nLFP amplitudes (μV) on active electrodes or simply the number of active electrodes. We only consider avalanches whose size s in μV is larger than a certain threshold sth, i.e. only those avalanches that fall within the power law regime of the size distribution. Avalanche size is then measured in unit of sth.
A quiet time Δt is defined as the time interval between the ending time of an avalanche  and the starting time
  of the following one, namely
  .
.
Conditional probability approach
The conditional probability approach to correlation analysis is based on the method of surrogate data45. Its formal application requires two ingredients, a null hypothesis against which observations are tested, and a discriminating statistic. The null hypothesis is a potential explanation that we seek to show is inadequate for explaining the data. We consider two null hypothesis: (1) quiet times and avalanche sizes are uncorrelated, (2) sizes of consecutive avalanches are uncorrelated. The discriminating statistic here is a conditional probability. If this is significantly different for the observed data than the value expected under the null hypotheses, then the null hypothesis can be rejected. To test this hypothesis we generate surrogate data sets by reshuffling avalanche sizes while keeping the occurrence times fixed.
Correlations between the avalanche size s i and the following quiet time Δt i
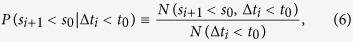
Consider a temporal sequence of avalanches (Fig. 1). Each avalanche i has a size si and two consecutive avalanches, i and i + 1, are separated by a quiet time Δti. Given two thresholds in size and time, s0 and t0, we define the following conditional probability
Figure 1. Schematic representation of the avalanche process.
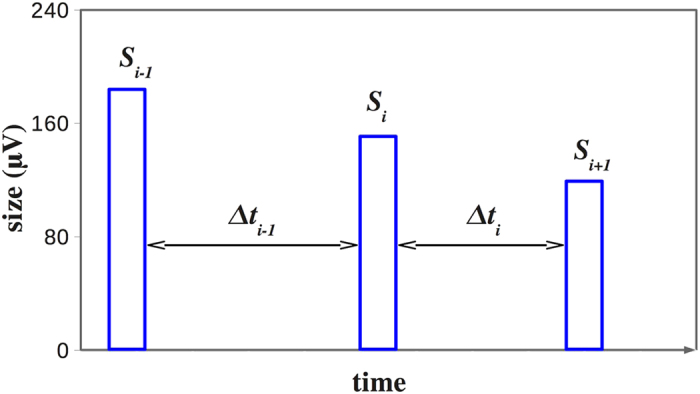
A generic avalanche of size si is preceded by a quiet time Δti−1 and followed by a quiet time Δti. Similarly the quiet time Δti separates consecutive avalanches of size si and si+1.
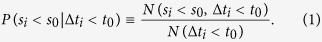 |
Here si is the size of the avalanche preceding Δti, N(si < s0, Δti < t0) is the number of avalanches with size si < s0 preceding a quiet time Δti < t0 and N(Δti < t0) is the number of quiet times Δti < t0.
We calculate the conditional probability (1) both for the avalanche time series and for several independent realizations of time series obtained by reshuffling avalanche sizes while keeping fixed their starting and ending times. We denote with  a value of si randomly chosen in the entire time series and with
 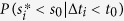 the conditional probability (1) calculated in the reshuffled time series. We evaluate the distribution
 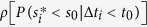 obtained from 105 realizations of reshuffled time series, which, as expected, is Gaussian because
  is uncorrelated to Δti by construction. We denote its mean value as
  and its standard deviation as
  (Fig. 2).
Figure 2. Conditional probability in experimental and reshuffled time series.
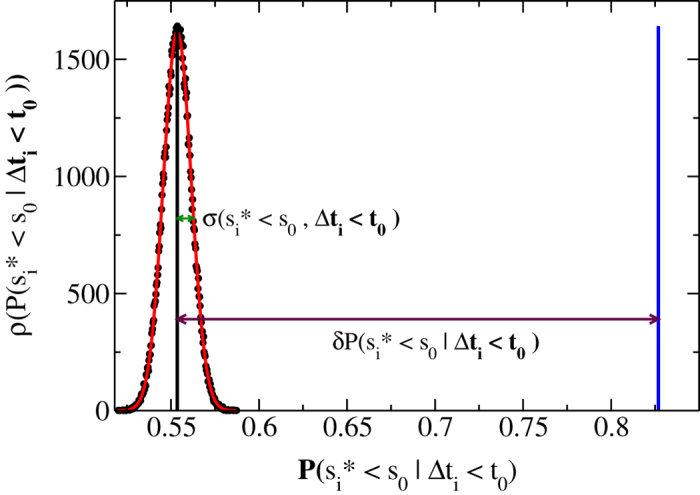
 (black circles) is the distribution of
  for s0 = 300 μV and t0 = 300 ms, evaluated on 105 realizations of the reshuffled avalanche series. The distribution
  is well fitted by a Gaussian (red curve) with mean value Q(si < s0, Δti < t0) = 0.5536 (black vertical line) and standard deviation σ(si < s0, Δti < t0) = 0.0094. The evaluation of P(si < s0|Δti < t0) in the real avalanche series for the same s0 and t0 provides the value 0.8269 (blue vertical line). It follows
  , indicating that significant correlations exist between the avalanche size and the following quiet time.
We then compare the mean value  with the corresponding experimental conditional probability P(si < s0 | Δti < t0) defining the difference
 |
and consider the ratio  as a measure of significance. If
 we conclude that, at ~0.05 significance level, significant non-zero correlations exist between si and Δti and distinguish two cases: δP(si < s0, Δti < t0) > 0 and δP(si < s0, Δti < t0) < 0. In the first case the number of couples N(si < s0, Δti < t0) satisfying both conditions is significantly larger in the real avalanche series than in the reshuffled one, namely it is more likely to find couples satisfying both conditions in the real rather than in the reshuffled time series. We say that si and Δti are positively correlated. Conversely, in the second case the number of couples N(si < s0, Δti < t0) satisfying both conditions is significantly larger in the reshuffled avalanche series than in the real one, namely it is more likely to find couples satisfying both conditions in an uncorrelated rather than in the real time series. In this case we say that si and Δti are anti-correlated.
As an example, in Fig. 2
 is compared with P(si < s0 | Δti < t0) for a given value of s0 and t0.
Finally we introduce the reverse conditional probability
 |
The following relationship between Eqs 1 and 3 holds:
 |
From Eq. 4 it follows that
 |
Correlations between the avalanche size s i+1 and the preceding quiet time Δt i
To study correlations between avalanche sizes si+1 and the preceding quiet times Δti we consider the following conditional probability
 |
where si+1 is the size of the avalanche following Δti, N(si+1 < s0, Δti < t0) is the number of avalanches with size si+1 < s0 following a quiet time Δti < t0 and N(Δti < t0) is the number of quiet times Δti < t0. The relevant quantity in this case is
 |
Correlations between sizes of consecutive avalanches
For the analysis of correlations between sizes of consecutive avalanches we consider the ratio si+1/si and define the following conditional probability
 |
where λ is a real number and N(si+1/si > λ, Δti < t0) is the number of avalanche couples separated by a Δt < t0 for which the second avalanche has a size si+1 larger than λ times si, the size of the first one. Accordingly, in this case the relevant quantity is
 |
Results
In the following we analyze avalanche time series recorded in cortex slice cultures under non-driven, driven and disinhibited (PTX) conditions47. For each condition results are averaged over all samples. Results for individual cultures are shown in the SI (Supplementary Figs S4–S12). We first study the correlations between quiet times Δt and avalanche sizes, s. Then we investigate the relationship between sizes of consecutive avalanches. All results are significant at the 0.05 level (see Methods).
Correlations between the size s i and the following quiet time Δt i
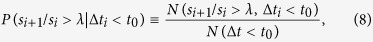
To investigate how the quiet time Δti depends on the size si of the previous avalanche, we evaluate the quantity δP(si < s0 | Δti < t0) for different values of s0 and t0 (see Methods). In Fig. 3 we show δP(si < s0 | Δti < t0) as a function of s0 for different values of t0. Both in the non-driven (Fig. 3a) and driven condition (Fig. 3b), for Δti < 200 ms, the quantity δP(si < s0, Δti < t0) takes always positive values beyond error bars, which implies that the probability of finding Δti < 200 ms after an avalanche of size si < 30s0 is larger in the real than in the reshuffled time series. Moreover, since δP(si < s0, Δti < t0) generally decreases by increasing t0, this probability gradually decreases if one considers avalanches separated by longer Δt.
Figure 3. Significant correlations exist between the size si and the following quiet time Δti.
The quantity δP(si < s0, Δti < t0) as a function of s0 for different values of t0 and different conditions, non-driven, driven and disinhibited (PTX). The bar on each data point is 2σ(si < s0, Δti < t0). Each curve represents an average over all experimental samples in a given condition. (a) Normal; (b) Driven; (c) Disinhibited. Insets: The ratio δP(si < s0, Δti < t0)/σ as a function of s0 for different values of t0; dashed lines delimit the interval (−2, 2). In most cases δP(si < s0, Δti < t0)/σ is much larger than 2. Therefore these results are significant at a level generally lower than 0.05 and give solid evidences of correlations between avalanches and following quiet times.
More specifically, δP(si < s0, Δti < t0) monotonically decreases for t0 ≥ 50. In the non-driven case, the maximum of δP(si < s0, Δti < t0) is located at  and moves towards larger s0 with increasing t0, namely including longer Δt in the analysis. This indicates that larger avalanches tend to be followed by longer quiet times. Indeed, we also notice that, for t0 > 400, δP(si < s0, Δti < t0) takes always negative values (Fig. 3a,b). This effect is even stronger in the driven case, implying that it is very unlikely to observe small avalanches followed by long quiet times.
In contrast to normal conditions, disinhibited cultures show a consistent crossover from positive to negative values of δP(si < s0, Δti < t0) (Fig. 3c): For all t0 this quantity is positive for s0 < 4 and negative otherwise. This implies that positive correlations between avalanche sizes and quiet times exist only for small avalanches, which are significantly correlated not only to short following quiet times as in the normal condition, but also to long following quiet times. In particular, we notice that, for s0 < 4, δP(si < s0, Δti < t0) first increases with t0 for t0 < 100, which indicates an overabundance of small avalanches whose following quiet time is shorter than 100 ms, then slowly decreases and eventually goes to zero for t0 = 4000 ms (Fig. 3c). In the intermediate range, 4 < s0 < 10, avalanche sizes are anticorrelated to quiet times, implying that the number of couples satisfying both conditions is smaller than in the uncorrelated time series. Finally all avalanches of size s > 10 are uncorrelated with following quiet times and therefore occur randomly in time. This can be understood in terms of the disinhibiting role of the PTX, which alters the occurrence of large avalanches observed under normal conditions.
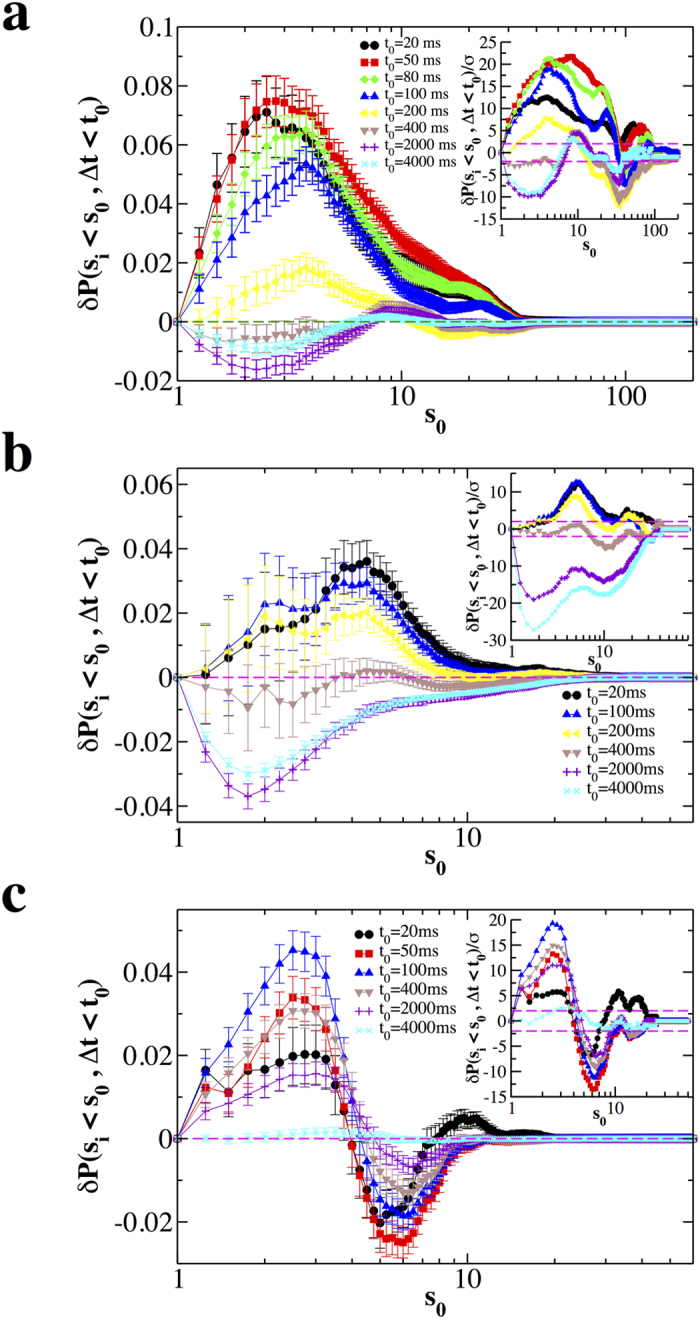
To better enlighten the relationship between si and Δti we consider the quantity δP(Δti < t0, si < s0) (Fig. 4). In the normal conditions, for s0 < 5, δP(Δti < t0, si < s0) is positive for t0 < 200 ms and negative otherwise, decreasing, in absolute value, for increasing s0 values (Fig. 4a,b). This behaviour and the relative maximum observed around t0 = 100 ms, indicate that there is an overabundance of small avalanches whose following quiet time is shorter than 100 ms, suggesting that small avalanches tend to be followed by short, rather than long quiet times. On the other hand, in the disinhibited condition (Fig. 4c), for fixed s0 values, δP(Δti < t0, si < s0) does not transition from positive to negative values and is either always positive or negative, depending on s0. This indicates that the correlation sign depends on avalanche size, whereas in the normal condition it depends on quiet times (Fig. 3a,b). For s0 < 4 δP(Δti < t0, si < s0) is positive and, considering error bars, it is nearly constant over a large range of t0. Therefore we do not observe a very close relationship between small avalanches and short following Δt. Moreover, since for s0 > 6 δP(Δti < t0, si < s0) is always negative or zero, Fig. 4c clearly shows that, in the disinhibited condition, large avalanches are generally uncorrelated to following Δt.
Figure 4. Small avalanches si tend to be followed by short quiet times Δti in normal condition.
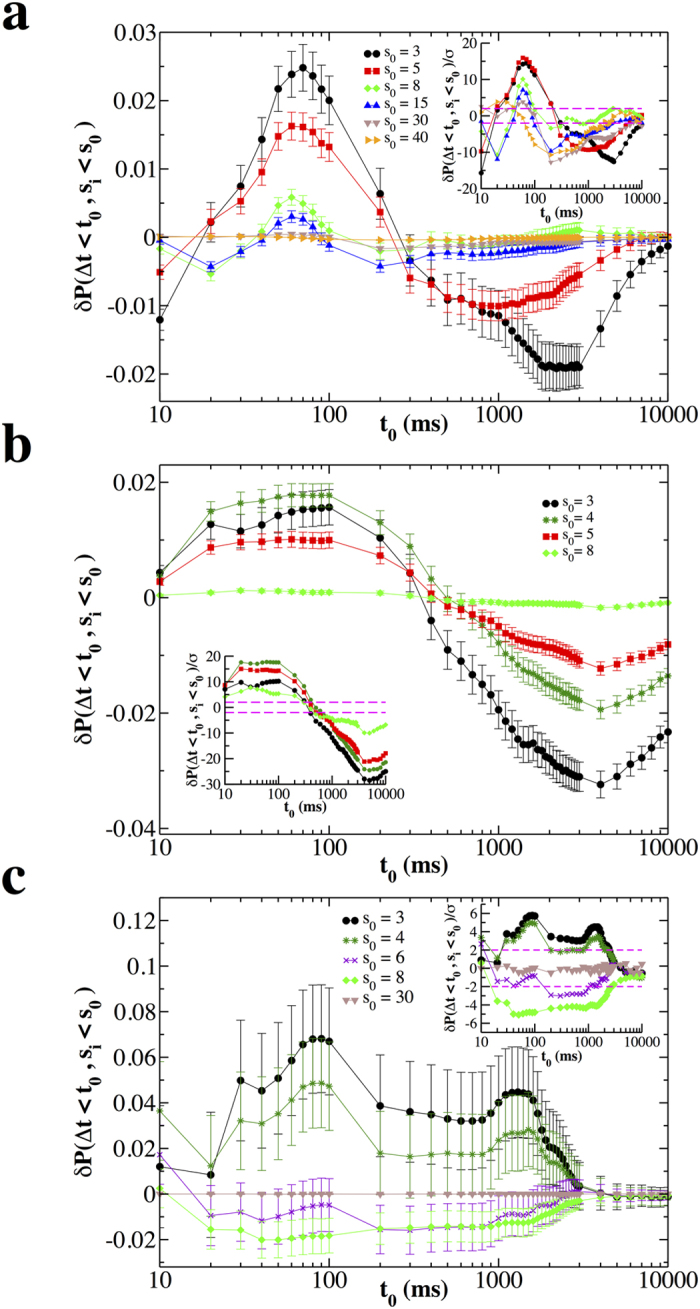
The quantity δP(Δti < t0, si < s0) as a function of t0 and different values of s0. The bar on each data point is 2σ(Δti < t0, si < s0). Each curve represents an average over all experimental samples in a given condition. (a) Non-driven. (b) Driven. (c) Disinhibited (PTX). Insets: The ratio δP(Δti < t0, si < s0)/σ as a function of t0 for different values of s0; dashed lines delimit the interval (−2, 2). In most cases, δP(Δti < t0, si < s0)/σ is much larger than 2. Therefore these results are significant at a level generally lower than 0.05 and give solid evidences of correlations between avalanches and following quiet times.
Correlations between the size s i+1 and the preceding quiet time Δt i
Next we study the relation between the quiet time Δti and the size si+1 of the following avalanche. In this case we analyze the quantity δP(si+1 < s0, Δti < t0), which we show in Fig. 5 as a function of s0 for several values of the threshold t0. Firstly, we discuss the non-driven condition (Fig. 5a) and notice that δP(si+1 < s0, Δti < t0) is always positive and decreases going from t0 = 20 ms to t0 = 4000 ms. When avalanches separated by larger time intervals are progressively included in the analysis, the maximum of δP(si+1 < s0, Δti < t0) consistently shifts towards larger s0 values, suggesting that the longer the quiet time the larger the following avalanche.
Figure 5. Relation between the quiet time Δti and the size si+1 of the following avalanche.
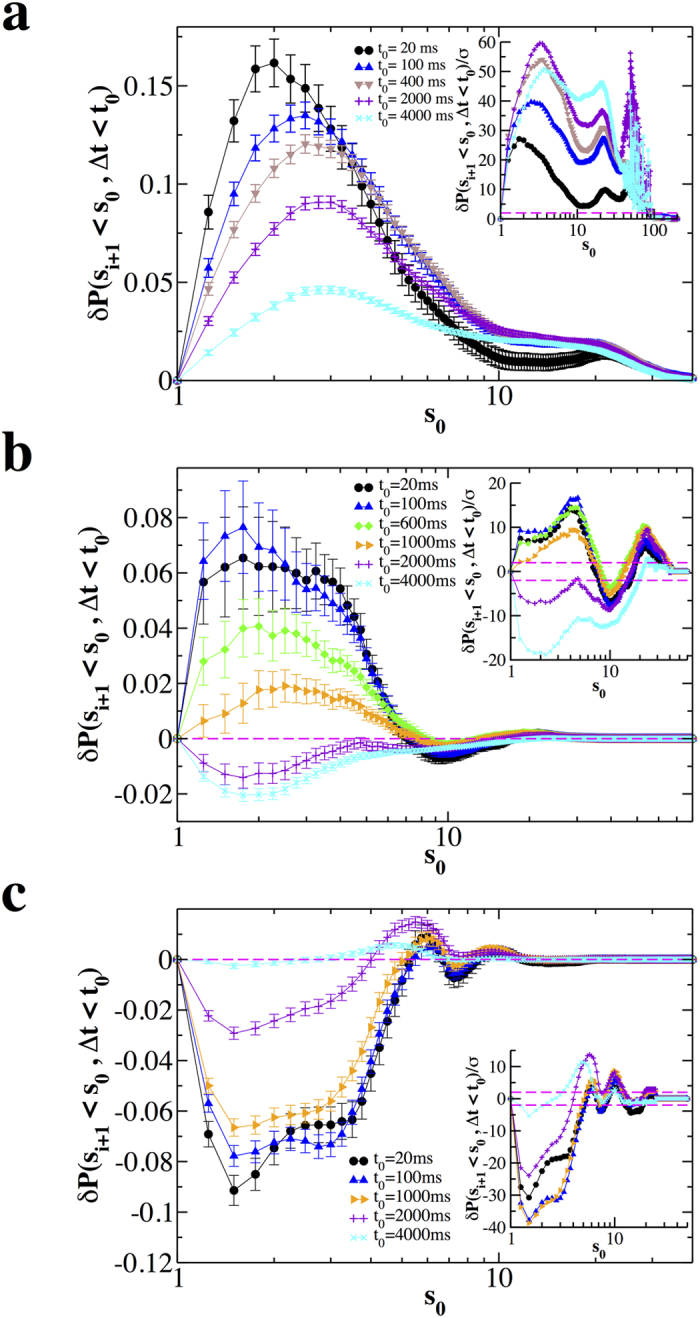
The quantity δP(si+1 < s0, Δti < t0) as a function of s0 for different t0 values and different conditions, non-driven, driven and disinhibited (PTX). Each curve represents an average over all experimental samples in a given condition. The bar on each point is 2σ(si+1 < s0, Δti < t0). (a) Non-driven; (b) Driven; (c) Disinhibited (PTX). Insets: The ratio δP(si+1 < s0, Δti < t0)/σ as a function of s0 for different values of t0; dashed lines delimit the interval (−2, 2). In most cases δP(si+1 < s0, Δti < t0)/σ is much larger than 2. Therefore these results are significant at a level generally lower than 0.05 and give solid evidences of correlations between avalanches and preceding quiet times.
In the driven condition δP(si+1 < s0, Δti < t0) exhibits a similar behaviour (Fig. 5b), namely it decreases for increasing t0 and eventually becomes negative. On the other hand, an important difference with the non-driven case is that the maximum of δP(si+1 < s0, Δti < t0) becomes very wide in the range 1 < s0 < 4 and then rapidly goes to zero for larger s0 values. This behaviour results from the average over cultures and does not characterize single experimental samples, for which δP(si+1 < s0, Δti < t0) has a well localized maximum (see Supplementary Fig. S8). Therefore, when looking at the single culture, the same conclusions drawn for the normal non-driven condition hold for the driven one. However the position of the maximum of δP(si+1 < s0, Δti < t0) varies between s0 = 2 and s0 = 4, depending on the sample (see Supplementary Fig. S8). This effect could be accounted for by the larger average rate of LFPs48 per electrode due to the slow tilting of cultures, which might lead to large avalanches also after relatively short quiet times.
Differently from the normal condition, in the presence of PTX δP(si+1 < s0, Δti < t0) is always negative (Fig. 5c) until avalanche sizes and quiet times become uncorrelated, for Δt ≃ 4 s. This implies that the shorter the quiet time the more unlikely it is to observe small following avalanches. It is worth noticing that, for t0 < 1000 ms, δP(si+1 < s0, Δti < t0) is nearly independent of t0 and, as a consequence, so is the relationship between Δt and si+1.
Correlations between avalanche sizes
In previous sections we have shown that the size of an avalanche is significantly correlated with both the previous and the following quiet time. Here we investigate the relationship between successive synchronous firing events, namely between sizes of consecutive neuronal avalanches. In particular, we ask what is the probability of finding an avalanche whose size si+1 is larger than λ times the size si of the previous one after a quiet time shorter than t0 and consider the quantity δP(si+1 > λsi, Δt < t0). In Fig. 6 we plot this quantity as a function of λ for different values of t0. We first discuss the non-driven case (Fig. 6a). We observe that δP(si+1 > λsi, Δt < t0), and in particular its maximum, decreases by increasing t0, meaning that, correlations in size depend on the time interval separating two avalanches. At short time scales, namely for t0 < 100 ms, δP(si+1 > λsi, Δt < t0) is always positive or zero: Its maximum is located around  , suggesting that, for close-in-time consecutive avalanches, the second one tends to be smaller than the first one. Conversely, for t0 > 200, δP(si+1 > λsi, Δt < t0) is negative for λ < 1 and reaches its maximum at λ > 1. Therefore for larger temporal separation, the second avalanche can be substantially larger than the previous one (Fig. 6a).
Figure 6. Sizes of consecutive avalanches are correlated.
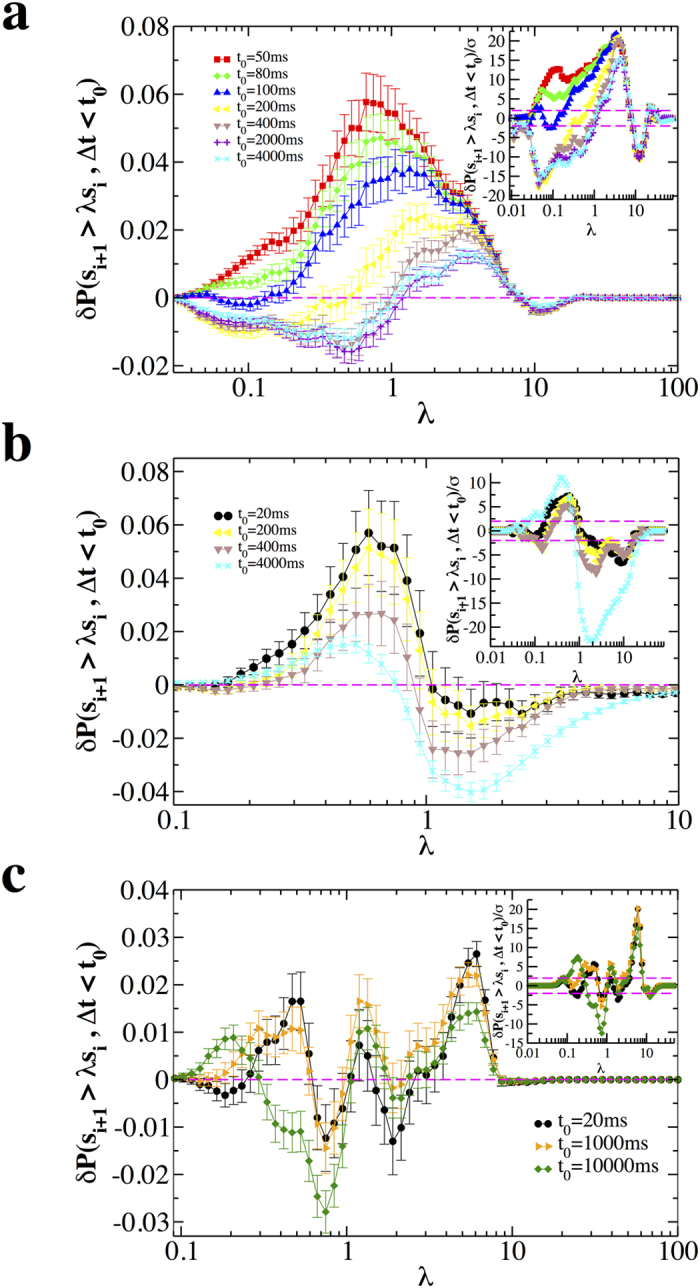
The quantity δP(si+1 > λsi, Δti < t0) as a function of λ for different values of t0 and different conditions, non-driven, driven and disinhibited (PTX). The bar on each data point is 2σ(si+1 > λsi, Δti < t0). Each curve represents an average over all experimental samples in a given condition. (a) Non-driven; (b) Driven; (c) Disinhibited (PTX). Insets: The ratio δP(si+1 > λsi, Δti < t0)/σ as a function of s0 for different values of t0; dashed lines delimit the interval (−2, 2). In most cases δP(si+1 > λsi, Δti < t0)/σ is much larger than 2. Therefore results are significant at a level generally lower than 0.05 and give solid evidences of correlations between consecutive avalanches.
In the driven condition (Fig. 6b) δP(si+1 > λsi, Δt < t0) is always positive for λ < 1 and negative for λ > 1, implying that, independently of the time separation, it is unlikely to observe an avalanche larger than the previous one. At short time scales, the scenario resembles the one observed in the non-driven case. Indeed, for t0 < 200, δP(si+1 > λsi, Δt < t0) is sharply peaked around  , independently of t0. This implies that correlation features do not depend on time separation for Δt <200 ms. For larger values of t0, contrary to the non-driven case, δP(si+1 > λsi, Δt < t0) remains positive for λ <1 and therefore, also for large temporal separations, an avalanche tends to be smaller than the preceding one.
In the presence of PTX, the relationship between sizes of consecutive avalanches exhibits a dramatic change (Fig. 6c). Indeed δP(si+1 > λsi, Δt < t0) repeatedly transitions from positive to negative values and viceversa, showing positive peaks both for λ < 1 and λ > 1. Therefore the sign of correlations depends on the ratio λ between consecutive avalanche sizes and, contrary to the normal condition (Fig. 6a,b), δP(si+1 > λsi, Δt < t0) is nearly independent of the time separation Δt between consecutive avalanches (Fig. 6c). The behaviour of δP(si+1 > λsi, Δt < t0) is strongly sample dependent, namely individual cultures may exhibit either single or multiple peaks (see Supplementary Fig. S12). Therefore, the functional behaviour observed in Fig. 6c results from the average over cultures and does not characterize single experimental samples. Importantly, all cultures exhibit a relative maximum for λ > 1 and for t0 values ranging from 20 ms to 4000 ms (Supplementary Fig. S12), evidencing that in the disinhibited condition, the avalanche process is extremely unbalanced and, given two consecutive avalanches, the second one can be much larger than the first avalanche. We want to stress here that, in contrast to normal conditions, this holds also for consecutive avalanches separated by short quiet times and represents a main feature of disinhibited networks. In other words, when inhibitory transmission is reduced by PTX, the length of the quiescent period does not play a significant role in the dynamics.
Discussion
We have investigated the relationship between quiescence and synchronous bursts in the spontaneous local field potential activity of cortex slice cultures measured with planar integrated microelectrode arrays. Organotypic cortex cultures maintain their main neuronal as well as non-neuronal cell types and cortical layers (refs 6, 26, 46 and 47 and references therein). Specifically, they display spontaneous up- and down-states at low average firing rate similarly to what has been described for the in vivo resting state and avalanche statistics that follows those described in vivo7,20. In our avalanche analysis of this in vitro system, the existence of a non-zero δP indicates that the quiet time Δti depends on the size of the preceding avalanche and, at the same time, determines the size of the following one. This relationship between quiet times and avalanche sizes appears to depend on the condition of the cultures and therefore on the state of the system, which is critical in the normal and supercritical in the disinhibited condition8,47. In the critical state, small avalanches tend to be followed by short, rather than long quiet times. On the other hand, in the supercritical state small avalanches can be followed by a very wide range of Δt, up to 2 s, while large avalanches are uncorrelated with following quiet times. In addition, in the normal, critical state, longer recovery periods are needed for the system to generate large avalanches, whereas in the disinhibited condition short periods of quiescence can be followed by large avalanches. In sum, suppressing inhibition disrupts the relationship between quiescence and bursts that characterizes cortical networks at criticality. The different correlations in the presence of PTX suggest that inhibition plays an important role in the temporal organization of spontaneous activity in the critical state, that is in avalanche termination and triggering. In other words the relationship between quiescence and synchronous firing observed in the normal condition reflects a specific balance between excitation and inhibition, which characterizes the critical state33,47.
A related problem, which can help understanding spontaneous cortical dynamics, is the one of correlations between sizes of consecutive avalanches and their dependence on Δt. The first important question is whether avalanche sizes are correlated and whether these correlations depend on Δt. Here we have shown that the size si+1 of an avalanche following Δti positively correlates with the size si of the preceding one and that this correlation depends on Δt, particularly in the normal condition. Indeed curves corresponding to different values of t0 clearly differ and the larger t0, the smaller the correlations. More precisely, when the time interval elapsed between two consecutive avalanches is shorter than ≃200 ms, the first avalanche tends to be larger than the following one. Conversely, for longer time separation the first avalanche tends to be smaller than the following one. In the case of network disinhibition, this relationship is strongly altered and an avalanche can be considerably larger than the previous one, independently of the quiet time. The fact that this relationship is altered in the disinhibited condition indicates that its underlying mechanism involves inhibitory neurotransmitters. When the normal, critical balance between excitation and inhibition is altered, the relationship between activity and quiescence changes. For short quiet times, the preceding avalanche tends to be small in both cases. On the other hand, the size of the following avalanche is correlated to the previous Δt in the normal condition and anti-correlated otherwise. This is at the origin of the differences in size correlations we observe for short Δts.
Recent studies demonstrate that spontaneous activity is linked to stimulus-evoked activity49,50,51,52,53,54,55,56. For example, the large variability observed in the response to an external stimulus can be accounted for by the fluctuations in the pre-stimulus ongoing activity50. In other words, ongoing and evoked activity do interact with each other. An interesting point that would deserve further investigation is how the structure of temporal correlations in spontaneous activity influences the network response, especially the correlations in neural firing induced by external stimuli. Importantly, it has been shown that neuronal networks maximize the range of stimulus intensity they can process47,57, also called dynamic range, at criticality, namely for the specific temporal correlations we measured in balanced networks. Conversely, when inhibition is suppressed and these correlations change as discussed above, networks fail to discriminate larger inputs47. The analysis we performed therefore allows to link the network response to the pre-stimulus temporal correlations in the framework of neuronal avalanches.
The relationship between quiet times and the size of the following synchronized bursts has been previously reported in several experimental studies13,36,37,38,39. However there was basically no evidence in favor of quiet times being correlated with the size of preceding bursts, except for the work of Streit et al.40 on dissociated cultures of rat spinal neurons. This has led to a model of burst dynamics where network excitability has a resting value which is independent of the previous network firing: No matter the burst size, the network resets to the same level of excitability. Then, the following quiescent period determines the amount of resources available for the next burst and, as a consequence, its size and duration. This conclusion is mainly based on the analysis of scatter plots or similar quantities which can be strongly affected by statistical fluctuations, intrinsic to experimental data. For instance, in our specific case, the scatter plots do not give any clear indication about correlations between sizes and quiet times28.
In order to avoid this problem, our technique compares conditional probabilities evaluated in real and reshuffled time series42,43. This method allowed us to show that correlations between avalanche sizes and following quiet times can be significant, which suggests that the level of excitability of the network might depend on previous firing activity and opens two possible scenarios: (1) The network excitability has a resting value that is activity-dependent, namely the larger the previous avalanche the lower this value, whereas the recovery mechanism towards the following avalanche does not depend on past activity; (2) After an avalanche, the network excitability decays always to the same value, whereas the recovery mechanism depends on past activity in such a way the larger the previous avalanche the longer the quiescent period preceding the triggering of the following one.
In both cases the recovery period keeps memory of past network firings. This point is further supported by the analysis of size correlations. First, sizes of consecutive avalanches are significantly correlated. How could they possibly correlate if the recovery period did not keep track of past activity? Second, correlations not only quantitatively but also qualitatively change when the time separation between consecutive avalanches increases: While for short time separations an avalanche tends to be smaller, after long quiet times it tends to be larger than the previous one. This clearly indicates that quiet times depend on network activity, as suggested by numerical simulations in Lombardi et al.33.
Indeed the quiet time distribution can be reproduced by a model where the level of excitability is homeostatically driven by the network activity33. In particular, after a large avalanche, the network is hyperpolarized proportionally to its past activity and transitions into a down-state. The synaptic activity during a down-state is modeled as a random process that slowly brings the system back into an up-state. As a result, numerical distributions show the same functional behaviour measured experimentally. This suggests that excitability depends on past activity and that this memory becomes weaker after long recovery time, because of the randomness of spontaneous synaptic vesicle releases33.
Additional Information
How to cite this article: Lombardi, F. et al. Temporal correlations in neuronal avalanche occurrence. Sci. Rep. 6, 24690; doi: 10.1038/srep24690 (2016).
Supplementary Material
Acknowledgments
We acknowledge financial support from the SNF project 205321-138074 and the European Research Council (ERC) Advanced Grant FP7-319968-FlowCCS. This study was supported by the Intramural Research Program of the National Institute of Mental Health.
Footnotes
Author Contributions F.L. analyzed the data; F.L., H.J.H., D.P. and L.d.A. wrote the manuscript.
References
- Gutenberg B. & Richter C. F. In Seismicity of the earth and associated phenomena. (Princeton Univ. Press, 1954). [Google Scholar]
- Claycomb J. R., Bassler K. E., Miller J. H., Nersesyan M. & Luss D. Avalanche behaviour in the dynamics of chemical reactions. Phys. Rev. Lett. 87, 178303 (2001). [DOI] [PubMed] [Google Scholar]
- Mendoza M., Kaydul A., de Arcangelis L., Andrade J. S. Jr. & Herrmann H. J. Modelling the influence of photospheric turbulence on solar flare statistics. Nature Commun. 5, 5035 (2014). [DOI] [PubMed] [Google Scholar]
- Lippiello E., de Arcangelis L. & Godano C. Time-energy correlations in solar flares occurrence. Astron. & Astrophys. 511, L2 (2010). [Google Scholar]
- Spasojević D., Bukvić S., Milosević S. & Stanley H. E. Barkhausen noise: elementary signals, power laws, and scaling relations. Phys. Rev. E 54, 2531 (1996). [DOI] [PubMed] [Google Scholar]
- Plenz D. & Aertsen A. Neural dynamics in cortex-striatum co-cultures-II. Spatiotemporal characteristics of neuronal activity. Neuroscience 70, 893–924 (1996). [DOI] [PubMed] [Google Scholar]
- Petermann T. Spontaneous cortical activity in awake monkeys composed of neuronal avalanches. Proc. Natl. Acad. Sci. USA 106, 15921–15926 (2009). [DOI] [PMC free article] [PubMed] [Google Scholar]
- Beggs J. M. & Plenz D. Neuronal avalanches in neocortical circuits. J. Neurosci. 23, 11167–11177 (2003). [DOI] [PMC free article] [PubMed] [Google Scholar]
- Segev R., Shapira Y., Benveniste M. & Ben-Jacob E. Observations and modeling of synchronized bursting in 2D neural networks. Phys. Rev. E 64, 011920 (2001). [DOI] [PubMed] [Google Scholar]
- Segev R. et al. Long term behaviour of lithographically prepared in vitro neuronal networks. Phys. Rev. Lett. 88, 118102 (2002). [DOI] [PubMed] [Google Scholar]
- Pasquale V., Massobrio P., Bologna L. L., Chiappalone M. & Martinoia S. Self-organization and neuronal avalanches in networks of dissociated cortical neurons. J. Neurosci. 153, 1354–1369 (2008). [DOI] [PubMed] [Google Scholar]
- Staley K. J., Longacher M., Bains J. S. & Yee A. Presynaptic modulation of CA3 network activity. Nature Neurosci. 1, 201–209 (1998). [DOI] [PubMed] [Google Scholar]
- Tabak J. & Latham P. E. Analysis of spontaneous bursting activity in random neural networks. Neuro Report 14, 1445–1449 (2003). [DOI] [PubMed] [Google Scholar]
- Eyatan D. & Marom S. Dynamics and effective topology underlying synchronization in networks of cortical neurons. J. Neurosci. 26, 8465–8476 (2006). [DOI] [PMC free article] [PubMed] [Google Scholar]
- He B. J., Zempel J. M., Snyder A. Z. & Raichle M. E. The temporal structures and functional significance of scale free brain activity. Neuron 66, 353–369 (2010). [DOI] [PMC free article] [PubMed] [Google Scholar]
- Novikov E., Novikov A., Shannahoff-Khalsa D., Schwartz B. & Wright J. Scale-similar activity in the brain. Phys. Rev. E 56, R2387–2389 (1997). [Google Scholar]
- Bedard C., Kröger H. & Destexhe A. Does the 1/f frequency scaling of brain signals reflect self-organized critical states? Phys. Rev. Lett. 97, 118102 (2006). [DOI] [PubMed] [Google Scholar]
- Dehghani N., Bedard C., Cash S. S., Halgren E. & Destexhe A. Comparative power spectral analysis of simultaneous elecroencephalographic and magnetoencephalographic recordings in humans. J. Comput. Neurosci. 21, 405–421 (2010). [DOI] [PMC free article] [PubMed] [Google Scholar]
- Pritchard W. S. The brain in fractal time: 1/f-like power spectrum scaling of the human electroencephalogram. Int. Journal of Neurosci. 66, 119–129 (1992). [DOI] [PubMed] [Google Scholar]
- Gireesh D. E. & Plenz D. Neuronal avalanches organized as nested theta-and beta/gamma-oscillations during development of cortical layer 2/3. Proc. Natl. Acad. Sci. USA 105, 7576–7581 (2008). [DOI] [PMC free article] [PubMed] [Google Scholar]
- Mazzoni A. et al. On the dynamics of the spontaneous activity in neuronal networks. PLoS ONE 2, e439, doi: 10.1371/journal.pone.0000439 (2007). [DOI] [PMC free article] [PubMed] [Google Scholar]
- Shriki O. et al. Neuronal avalanches in the resting MEG of the human brain. J. Neurosci. 33, 7079–7090 (2013). [DOI] [PMC free article] [PubMed] [Google Scholar]
- Harris T. E. In The Theory of Branching Processes. (Dover Publications, New York, 1989). [Google Scholar]
- Zapperi S., Lauritsen K. B. & Stanley E. Self-organized branching process: A mean-field theory for avalanches. Phys. Rev. Lett. 75, 4071–4074 (1995). [DOI] [PubMed] [Google Scholar]
- Bak P. In How nature works:the science of self-organized criticality. (Copernicus Press, 1996). [Google Scholar]
- Plenz D. Neuronal avalanches and coherence potentials. Eur. Phys. J. Special Topics 205, 259–301 (2012). [Google Scholar]
- Sanchez R., Newman D. E. & Carreras D. A. Waiting-time statistics of Self-Organized-Criticality Systems. Phys. Rev. Lett. 88, 068302 (2002). [DOI] [PubMed] [Google Scholar]
- Lombardi F., Herrmann H. J., Plenz D. & de Arcangelis L. On the temporal organization of neuronal avalanches. Front. Syst. Neurosci. 8, 204, doi: 10.3389/fnsys.2014.00204 (2014). [DOI] [PMC free article] [PubMed] [Google Scholar]
- Corral A. Long-term clustering, scaling and universality in the temporal occurrence of earthquakes. Phys. Rev. Lett. 92, 108501 (2004). [DOI] [PubMed] [Google Scholar]
- Corral A. Statistical features of earthquake temporal occurrence. Lect. Notes Phys. 705, 191–221 (2007). [Google Scholar]
- de Arcangelis L., Godano C., Lippiello E. & Nicodemi M. Universality in Solar Flare and Earthquake Occurrence. Phys. Rev. Lett. 96, 051102 (2006). [DOI] [PubMed] [Google Scholar]
- Daley D. J. & Vere-Jones D. In An introduction to the theory of point processes. (Springer, New York, 1988). [Google Scholar]
- Lombardi F., Herrmann H. J., Perrone-Capano C., Plenz D. & de Arcangelis L. Balance between excitation and inhibition controls the temporal organization of neuronal avalanches. Phys. Rev. Lett. 108, 228703 (2012). [DOI] [PubMed] [Google Scholar]
- Stevens C. F. & Tsujimoto T. Estimates for the pool size of releasable quanta at a single central synapse and for the time required to refill the pool. Proc. Natl. Acad. Sci. USA 92, 846–849 (1995). [DOI] [PMC free article] [PubMed] [Google Scholar]
- Maeda E., Robinson H. P. & Kawana A. The mechanisms of generation and propagation of synchronized bursting in developing networks of cortical neurons. J. Neurosci. 15, 6834–6845 (1995). [DOI] [PMC free article] [PubMed] [Google Scholar]
- Tabak J., Rinzel J. & O’Donovan M. J. The role of activity-dependent network depression in the expression and self-regulation of spontaneous activity in the developing spinal cord. J. Neurosci. 21 8966–8978 (2001). [DOI] [PMC free article] [PubMed] [Google Scholar]
- Streit J. Regular oscillations of synaptic activity in spinal networks in vitro. J. Neurophysiol. 70, 871–878 (1993). [DOI] [PubMed] [Google Scholar]
- Tabak J. & O’Donovan M. J. Statistical analysis and intersegmental delays reveal possible roles of network depression in the generation of spontaneous activity in the chick embryo spinal cord. NY Acad. Sci. 860, 428–431 (1998). [DOI] [PubMed] [Google Scholar]
- Grzywacz N. & Sernagor E. Spontaneous activity in developing turtle retinal ganglion cells: statistical analysis. Visual Neurosci. 17, 229–241 (2000). [DOI] [PubMed] [Google Scholar]
- Streit J., Tscherter A., Heuschkel M. O. & Renaud P. The generation of rhythmic activity in dissociated cultures of rat spinal cord. Eur. J. Neurosci 14, 191–202 (2001). [DOI] [PubMed] [Google Scholar]
- Timofeev I., Grenier F., Bazhenov M., Sejnowski T. J. & Steriade M. Origin of slow cortical oscillation in deafferented cortical slabs. Cer. Cortex. 10, 1185–1199 (2000). [DOI] [PubMed] [Google Scholar]
- Lippiello E., de Arcangelis L. & Godano C. Influence of time and space correlations on earthquake magnitude. Phys. Rev. Lett. 100, 038501 (2008). [DOI] [PubMed] [Google Scholar]
- Lombardi F., Chialvo D. R., Herrmann H. J. & de Arcangelis L. Strobing brain thunders: Functional correlation of extreme activity events. Chaos, Solitons & Fractals 55, 102–108 (2013). [Google Scholar]
- Amor T. A. et al. Extreme brain events: Higher order statistics of brain resting activity and its relation with structural connectivity. Europhys. Lett. 111, 68007 (2015). [Google Scholar]
- Theiler J., Eubank S., Longtin A., Galdrikian B. & Farmer J. D. Testing nonlinearity in time series: the method of surrogate data. Physica D 58, 77–94 (1992). [Google Scholar]
- Stewart C. V. & Plenz D. Homeostasis of neuronal avalanches during postnatal cortex development in vitro. J. Neurosci. Meth. 169, 405–416 (2007). [DOI] [PMC free article] [PubMed] [Google Scholar]
- Shew W., Yang H., Petermann T., Roy R. & Plenz D. Neuronal avalanches imply maximum dynamic range in cortical networks at criticality. J. Neurosci. 29, 15595–15600 (2009). [DOI] [PMC free article] [PubMed] [Google Scholar]
- Plenz D. & Chialvo D. R. Scaling properties of neuronal avalanches are consistent with critical dynamics. arXiv:09125369 (2009).
- Arieli A., Shoham D., Hildesheim R. & Grinvald A. Coherent spatiotemporal patterns of ongoing activity revealed by real-time optical imaging coupled with single-unit recording in the cat visual cortex. J. Neurophysiol. 73, 2072–2093 (1995). [DOI] [PubMed] [Google Scholar]
- Arieli A., Sterkin A., Grinvald A. & Aertsen A. Dynamics of ongoing activity: explanation of the large variability in evoked cortical responses. Science 273, 1868–1871 (1996). [DOI] [PubMed] [Google Scholar]
- Azouz R. & Gray C. M. Cellular mechanism contributing to response variability of cortical neurons in vivo. J. Neurosci. 19, 2209–2223 (1999). [DOI] [PMC free article] [PubMed] [Google Scholar]
- Chiu C. & Weliky M. Spontaneous activity in developing ferret visual cortex. J. Neurosci. 21, 8906–8914 (2001). [DOI] [PMC free article] [PubMed] [Google Scholar]
- Fiser J., Chiu C. & Weliky M. Small modulation of ongoing cortical dynamics by sensory input during natural vision. Nature 431, 573–578 (2004). [DOI] [PubMed] [Google Scholar]
- Fox M. D., Snyder A. Z., Zacks J. M. & Raichle M. E. Coherent spontaneous activity accounts for trial-to-trial variability in human evoked brain responses. Nat. Neurosci 9, 23–25 (2006). [DOI] [PubMed] [Google Scholar]
- He Biyu J. Spontaneous and task-evoked brain activity negatively interact. J. Neurosci. 33, 4672–4682 (2013). [DOI] [PMC free article] [PubMed] [Google Scholar]
- Hesselmann G., Kell C. A., Eger E. & Kleinschmidt A. Spontaneous local variations in ongoing neural activity bias perceptual decisions. Proc. Natl. Acad. Sci. USA 105, 10984–10989 (2008). [DOI] [PMC free article] [PubMed] [Google Scholar]
- Kinouchi O. & Copelli M. Optimal dynamical range of excitable networks at criticality. Nat. Phys. 2, 348–352 (2006). [Google Scholar]
Associated Data
This section collects any data citations, data availability statements, or supplementary materials included in this article.