

Abstract
The development of hemispheric lateralization for language is poorly understood. In one hypothesis, early asymmetric gene expression assigns language to the left hemisphere. In an alternate view, language is represented a priori in both hemispheres and lateralization emerges via cross-hemispheric communication through the corpus callosum. To address this second hypothesis, we capitalized on the high temporal and spatial resolution of magnetoencephalographic imaging to measure cortical activity during language processing, speech preparation, and speech execution in 25 participants with agenesis of the corpus callosum (AgCC) and 21 matched neurotypical individuals. In contrast to strongly lateralized left hemisphere activations for language in neurotypical controls, participants with complete or partial AgCC exhibited bilateral hemispheric activations in both auditory or visually driven language tasks, with complete AgCC participants showing significantly more right hemisphere activations than controls or than individuals with partial AgCC. In AgCC individuals, language laterality positively correlated with verbal IQ. These findings suggest that the corpus callosum helps to drive language lateralization.
SIGNIFICANCE STATEMENT The role that corpus callosum development has on the hemispheric specialization of language is poorly understood. Here, we used magnetoencephalographic imaging during linguistic tests (verb generation, picture naming) to test for hemispheric dominance in patients with agenesis of the corpus callosum (AgCC) and found reduced laterality (i.e., greater likelihood of bilaterality or right hemisphere dominance) in this cohort compared with controls, especially in patients with complete agenesis. Laterality was positively correlated with behavioral measures of verbal intelligence. These findings provide support for the hypothesis that the callosum aids in functional specialization throughout neural development and that the loss of this mechanism correlates with impairments in verbal performance.
Keywords: corpus callosum, hemispheric specialization, language, magnetoencephalography
Introduction
Specialization of the left hemisphere for language function is a prime example of neocortical hemispheric lateralization, a process hypothesized to be primarily genetically determined and evident at an early developmental stage (Bishop, 2013). Early specification of functional asymmetry is based on gene expression (e.g., LMO4; Sun et al., 2005), twin studies (Geschwind et al., 2002, Annett, 2003, Badzakova-Trajkov et al., 2010), and neuroimaging data (van Rijn et al., 2008; Whalley et al., 2011, Pinel et al., 2012). These investigations all suggest that gene expression asymmetries may predispose one hemisphere to “take the lead” in localizing specific aspects of language-based information processing preferentially to one hemisphere.
An alternative to this genetically driven hypothesis for hemispheric specialization of language is a model in which the corpus callosum plays a key role during prenatal and postnatal development through cross-hemispheric communication (Jeeves and Temple, 1987). Support for this hypothesis comes from studies combining traditional measures of lateralization [e.g., intracarotid amobarbital protocol, dichotic listening] or functional (e.g., functional MRI) and anatomical assessments [e.g., morphometry, diffusion tensor imaging]. Although these studies suggest a relationship between callosal anatomy (e.g., size, diffusivity) and degree of hemispheric specialization for language, the direction of the relationship is unclear, with some studies demonstrating that left hemisphere dominance depends on smaller/efficient callosa (Hines et al., 1992; Yazgan et al., 1995; O'Kusky et al., 1988; Häberling et al., 2011) and others suggesting the reverse (Westerhausen et al., 2006; Josse et al., 2008). In clinical populations with language deficits, callosal abnormalities can accompany atypical (rightward or bilateral) hemispheric lateralization (Alexander et al., 2007; Kleinhans et al., 2008; Roberts et al., 2010; Whitehouse and Bishop, 2008; Frazier and Hardan, 2009; Hardan et al., 2009; Cao et al., 2010; Knaus et al., 2010; Anderson et al., 2011; Heim et al., 2014).
Testing language function in individuals with agenesis of the corpus callosum (AgCC) provides a unique opportunity to probe the hypothesis that the corpus callosum plays a causal role in establishing functional asymmetry. The corpus callosum may establish functional asymmetry during development by facilitating language function in the left hemisphere while simultaneously suppressing specialization in the right hemisphere. If true, one might predict that full and normal callosal development would lead to a left hemisphere specialization of language, a pattern typically seen in normally developing individuals. In the case of dysgenesis (partial agenesis; pAgCC), this developmental balance of facilitation and suppression would become compromised, possibly leading to bilateral representation of language. A total lack of formation of this structure (complete agenesis; cAgCC) would lead to a profound loss of leftward laterality concurrent with unrestricted development in the right hemisphere and a potential shift to rightward language lateralization. Alternatively, if hemispheric lateralization is not dependent on callosal formation and instead is more related to earlier developmental influences, then corpus callosum absence would have little or no effect on hemispheric specialization.
The present study examines language function and laterality in AgCC through the high temporal resolution of novel magnetoencephalographic imaging (MEGI) methods during two language tasks, auditory verb generation and picture naming. Analysis of MEGI, a neuroimaging approach providing precise source localizations during language tasks, allows us to study the timing and location in the cortex from linguistic processing to speech preparation and execution. Examining changes in beta (12–30 Hz) oscillations between the two hemispheres through MEGI has been shown to be a robust way to explore hemispheric dominance for language concordant to findings generated using IAP (Findlay et al., 2012). We hypothesized that compromised or even absence of callosal fibers contributes to the inability to localize language function to the left hemisphere in AgCC, impacting typical hemispheric lateralization and instead presenting, in these patients, either right hemisphere or bilateral representation of language.
Materials and Methods
Participants.
25 patients with AgCC (17 male, 8 female; Tables 1, 2, 3, 4) were recruited through the University of California–San Francisco (UCSF) Brain Development Research Program (https://brain.ucsf.edu). Of the 25 AgCC patients, 13 had complete agenesis of the corpus callosum and 12 had partial agenesis of the corpus callosum. Twenty-one neurotypical control (NC) participants were recruited from the greater San Francisco Bay Area. Subsets of these cohorts were used for group comparisons, and were matched for age, sex, handedness, and full-scale IQ (FSIQ). The mean FSIQ for the matched AgCC cohort was 100.4 (SD = 12.4) and for the NC cohort was 104.1 (SD = 7.1). FSIQ for the cAgCC and pAgCC split cohorts were 91.7 (SD = 13) and 100.9 (SD = 13.7), respectively. The diagnosis of AgCC was made based on radiographic review by at least two of the authors based on published criteria (E.H.S., A.J.B., and P.M.; Hetts et al., 2006). Participants with callosal agenesis were a mixture of those who were identified for clinical indications (developmental delay, seizures, autism) and those who found out incidentally from brain imaging for head trauma or headache. In the higher-functioning adult cohort, more incidental cases were found than in the children enrolled in the study. All participants were assessed with a comprehensive research battery including medical history, physical and neurological examination, genetic testing, neuropsychological evaluation, and diagnostic MR imaging. This study was approved by the UCSF Committee on Human Research. All participants gave written informed consent to participate.
Table 1.
Demographic data for the cAgCC cohort
| ID | Age | Handedness | Sex | VIQ | PIQ | FSIQ | Medications | Diagnoses |
|---|---|---|---|---|---|---|---|---|
| cAgCC01 | 57 | R | M | 83 | 76 | 78 | Levetiracetam, gabapentin | Shapiro syndrome, hypogonadotropic hypogonadism |
| cAgCC02 | 14 | L | M | 91 | 92 | 88 | Dextroamphetamine | Treated hydrocephalus, ADHD |
| cAgCC03 | 17 | R | F | 91 | 112 | 102 | None | None |
| cAgCC04 | 18 | R | M | 112 | 109 | 111 | None | None |
| cAgCC05 | 26 | R/L | F | 99 | 109 | 103 | None | Depression & Auditory Hallucinations |
| cAgCC06 | 20 | L | F | 83 | 91 | 86 | None | None |
| cAgCC07 | 33 | R | M | 90 | 118 | 104 | None | ASD |
| cAgCC08 | 37 | R | M | 92 | 109 | 97 | None | Cognitive Impairment |
| cAgCC09 | 36 | R | M | 114 | 104 | 112 | Lamictal, concerta | Asperger's, ADHD, anxiety, depression |
| cAgCC10 | 22 | R | F | 73 | 79 | 74 | Fluoxetine | Depression, anxiety, developmental delay (cognitive and motor impairment) |
| cAgCC11 | 25 | L | M | 90 | 94 | 91 | None | ADHD, hyperadreneopathy, epilepsy |
| cAgCC12 | 20 | L | F | 65 | 73 | 73 | None | ADHD |
| cAgCC13 | 42 | L | M | 86 | 91 | 86 | Escitalopram | ADHD, depression |
VIQ, Verbal IQ; PIQ, Performance (nonverbal) IQ; FSIQ, Full Scale IQ.
Table 2.
Demographic data for the pAgCC cohort
| ID | Age | Handedness | Sex | VIQ | PIQ | FSIQ | Medications | Diagnoses |
|---|---|---|---|---|---|---|---|---|
| pAgCC01 | 24 | L | M | 95 | 92 | 94 | Alprazolam | Migraine, cognitive impairment, anxiety |
| pAgCC02 | 37 | L | M | 100 | 112 | 107 | None | Migraine |
| pAgCC03 | 37 | R (most) | F | 110 | 87 | 100 | None | Depression, migraine |
| pAgCC04 | 34 | L | M | 77 | 109 | 90 | Roic acid, Prozac | ASD, OCD, epilepsy |
| pAgCC05 | 48 | R/L | F | 135 | 116 | 129 | None | None |
| pAgCC06 | 49 | L | M | 100 | 122 | 110 | None | Migraine |
| pAgCC07 | 36 | R | M | 96 | 91 | 93 | None | None |
| pAgCC08 | 31 | R | M | 111 | 114 | 114 | None | Tremor |
| pAgCC09 | 19 | R | F | 90 | 79 | 83 | None | None |
| pAgCC10 | 43 | R | M | 105 | 100 | 103 | None | Sleep apnea, migraine |
| pAgCC11 | 70 | R | M | 78 | 87 | 80 | Diazepam, fentanyl, hydromorphone, percocet | Diabetes, sleep apnea, cerebrovascular/cardiovascular disease |
| pAgCC12 | 19 | L | M | 101 | 107 | 105 | None | None |
VIQ, Verbal IQ; PIQ, Performance (nonverbal) IQ; FSIQ, Full Scale IQ.
Table 3.
Radiological findings for the cAgCC cohort
| ID | CC | PB | AC | HC | CO | WM | Other MRI |
|---|---|---|---|---|---|---|---|
| cAgCC01 | Absent | + | Nl | − | − | Mild | None |
| cAgCC02 | Absent | + | Lg | − | + | Mild | Indeterminate cyst |
| cAgCC03 | Absent | + | Lg | − | + | Mild | None |
| cAgCC04 | Absent | + | Lg | − | + | Mod | None |
| cAgCC05 | Absent | + | Nl | − | + | Mod | Perisylvian polymicrogyria and posterior fossa arachnoid cyst |
| cAgCC06 | Absent | + | Nl | − | + | Mod | None |
| cAgCC07 | Absent | + | Nl | − | + | Severe | Periventricular heterotopia and right cerebellar dysplasia |
| cAgCC08 | Absent | + | Lg | − | + | Mod | Frontal subcortical heterotopia, frontal polymicrogyria |
| cAgCC09 | Absent | + | Lg | − | + | Severe/Mod | None |
| cAgCC10 | Absent | + | Sm | − | + | Mild | Bilateral trigonal/occipital heterotopia |
| cAgCC11 | Absent | + | Nl | − | + | Mod | Left frontal subcortical heterotopia, Type II cyst |
| cAgCC12 | Absent | Indet | Sm | − | + | Mod | Trigonal and parietal subcortical heterotopia |
| cAgCC13 | Absent | + | Nl | − | + | Mild | Periventricular heterotopia |
CC, Corpus callosum abnormalities; PB, Probst bundles (+ = present, − = absent, Indet = indeterminate); AC, anterior commissure (Nl = normal, Lg = large, Sm = small); HC, hippocampal commissure; CO, colpocephaly; WM, white matter degradation.
Table 4.
Radiological findings for the pAgCC cohort
| ID | CC | PB | AC | HC | CO | WM | Other MRI |
|---|---|---|---|---|---|---|---|
| pAgCC01 | Small remnant of anterior body | + | Nl | + | + | Mod | None |
| pAgCC02 | Absent rostrum, inferior genu, thin anterior body, absent splenium | + | Nl | − | − | Nl | None |
| pAgCC03 | Dysplastic with absent genu, superior body and splenium | + | Lg | + | + | Mod | Interhemispheric cyst |
| pAgCC04 | Absent rostrum, superior genu, body and splenium | + | Nl | − | + | Mod | Polymicrogyria, periventricular heterotopia and interhemispheric cyst |
| pAgCC05 | Absent inferior genu, posterior body and splenium | − | Lg | − | − | Nl | None |
| pAgCC06 | Absent rostrum, superior genu, body and splenium | + | Lg | − | + | Mild | None |
| pAgCC07 | Absent rostrum, inferior genu hypoplastic, posterior body and splenium absent | − | Nl | Indet | − | Mild | None |
| pAgCC08 | Posterior genu, anterior body present only | + | Lg | − | + | Mild | Large interhemispheric glioma |
| pAgCC09 | Absence of posterior body | − | − | + | − | Mild | Large ventricles |
| pAgCC10 | Absent rostrum, thined callosal body. Isthmus pinched off, splenium small | + | − | + | − | Mild | None |
| pAgCC11 | Anterior body present | + | Lg | − | + | Mild | None |
| pAgCC12 | Absent superior genu, body and splenium | + | Sm | + | + | Severe | Abnormal medial temporal cortical folding |
CC, Corpus callosum abnormalities; PB, Probst bundles (+ = present, − = absent, Indet = indeterminate); AC, anterior commissure (Nl = normal, Lg = large, Sm = small); HC, hippocampal commissure; CO, colpocephaly; WM, white matter degradation.
MEG data acquisition.
Magnetic fields were recorded in a shielded room using a whole-head 275 axial gradiometer MEG system with third-order gradient correction (MEG International Services) at a sampling rate of 1200 Hz. Three fiducial coils (nasion, left/right preauricular) were placed to localize the position of the head relative to the sensor array. Head localization was performed at the beginning and ending of the collection to register head position and to measure head movement during the task.
Stimulus presentation.
At the beginning of every MEG scan session, all subjects participated in a simple auditory stimulus presentation condition in order for auditory evoked field (AEF) localization. In this task, a 1 kHz pure tone (400 ms duration) was presented in three separate runs: (1) binaurally, (2) right ear alone, and (3) left ear alone. One hundred trials of each stimulus type (binaural, left ear, right ear) were presented in three separate runs.
Task.
All subjects participated in an auditory verb generation task (VG; Findlay et al., 2012) consisting of 100 nouns presented at a comfortable volume through earphones every 4 s. Subjects were instructed to think of a verb or “action word” associated with the noun presented at the beginning of the trial and to speak the verb into a megaphone attached to a microphone at the foot of the bed. For group matching (11 right handers and 6 females in both cohorts; unpaired t test for FSIQ and Age both p > 0.1), VG data were used from 19/25 AgCC (9 cAgCC) and 19/21 NC participants. In addition to the auditory verb generation task, 14 patients with AgCC (7 cAgCC) and 14 NC participants engaged in the picture naming (PN) test (Kaplan et al., 1983) during a separate run within the same scan session. For the test, an image of an object is projected onto a screen (100 trials) and subjects are instructed to name the pictured object into the microphone. Stimulus onset (auditory verb presentation for VG; visual picture stimulus for PN) and vocal responses were digitized on separate analog-to-digital channels, marked through amplitude threshold detection, and verified by hand through visual inspection manually in each dataset.
Behavioral performance.
To test whether callosal agenesis causes observable behavioral deficits during performance of the two tasks, we first examined reaction time during the two language tasks in AgCC patients and matched controls. Patients with complete and partial callosal agenesis had significantly slower reaction times only in the verb generation task (F = 4.67, p = 0.02) compared with NCs (1.32 s), with the complete AgCC patients being slower (1.77 s) than those with partial AgCC (1.55 s). Reaction times with picture naming was similar between groups.
MEG data analysis.
Before data analysis, both noisy MEG sensors and trials with either artifact (eye blink, EMG artifact, or other obvious sensor artifact exceeding 10 pT), no responses and false starts (vocal responses 300 ms before stimulus presentation) were removed from the datasets. AEF datasets were averaged and neural sources were spatiotemporally estimated using an adaptive spatial filtering technique (Wipf et al., 2010).
Datasets were reconfigured into stimulus-locked (auditory stimulus = 0 ms) and response-locked (onset of the vocal response = 0 ms) formats for separate analyses. Spatiotemporal estimates of neural sources were generated using a time–frequency optimized adaptive spatial filtering technique implemented in the Neurodynamic Utility Toolbox for MEG (NUTMEG; http://nutmeg.berkeley.edu). This approach allowed us to observe non-phase-locked changes in brain activity, measured as either a significant negative or positive change in the modulation of oscillatory activity. A tomographic volume of source locations (voxels) was computed through an adaptive spatial filter (8 mm lead field) that weights each location relative to the signal of the MEG sensors (Dalal et al., 2008). Source power for each location was derived through a noise-corrected pseudo-F statistic expressed in logarithmic units (decibels) comparing signal magnitude during an “active” experimental time window versus a baseline “control” window (Robinson and Vrba, 1999). Experimental time windows during the stimulus-locked and response-locked periods were compared versus a 250 ms resting (intertrial) baseline window. We focus on source-space reconstructions in the beta (12–30 Hz) band given that suppression in this frequency range related to cortical activation in the left hemisphere is commonly observed in linguistic tasks (Hirata et al., 2004; Findlay et al., 2012; Wang et al., 2012) and is known to have high concordance with IAP data for language lateralization (Findlay et al., 2012). Data were passed through a 12–30 Hz filter bank and partitioned into partially overlapping time windows using broad windows (250 ms, 50 ms step size) optimized for capturing spectral peaks in the MEG signal (Dalal et al., 2008).
A high-resolution anatomical MRI was obtained for each subject and spatially normalized (standard MNI template, SPM2; http://www.fil.ion.ucl.ac.uk/spm/software/spm2/) with the resulting parameters being applied to each individual subject's reconstruction through Nutmeg. Group analyses to evaluate effects at the second level were performed with statistical nonparametric mapping (Singh et al., 2003). To minimize spatial frequency noise in the beamformer volumes, average and variance maps for each individual time window were calculated and smoothed using a Gaussian kernel with a width of 20 × 20 × 20 mm FWHM (Barnes et al., 2004). From these volumes, a pseudo-F statistic is obtained for each voxel, time window, and frequency band. Statistical significance was estimated by obtaining a permuted distribution (through 2N possible combinations of negations) and estimating the significance of each pseudo-F value from its position in this permuted distribution (Singh et al., 2003). Multiple-comparisons corrections were applied using an adaptive two-step false discovery rate (FDR; Benjamini and Hochberg, 2000) on statistical maps thresholded at p < 0.01 uncorrected.
VOI definition and laterality index.
Laterality index (LI) was derived from methods outlined in Findlay et al., 2012. Changes in beta oscillatory power were extracted from volumes of interest (VOIs) defined a priori for the purpose of LI estimation. Voxels within each spatially normalized time–frequency reconstruction were tagged with MNI labels corresponding to anatomical structure. Two large VOIs were created based on previous magnetoencephalographic imaging studies (Hirata et al., 2004; Findlay et al., 2012). VOI-TP (temporal-parietal speech areas) contained voxels labeled as superior temporal gyrus or supramarginal gyrus; VOI-F (frontal speech areas) contained voxels labeled as inferior frontal gyrus, middle frontal gyrus, or precentral gyrus (Findlay et al., 2012). From these VOIs, pseudo-F values were selected from the 650 to 850 ms after the stimulus onset time window for stimulus-locked analyses and −850 to −650 ms preresponse in response-locked analyses and averaged within each VOI for each participant as in Findlay et al. (2012).
LI was calculated by averaging across activation in the VOIs of the left and right hemisphere separately across the stimulus- and response-locked VG tasks. Under the assumption that greater beta-power decrease (a marker of functional activation) in one hemisphere versus the other was associated with stronger lateralization, we used the following formula: LI = −1 * (L − R)/(|L| + |R|), where L represents the averaged F-value in the left VOI and R represents the averaged F-value in the right VOI. An LI value of +1 or −1 would indicate greater beta-power decrease in the left or right hemisphere, respectively. Stimulus-locked LI was estimated using the three most significant time points for the stimulus-locked condition within VOI-TP and a “response-locked” LI was calculated similarly for the response-locked condition within VOI-F. Total LI was calculated by averaging each subject's stimulus- and response-locked LIs.
Results
Bilateral cortical activity in AgCC during early stages of neural processing for language
We hypothesized that an anatomically and functionally typical corpus callosum contributes to the early stages of neural processing for language, during which cortical activity is often observed to be lateralized in the left hemisphere. To test this theory, we compared the difference in cortical activity during these early stages of auditory driven linguistic processing between 19 AgCC participants and matched NCs. Using MEGI, we examined whole-brain fluctuations in beta (12–30 Hz) oscillatory activity in the period after auditory noun presentation (0 ms) up until 900 ms after noun presentation in the verb generation task (stimulus-locked analysis; Fig. 1). We focus on this 0–900 ms period (and specifically oscillations in the beta band between the period of 600 ms-900 ms poststimulus onset) because this activation strongly correlates with lateralization assessed by conventional IAP testing (Findlay et al., 2012). In the NC cohort, we replicated the sequence of oscillatory activity fluctuations (reductions in beta power) described previously (Findlay et al., 2012). The strongest lateralized activations were observed (p < 0.05, 0.05% FDR correction) in the left hemisphere in the frontal motor regions (precentral gyrus, 550 ms) and spread posteriorly to include regions in the superior occipital gyrus (750 ms), middle temporal gyrus, and posterior parietal cortex (750 ms; Fig. 1A). All activations above statistical threshold in the NC cohort were confined to the left hemisphere. In the AgCC cohort, a similar progression of activity over the left hemisphere was also identified (Fig. 1A). In addition to this left hemisphere activity, during similar time periods, significant activations over the right hemisphere were present, specifically over the precentral gyrus (550 ms) and middle frontal gyrus (Fig. 1B). This finding demonstrates that AgCC individuals have bilateral cortical activations in the early stages of linguistic processing.
Figure 1.
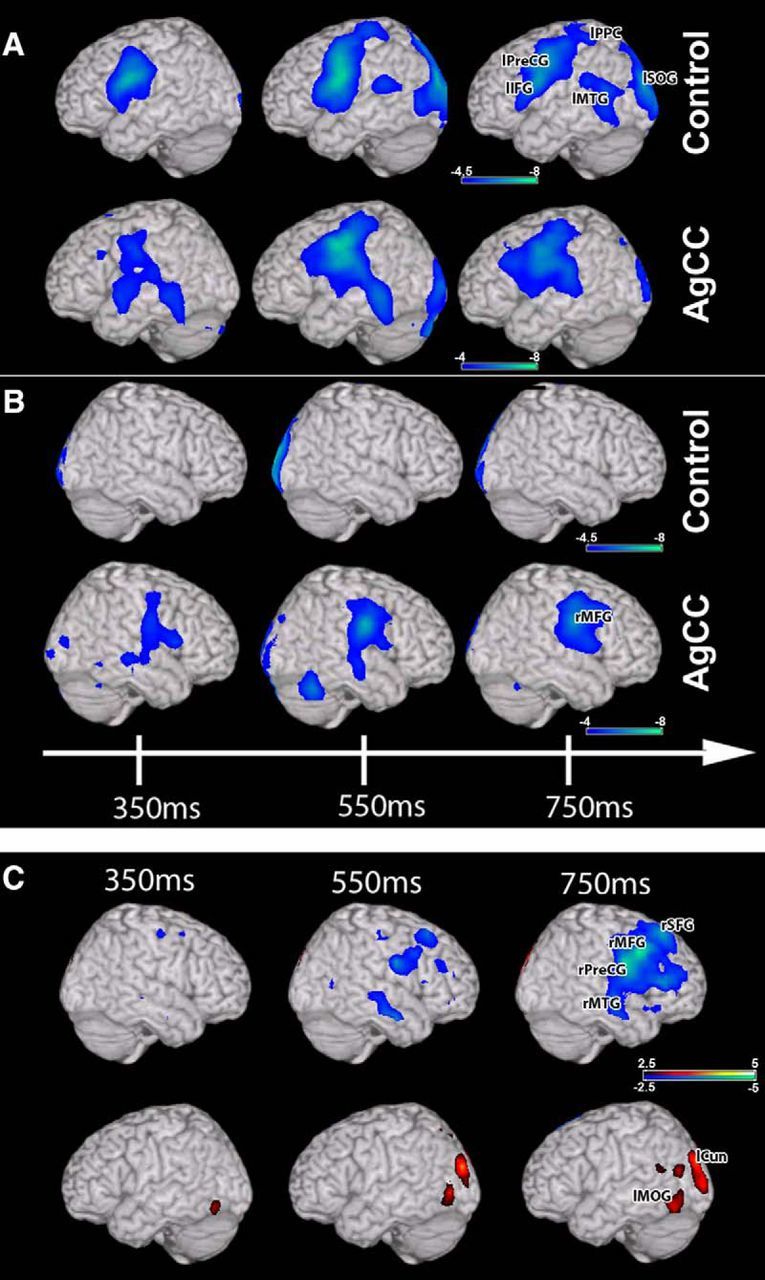
Stimulus-locked (0 ms = auditory noun onset) group analyses of changes in beta (12–30 Hz) oscillatory power during auditory verb generation. A, Changes in beta power over the left hemisphere (one-sample t test). Robust reductions in beta power are seen over the left hemisphere in both the control and AgCC cohorts. B, Changes in beta power over the right hemisphere. Changes in frontal and temporal beta power are present only in AgCC. C, Comparison (unpaired nonparametric t test) between the control and AgCC groups. Significant increases in activity (in blue) over frontal and temporal regions are present in only the right hemisphere. Minor decreases in activity (in red) are present in the posterior regions of the temporal lobe and occipital lobe. Abbreviations are as in Table 5. All images are statistically thresholded and superimposed on a MRI template brain using MRICro.
Comparing the NC and AgCC cohort directly shows statistically different (p < 0.05, 1% FDR correction) activation for the AgCC group only for the later time windows (550–750 ms) after auditory noun presentation (Fig. 1C). In the left hemisphere, less activation was observed in the AgCC cohort in the posterior cortical fields outside of the language network in the cuneus (p = 0.0017) and middle occipital gyrus (p = 0.002; Fig. 1C, red, Table 5), whereas, in the right hemisphere, greater activation was observed over right temporal (middle temporal gyrus; p = 0.0006) and frontal cortices (precentral gyrus; p = 0.0002; Fig. 1C, blue, Table 5). Differences in activity were present for both cAgCC and pAgCC participants compared with the NC group (Fig. 2). This enhanced right hemisphere activity for AgCC participants was the most significant in the 600–700 ms poststimulus time window, a time period in MEG reconstructions shown to be highly concordant with hemispheric lateralization determined through IAP (Findlay et al., 2012). This analysis demonstrates that bilateral cortical activations in AgCC patients arose from enhanced right hemispheric activity during early stages of linguistic processing.
Table 5.
| Region | x | y | z | Time | p |
|---|---|---|---|---|---|
| VG task: stimulus-locked | |||||
| Right middle frontal gyrus | 60 | 15 | 40 | 750 ms | 0.00005 |
| Right precentral gyrus | 60 | −5 | 30 | 750 ms | 0.00002 |
| Right superior frontal gyrus | 20 | 30 | 55 | 750 ms | 0.00003 |
| Right middle temporal gyrus | 60 | −15 | −10 | 750 ms | 0.00006 |
| Left cuneus | −30 | −90 | 25 | 550 ms | 0.00170 |
| Left middle occipital gyrus | −50 | −70 | −15 | 750 ms | 0.00200 |
| VG task: response-locked | |||||
| Right inferior frontal gyrus | 55 | 45 | −10 | −850 ms | 0.00200 |
| Right inferior temporal gyrus | 60 | −5 | −20 | −450 ms | 0.00002 |
| Right precentral gyrus | 60 | −5 | 20 | −450 ms | 0.00003 |
| Right middle frontal gyrus | 40 | 25 | 50 | −850 ms | 0.00210 |
| Right posterior inferior temporal gyrus | 65 | −55 | −10 | −550 ms | 0.00360 |
| Left cuneus | −25 | −85 | 25 | −550 ms | 0.00007 |
| Left superior temporal gyrus | −60 | −50 | 20 | −550 ms | 0.00230 |
| Left superior parietal lobule | −25 | −70 | 60 | −450 ms | 0.00170 |
| Boston picture naming task: response-locked | |||||
| Right precentral gyrus | 55 | −10 | 25 | −150 ms | 0.00200 |
| Right superior frontal gyrus | 30 | 30 | 55 | −650 ms | 0.00440 |
| Right middle temporal gyrus | 55 | −70 | 15 | 350 ms | 0.00005 |
| Right inferior parietal lobule | 35 | −75 | 45 | 450 ms | 0.00210 |
| Left precuneus | −40 | −75 | 40 | −350 ms | 0.00280 |
| Left middle temporal gyrus | −65 | −25 | −10 | −450 ms | 0.00009 |
Figure 2.
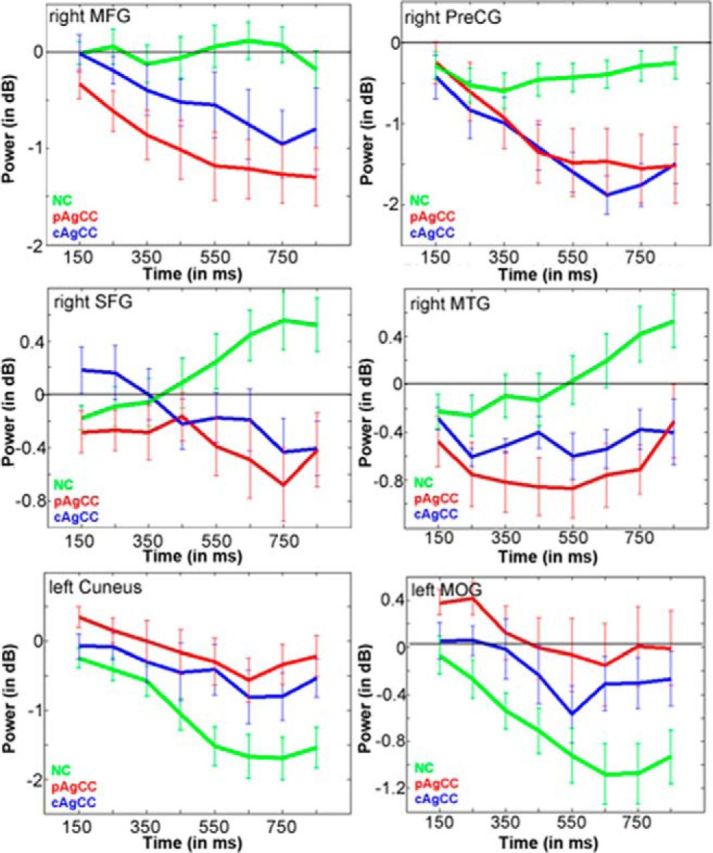
Time course plots of beta power (in dB) for regions of interest derived from the stimulus-locked group comparison in Figure 1C. Green, NC; red, pAgCC; blue, cAgCC. Error bars indicate SEM.
Bilateral cortical activity in AgCC during speech preparation
We hypothesized that bilateral activations of the language network in AgCC identified during the early stages of auditory linguistic processing (stimulus-locked analysis) would extend to the period of speech preparation immediately before speaking and after vocalization onset (0 ms; white vertical line in Fig. 3). In the speech preparation phase (−800 to 0), the NC group showed increased (p < 0.05, 0.05% FDR correction) oscillation power fluctuations (in the beta band) only in left hemisphere over the same cortical regions identified in the stimulus-locked analysis (Fig. 3A). This activation became bilateral in the NC group during speech execution (0–600 ms), with recruitment of motor cortices along the right Rolandic operculum (Fig. 3A,B) similar to patterns seen in surface recordings of cortex (Cogan et al., 2014). In contrast, in the AgCC cohort, activation is bilateral over the frontal, parietal, and temporal fields during both speech preparation and execution (Fig. 3A,B).
Figure 3.
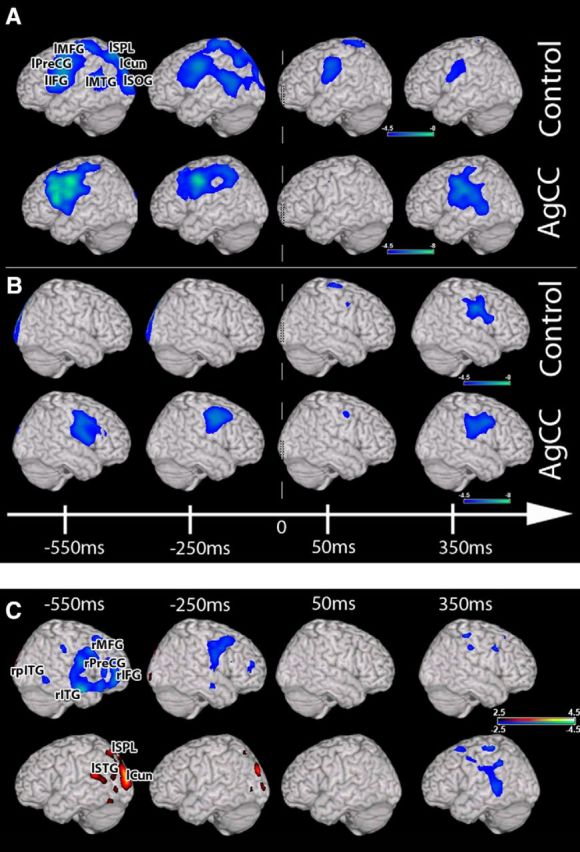
Response-locked (0 ms = speak verb) group analyses of changes in beta (12–30 Hz) oscillatory power during auditory verb generation. A, Changes in beta power over the left hemisphere (one-sample t test). Robust reductions in beta power are seen over the left hemisphere in both the control and AgCC cohorts before response generation and during execution. B, Changes in beta power over the right hemisphere. Changes in frontal and temporal beta power before the response are present only in AgCC, with bilateral changes in both groups after 0 ms. C, Comparison (unpaired nonparametric t test) between the control and AgCC groups. Significant increases in beta activity (blue) before response onset are present only in the right hemisphere, with greater activity in AgCC. Decreases in beta activity for the AgCC cohort (red) are present in the posterior regions of the left hemisphere outside of the language network. Dashed vertical line indicates 0 ms. Conventions are as in Figure 1.
Direct group comparison between AgCC and NC was then performed during the speech preparation and execution periods (800 ms preresponse to 600 ms postresponse). This analysis confirms the significant (p < 0.05, 1% FDR correction) relative decreased activation in the posterior left hemisphere regions for the AgCC group identified during linguistic processing (Fig. 1) extending to the period of speech preparation (Fig. 3C, red, Table 5). This difference diminishes approaching speech onset. All of these regions except one (left superior temporal gyrus; p = 0.0024; Fig. 3C) were outside of the left hemisphere language network. In contrast, significant increases in right hemisphere activity (Fig. 3C, in blue) were identified in the AgCC group over the right frontal (−450 ms, p = 0.0003) and temporal lobes (inferior temporal gyrus, p = 0.0002; Table 5). Similar to the linguistic processing period, the most significant differences between groups occurred long before (∼550 ms) speech onset. During speech execution, significant differences between groups were less pronounced than the speech preparation phase and included increased activation over regions of the temporal and frontal language network of both hemispheres (Fig. 1C). This pattern, with increased activation in the right frontal hemisphere and decreased activation in left posterior hemisphere, was present in both the cAgCC and pAgCC groups (Fig. 4).
Figure 4.
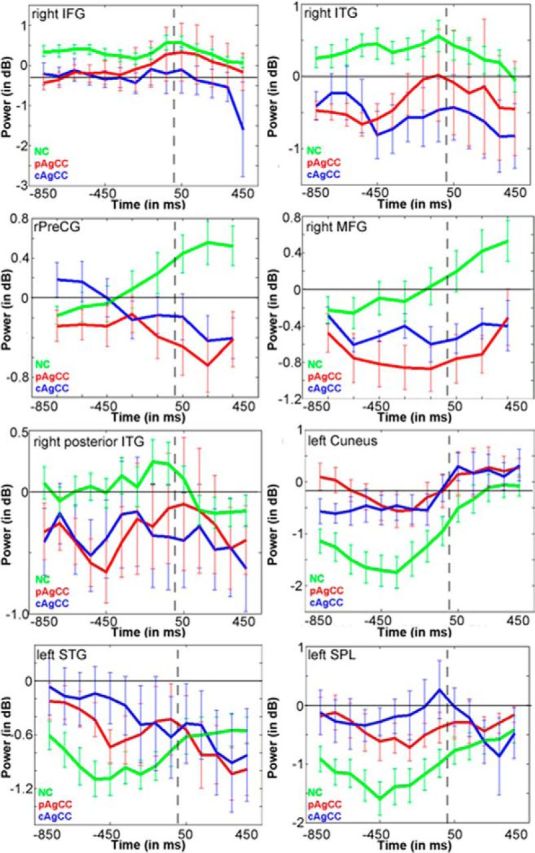
Time course plots of beta power (in dB) for regions of interest derived from the response-locked group comparison in Figure 3C. Conventions as in Figure 2.
Bilateral cortical activity in AgCC for visually guided speech preparation
We tested whether increased right hemisphere activity during speech preparation and execution in AgCC individuals was specific to auditory driven speech. We assessed this hypothesis by examining cortical activation during speech preparation and execution after visual stimulation in a subset of AgCC patients (n = 14) and matched NC individuals using the PN test. During speech preparation (−550 to 0 ms), increased activations (p < 0.05, 0.1% FDR correction) were observed over regions of the left hemisphere language network that was sustained throughout response onset period in both the AgCC and NC groups (Fig. 5A). In the right hemisphere, beta activity was identified in NCs over the midline regions including the cuneus and lingual and middle frontal gyrus, whereas, in AgCC subjects, additional right hemisphere activity was observed over the superior frontal and precentral gyrus; notably, these regions were not active in the NC group (Fig. 5B). Like auditory driven speech preparation, activation during visually driven speech preparation is no longer confined to the left hemisphere in AgCC and instead is distributed across the two hemispheres.
Figure 5.
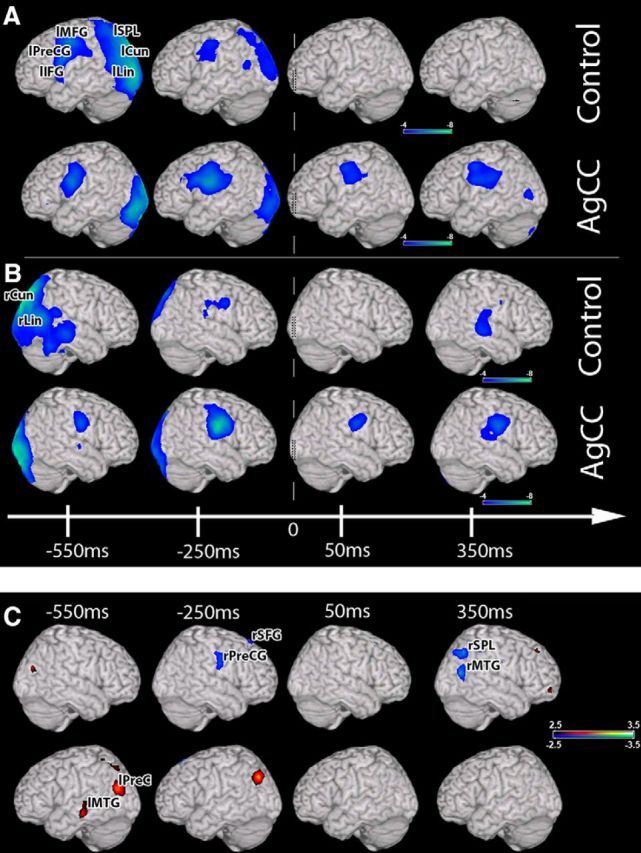
Response-locked group analyses of changes in beta (12–30 Hz) oscillatory power during picture naming. A, Changes in beta power over the left hemisphere (one-sample t test). Like auditory verb generation, robust reductions in beta power over frontal regions are seen over the left hemisphere in both the control and AgCC cohorts (A), whereas only changes in beta power are seen in the right hemisphere preresponse in AgCC (B). C, Comparison (unpaired nonparametric t test) between the control and AgCC group showing that increased beta activity is present in the right frontal regions in AgCC. Conventions are as in Figure 3.
A direct between-group comparison for this visually driven speech preparation task revealed a significant (p < 0.05, 1% FDR correction) increase in activity over right frontal (precentral gyrus; p = 0.002) regions in the AgCC group (Fig. 5C, blue, Table 5). As in auditory-driven speech preparation, in the left hemisphere, significant reductions in activity for the AgCC group (Fig. 5C, red) were observed over the left posterior regions before the response. All of these regions except one (left middle temporal gyrus; p = 0.0009; Fig. 5C) were outside of the left hemisphere language network (Table 5). After the response, a significant increase in activity was observed in the AgCC group compared with the NC cohort over focal areas in the right temporal (middle temporal gyrus; p = 0.0005) and parietal (p = 0.0021) regions (Fig. 5C). Similar to the speech preparation period for auditory verb generation, these differences between groups were present in both the pAgCC and cAgCC cohorts (Fig. 6). These results illustrate that robust activation in the right hemisphere for language in AgCC individuals occurs as a result of either auditory or visually driven linguistic input.
Figure 6.

Time course plots of beta power (in dB) for regions of interest derived from the response-locked group comparison in Figure 5C. Conventions as in Figure 2.
Auditory cortex activation is similar across groups
Behaviorally, patients with AgCC responded slower than the NC cohort during the auditory verb generation task (see Materials and Methods). It is unclear whether the response delay results from initial perception at the level of the primary auditory cortex or from subsequent information transfer and processing phases. To test this hypothesis, we measured the amplitude and latency of a response in primary auditory cortex (M100; Reite et al., 1994) in response to a simple (1 kHz) tone in AgCC (n = 18) and NC (n = 8) participants. AEFs were selected visually based on the largest-amplitude component in a window between 60 and 140 ms after source localization on averaged data using a sparse space reconstruction algorithim (Wipf et al., 2010). Response latency (in milliseconds) and peak amplitude (in femtotesla) were entered separately into 3 × 2 ANOVAs between group (NC, AgCC) and stimulus type (binaural, left ear, right ear). No significant main effects or interactions were identified (all p > 0.05) for either latency or amplitude, suggesting that the observed behavioral response is a consequence of higher cortical processing rather than initial perception.
Differential hemispheric language lateralization across groups
Based on the whole-brain group comparisons of activity, we identified bilateral patterns of activity during the stages of speech processing and response preparation in participants with AgCC—a function typically left lateralized in healthy individuals. However, we further hypothesized that the degree of callosal absence would affect the magnitude of this bilateral activation, with the greatest activation for cAgCC participants in the right hemisphere (thus making them right hemisphere dominant), whereas an intermediate phenotype (equal activation across the two hemispheres) would be present in pAgCC. To assess this, we estimated an LI for all participants by comparing activity in frontotemporal regions between the two hemispheres averaging across linguistic processing and speech production periods (Fig. 7A). We identified a positive LI ratio (mean LI = 0.526, SD = 0.39) indicating left hemisphere language lateralization (i.e., LI > 0.1) in 16/19 NC participants during auditory driven speech production. Of the remaining 3 NC participants, 2 were bilateral (1 left handed; LI between −0.1 and 0.1) and one was right hemisphere dominant (left handed; LI < 0.1). This is consistent with the known patterns of left hemisphere lateralization in the general population, with left hemisphere dominance in ∼96% of typically developing right-handed individuals and ∼76% of left-handed individuals (Pujol et al., 1999; Knecht et al., 2000). For the pAgCC group, we identified intermediate LI (mean LI = 0.229, SD = 0.40), with clear left hemisphere lateralization in 6/10 participants. In the cAgCC group, only 2/9 participants showed left hemisphere language lateralization (mean LI = −0.042, SD = 0.57), whereas the majority of cAgCC participants (6/9) showed right hemisphere language lateralization (LI <−0.1). Overall LI estimates were entered into a one-way ANOVA treating group (NC, pAgCC, cAgCC) as a random variable. We identified a significant main effect of group (F = 5.38, p = 0.009) and post hoc t tests revealed a significantly lower LI in the cAgCC group compared with the NC group (p = 0.02), indicating a greater likelihood of right hemisphere lateralization for language in patients with complete AgCC. Because the groups were matched for handedness, this likelihood of right hemisphere lateralization for language in AgCC was unrelated to hand dominance. Therefore, whereas the whole-brain group analysis indicates that the timing of brain activation during linguistic processing, preparation, and execution is comparable between NC and AgCC cohorts, the LI analysis demonstrates that activation in the right hemisphere during these time periods exceeds activation in the left hemisphere in AgCC, making these individuals more likely to be right hemisphere dominant for language.
Figure 7.

LI in AgCC. A, Scatterplot of LI derived from the auditory verb generation task in the NC (green), pAgCC (red), and cAgCC (blue) groups. Significantly (*p < 0.05) lower LI was identified in the cAgCC group compared with the NC group, indicating a greater likelihood of right hemisphere lateralization for language. Black (AgCC) and colored horizontal bars indicate the group mean. B, Correlation between LI and VIQ for the NC (green) and AgCC (black) groups. A significant (r = 0.55, p < 0.005) positive correlation was identified in the AgCC group, but not in the NC group (r = 0.25, p > 0.05).
To determine whether other comorbid anatomical factors (such as Probst bundles) commonly found in AgCC contributed to laterality estimates, we conducted an additional post hoc analysis (2 × 3 contingency table) relating four separate anatomical factors (Probst bundles, colpocephaly, presence of hippocampal commissure, presence of anterior commissure) to hemispheric dominance (left hemisphere, right hemisphere, bilateral). No significant relationship (Fisher's exact test, Freeman and Halton, 1951) was observed between hemispheric dominance and Probst bundles, colpocephaly, presence of the hippocampal commissure, or presence of the anterior commissure (all PA/PB > 0.5) across the AgCC cohort. We also conducted a similar analysis (3 × 3 contingency table) relating size of the anterior commissure to hemispheric dominance and also found no effect (PA = 0.46, PB = 0.41). Interestingly, when the same analysis (3 × 3 contingency table) is applied relating hemispheric dominance to the corpus callosum (NC, pAgCC, cAgCC) a significant effect is identified (PA/PB < 0.001). These additional analyses show that hemispheric dominance in AgCC is more related to callosal development that neuroanatomical abnormalities and therefore provide support for the hypothesis that hemispheric dominance for language is dependent on callosal development.
Four of the AgCC patients were from the same family cohort (3 pAgCC, 1 cAgCC; Tables 2, 3, 4, 5), with three generations and male to male and male to female transmission, are most consistent with an autosomal dominant mode of inheritance. In this multigenerational family, the three pAgCC participants were left lateralized to varying degrees (LI = 0.262, 0.395, 0.972). Interestingly, the one cAgCC individual in this cohort was right lateralized (LI = −0.461) with IQ in the normal range [FSIQ = 102, verbal IQ (VIQ) = 91]. Although this is a single small family (four of the six affected family members were imaged), this finding was consistent with the larger group effect of a shift to right hemispheric language lateralization in the absence of callosal development.
Is hemispheric lateralization related to linguistic ability?
We hypothesized that the absence of typical functional asymmetry in AgCC was related to deficits in linguistic intelligence in these patients. To test this, we ran correlation analysis between LI and VIQ scores for both groups (NC, n = 13; AgCC, n = 25). No significant correlation was observed between VIQ scores and LI for the NC cohort (r = 0.25, p = 0.41), although the range in both VIQ (95–119) and LI (0.01–1) scores were more restricted for the NC cohort compared with the AgCC cohort. In contrast, however, in the AgCC cohort, a strong positive correlation was observed between VIQ and LI (r = 0.55, p < 0.0044; Fig. 7B), indicating that verbal intelligence was inversely related to the degree of right hemisphere lateralization for this cohort. A positive correlation between LI and VIQ in the AgCC cohort suggests that rightward lateralization contributes to impairments in verbal ability in patients with AgCC, rather than acting as a compensatory mechanism in the absence of callosal formation. This concept is consistent with relationships between hemispheric asymmetry and VIQ in neurodevelopmental disorders, including autism (De Fosse et al., 2004), indicating that preferential processing for language in the right hemisphere leads to or accompanies verbal deficits.
Discussion
These results provide compelling evidence for the hypothesis that the corpus callosum plays a key role in the specialization of language to the left hemisphere. In AgCC, cortical processing for language becomes distributed across the two hemispheres and becomes right hemisphere dominant in cAgCC, a functional change that is independent of handedness. The timing and magnitude of activity in the left hemisphere for the main components of the frontotemporal language network was comparable between the groups, with greater activity in the right hemisphere over the same time windows in AgCC for both auditory and visual stimuli. Interestingly, the time windows that manifest left hemispheric lateralization in neurotypical cohorts (Findlay et al., 2012) overlapped time windows that manifest right hemisphere activation in AgCC. This shift away from left hemisphere dominance in AgCC was unrelated to additional clinical diagnoses. Furthermore, the finding that a loss of left hemisphere lateralization for language is directly related to low VIQ in AgCC suggests clinical consequences for atypical lateralization.
Apart from case reports and small case series with variable results (Gott and Saul, 1978; Komaba et al., 1998; Riecker et al., 2007; Pelletier et al., 2011), this is the first large, well defined cohort study to address and demonstrate systematically that hemispheric specialization for language is related to intact callosal connections and is not purely dependent on genetic factors (such as mRNA expression asymmetries) that are evident before midline crossing of callosal fibers. Furthermore, within our familial cohort (presumably a more genetically homogenous cohort), the person with cAgCC was right hemisphere dominant for language and several other family members with pAgCC were left hemisphere dominant. This finding further supports the notion that language lateralization can depend primarily on callosal development and, to a lesser extent, on genetic factors. By itself, our findings in this family cohort cannot rule out genetic factors that may code jointly for both language laterality (Bishop, 2013; Somers et al., 2015) and callosal development (Paul et al., 2007).
Bilateral language activations in AgCC
In contrast to largely exclusive left hemisphere activation in the NC cohort, activation in the AgCC cohort is bilateral in language regions as early as 350 ms poststimulus, with no significant difference between AgCC and control groups in the amplitude of activation in the left hemisphere frontal and parietal fields or the timing of activity within left hemisphere regions, excluding the posterior temporal/occipital cortical fields. Therefore, patients with AgCC show an activation pattern within the left hemisphere language network equivalent to that of NCs. In NCs, sustained activity over motor and language cortex becomes more dominant in the left hemisphere immediately preceding the vocal response and more bilateral at response onset. In contrast, AgCC patients show significant increases in right hemisphere activity until response onset regardless of the stimulus modality driving language production. This suggests that, in both groups, activation in the left hemisphere language network occurs at the same time scale during linguistic processing and speech production, with additional right hemisphere activation leading to rightward dominance in AgCC individuals. Although the activation patterns identified in the AgCC whole-brain group analyses show robust activation across both hemisphere during the tasks, LI estimates (a ratio between the magnitude of activation across left and right hemisphere VOIs) illustrate that only in the pAgCC cohort is the magnitude of activation the same between both hemispheres, making them truly bilateral. From laterality estimates, the cAgCC cohort demonstrates activation in the right hemisphere at a magnitude greater than that of activation in the left hemisphere, making the majority of these individuals right hemisphere dominant for language. Concordance between both linguistic processing (locked to the auditory stimulus) and speech preparation and execution results (response locked, where time locking the analysis to response onset eliminates reaction time as a confound) indicates that these hemispheric lateralization effects are not due to task performance differences.
Previous investigations studying language lateralization in AgCC using both gold-standard techniques (IAP) and fMRI have, to date, been unable to find consistent abnormal language lateralization in this population, although it is often acknowledged that heterogeneity within these small cohort sizes made it difficult to determine laterality conclusively (Gott and Saul, 1978; Komaba et al., 1998; Riecker et al., 2007; Pelletier et al., 2011). Using fMRI, Pelletier and colleagues (2011) found bilaterality in one and clear right hemisphere lateralization in another patient of six cAgCC participants. Although the differences in the study by Pelletier et al. (2011) and our own studies may be due to a difference in sample size, it is more likely that our identification of clear atypical hemispheric lateralization in AgCC is due to the temporal fidelity of our technique (MEG), with fMRI lacking the precise temporal resolution to identify the cognitive components of language that are more lateralized. In our MEGI analyses, differences between the two groups were not apparent in many time windows, indicating that the timing of activation within the left hemisphere language network is preserved in AgCC yet shifted to the right hemisphere. Furthermore, because speech is a dynamic process, techniques such as dichotic listening and fMRI are unable to model the critical temporal scaling underlying language processing. Nevertheless, a loss of leftward hemispheric asymmetry is by no means absolute in AgCC, with two patients in our own cAgCC group exhibiting patterns of left-hemispheric lateralization (LI > 0.1). Certainly, the neurodevelopmental factors contributing to hemispheric asymmetry extend beyond the callosum and perhaps this small percentage of individuals with AgCC and left hemispheric laterality tap into these mechanisms in a compensatory manner, retaining normal hemispheric specialization and better language aptitude.
With the amount of cortical activity that is being driven in the right hemisphere in AgCC (in some cases, beyond levels of activation typically seen in the left hemisphere for right-dominant AgCC patients), it is possible that neural processing resources are being “rerouted” from areas less critically important in language production. In both auditory and visually driven speech preparation, the magnitude of activity in the left hemisphere over the posterior temporal gyrus and regions of occipitotemporal cortex was significantly reduced in AgCC. These cortical fields are largely outside the regions of interest selected for laterality index estimation for response-locked analyses (Findlay et al., 2012) and therefore have minimal impact on hemispheric lateralization. It is possible that, in the absence of callosal development, right hemisphere activation occurs at a cost to processing in these regions.
Role of the corpus callosum
What are the functional manifestations of neuronal influences mediated through the callosal fibers? The fibers of the corpus callosum, which emerge from cortical pyramidal cells, are largely glutamatergic and play an excitatory role in nervous system function, although they are also known to act through GABA-mediated inhibitory neurons (Palmer et al., 2012). At a functional level, there are two competing theories regarding the role of trans-hemispheric fibers in the corpus callosum. The first theory posits that the corpus callosum serves to distribute or enhance processing across the cerebral hemispheres (excitation theory; Gazzaniga, 2000). In contrast, Cook (1984) proposed that the primary function of the corpus callosum is to transmit information across cortical fields to suppress one area while the contralateral hemisphere is active. The findings of the present study are consistent with the notion that callosal development serves to suppress cortical activity in the competing hemisphere. With no significant differences in left frontal beta activity between the two groups, it seems that absence of callosal fiber formation leads to an inability or limitation of the left hemisphere to suppress activity in homotopic language areas of the right hemisphere. Our findings are consistent with imaging studies showing that functional asymmetry is related to callosal size (Josse et al., 2008). Nonetheless, it is possible that different neuronal populations within the callosum separately subserve these distinct roles (Fame et al., 2011) or that, in the case of AgCC, atypical white matter tracts such as Probst bundles (Paul et al., 2007) play a key role in functional lateralization, but this seems unlikely (88% of our sample possessed Probst bundles, for example, LI scores varied significantly across individuals who all had Probst bundles). Nevertheless, future investigations combining MEG laterality with white-matter measures (e.g., DTI) will be needed to investigate what role these structures have on neural plasticity. It is possible that there is a nonlinear relationship between callosal volume and language laterality exists in which, in extreme cases (such as abnormally large callosa or AgCC), the likelihood of functional asymmetry decreases. Given that the tasks being conducted here are designed to drive the general processes of language input and speech output, it is not clear which patterns of activity correspond to different linguistic processes (e.g., syntactic vs lexical processing) across the two tasks. Nonetheless, we demonstrate here the novel finding that the establishment of left hemisphere language lateralization is associated with normal callosal development. We further provide evidence that linguistic impairments in those born without this structure are associated with profound increases in activity in the right hemisphere. Because language is not the only lateralized process in the human brain, future studies are needed to address how other cognitive functions (such as spatial ability) are dependent on healthy callosal development.
Footnotes
This work was supported by the University of California, San Francisco (UCSF) Program in Breakthrough Biomedical Research (PBBR), the National Institutes of Health (NIH)/National Center for Research Resources (NCRR) UCSF Clinical and Translational Science Institute Grant UL 1 TR000004, and NIH Grants R01NS058721, R01DC004855, R01DC006425, R21NS76171, R01DC10145, R01NS066654 and the National Science Foundation (Behavioral and Cognitive Sciences Grant).
The authors declare no competing financial interests.
References
- Alexander AL, Lee JE, Lazar M, Boudos R, DuBray MB, Oakes TR, Miller JN, Lu J, Jeong EK, McMahon WM, Bigler ED, Lainhart JE. Diffusion tensor imaging of the corpus callosum in Autism. Neuroimage. 2007;34:61–73. doi: 10.1016/j.neuroimage.2006.08.032. [DOI] [PubMed] [Google Scholar]
- Anderson JS, Druzgal TJ, Froehlich A, DuBray MB, Lange N, Alexander AL, Abildskov T, Nielsen JA, Cariello AN, Cooperrider JR, Bigler ED, Lainhart JE. Decreasedinterhemispheric functional connectivity in autism. Cereb Cortex. 2011;21:1134–1146. doi: 10.1093/cercor/bhq190. [DOI] [PMC free article] [PubMed] [Google Scholar]
- Annett M. Cerebral asymmetry in twins: predictions of the right shift theory. Neuropsychologia. 2003;41:469–479. doi: 10.1016/S0028-3932(02)00137-9. [DOI] [PubMed] [Google Scholar]
- Badzakova-Trajkov G, Häberling IS, Corballis MC. Cerebral asymmetries in monozygotic twins: an fMRI study. Neuropsychologia. 2010;48:3086–3093. doi: 10.1016/j.neuropsychologia.2010.06.020. [DOI] [PubMed] [Google Scholar]
- Barnes GR, Hillebrand A, Fawcett IP, Singh KD. Realistic spatial sampling for MEG beamformer images. Hum Brain Mapp. 2004;2:120–127. doi: 10.1002/hbm.20047. [DOI] [PMC free article] [PubMed] [Google Scholar]
- Benjamini Y, Hochberg Y. On the adaptive control of the false discovery fate in multiple testing with independent statistics. Journal of Educational and Behavioral Statistics. 2000;25:60–83. [Google Scholar]
- Bishop DV. Cerebral asymmetry and language development: cause, correlate or consequence? Science. 2013;340:1230531. doi: 10.1126/science.1230531. [DOI] [PMC free article] [PubMed] [Google Scholar]
- Cao Q, Sun L, Gong G, Lv Y, Cao X, Shuai L, Zhu C, Zang Y, Wang Y. The macrostructural and microstructural abnormalities of corpus callosum in children with attention deficit/hyperactivity disorder: a combined morphometric and diffusion tensor MRI study. Brain Res. 2010;1310:172–180. doi: 10.1016/j.brainres.2009.10.031. [DOI] [PubMed] [Google Scholar]
- Cogan GB, Thesen T, Carlson C, Doyle W, Devinsky O, Pesaran B. Sensory-motor transformations for speech occur bilaterally. Nature. 2014;507:94–98. doi: 10.1038/nature12935. [DOI] [PMC free article] [PubMed] [Google Scholar]
- Cook ND. Callosal inhibition: the key to the brain code. Behav Sci. 1984;29:98–110. doi: 10.1002/bs.3830290203. [DOI] [PubMed] [Google Scholar]
- Dalal SS, Guggisberg AG, Edwards E, Sekihara K, Findlay AM, Canolty RT, Berger MS, Knight RT, Barbaro NM, Kirsch HE, Nagarajan SS. Five-dimensional neuroimaging: localization of the time–frequency dynamics of cortical activity. Neuroimage. 2008;40:1686–1700. doi: 10.1016/j.neuroimage.2008.01.023. [DOI] [PMC free article] [PubMed] [Google Scholar]
- De Fossé L, Hodge SM, Makris N, Kennedy DN, Caviness VS, Jr, McGrath L, Steele S, Ziegler DA, Herbert MR, Frazier JA, Tager-Flusberg H, Harris GJ. Language-association cortex asymmetry in autism and specific language impairment. Ann Neurol. 2004;56:757–766. doi: 10.1002/ana.20275. [DOI] [PubMed] [Google Scholar]
- Fame RM, MacDonald JL, Macklis JD. Development, specification and diversity of callosal projection neurons. Trends Neurosci. 2011;34:41–50. doi: 10.1016/j.tins.2010.10.002. [DOI] [PMC free article] [PubMed] [Google Scholar]
- Findlay AM, Ambrose JB, Cahn-Weiner DA, Houde JF, Honma S, Hinkley LB, Berger MS, Nagarajan SS, Kirsch HE. Dynamics of hemispheric dominance for language assessed by magnetoencephalographic imaging. Ann Neurol. 2012;71:668–686. doi: 10.1002/ana.23530. [DOI] [PMC free article] [PubMed] [Google Scholar]
- Frazier TW, Hardan AY. A meta-analysis of the corpus callosum in autism. Biol Psychiatry. 2009;66:935–941. doi: 10.1016/j.biopsych.2009.07.022. [DOI] [PMC free article] [PubMed] [Google Scholar]
- Freeman GH, Halton JH. Note on exact treatment of contingency, goodness of fit and other problems of significance. Biometrika. 1951;38:141–149. [PubMed] [Google Scholar]
- Gazzaniga MS. Cerebral specialization and interhemispheric communication: Does the corpus callosum enable the human condition? Brain. 2000;123:1293–1326. doi: 10.1093/brain/123.7.1293. [DOI] [PubMed] [Google Scholar]
- Geschwind DH, Miller BL, DeCarli C, Carmelli D. Heritability of lobar brain volumes in twins supports genetic models of cerebral laterality and handedness. Proc Natl Acad Sci U S A. 2002;99:3176–3181. doi: 10.1073/pnas.052494999. [DOI] [PMC free article] [PubMed] [Google Scholar]
- Gott PS, Saul RE. Agenesis of the corpus callosum: limits of functional compensation. Neurology. 1978;28:1272–1279. doi: 10.1212/WNL.28.12.1272. [DOI] [PubMed] [Google Scholar]
- Häberling IS, Badzakova-Trajkov G, Corballis MC. Callosal tracts and patterns of hemispheric dominance: a combined fMRI and DTI study. Neuroimage. 2011;54:779–786. doi: 10.1016/j.neuroimage.2010.09.072. [DOI] [PubMed] [Google Scholar]
- Hardan AY, Pabalan M, Gupta N, Bansal R, Melhem NM, Fedorov S, Keshavan MS, Minshew NJ. Corpus callosum volume in children with autism. Psychiatry Res. 2009;174:57–61. doi: 10.1016/j.pscychresns.2009.03.005. [DOI] [PMC free article] [PubMed] [Google Scholar]
- Heim S, Pieperhoff P, Grande M, Kuijsten W, Wellner B, Sáez LE, Schulte S, Südmeyer M, Caspers S, Minnerop M, Binkofski F, Huber W, Amunts K. Longitudinal changes in brains of patients with fluent primary progressive aphasia. Brain Lang. 2014;131:11–19. doi: 10.1016/j.bandl.2013.05.012. [DOI] [PubMed] [Google Scholar]
- Hetts SW, Sherr EH, Chao S, Gobuty S, Barkovich AJ. Anomalies of the corpus callosum: an MR analysis of the phenotypic spectrum of associated malformations. AJR Am J Roentgenol. 2006;187:1343–1348. doi: 10.2214/AJR.05.0146. [DOI] [PubMed] [Google Scholar]
- Hines M, Chiu L, McAdams LA, Bentler PM, Lipcamon J. Cognition and the corpus callosum: Verbal fluency, visuo-spatial ability, and language lateralization related to midsaggital surface areas of callosal subregions. Behav Neurosci. 1992;106:3–14. doi: 10.1037/0735-7044.106.1.3. [DOI] [PubMed] [Google Scholar]
- Hirata M, Kato A, Taniguchi M, Saitoh Y, Ninomiya H, Ihara A, Kishima H, Oshino S, Baba T, Yorifuji S, Yoshimine T. Determination of language dominance with synthetic aperture magnetometry: comparison with the Wada test. Neuroimage. 2004;23:46–53. doi: 10.1016/j.neuroimage.2004.05.009. [DOI] [PubMed] [Google Scholar]
- Jeeves MA, Temple CM. A further study of language function in callosal agenesis. Brain Lang. 1987:325–335. doi: 10.1016/0093-934x(87)90131-3. [DOI] [PubMed] [Google Scholar]
- Josse G, Seghier ML, Kherif F, Price CJ. Explaining function with anatomy: language lateralization and corpus callosum size. J Neurosci. 2008;28:14132–14139. doi: 10.1523/JNEUROSCI.4383-08.2008. [DOI] [PMC free article] [PubMed] [Google Scholar]
- Kaplan E, Goodglass H, Weintraub S. Boston naming test. Philadelphia: Lea and Febiger; 1983. [Google Scholar]
- Kleinhans NM, Müller RA, Cohen DN, Courchesne E. Atypical functional lateralization of language in autism spectrum disorders. Brain Res. 2008;1221:115–125. doi: 10.1016/j.brainres.2008.04.080. [DOI] [PMC free article] [PubMed] [Google Scholar]
- Knaus TA, Silver AM, Kennedy M, Lindgren KA, Dominick KC, Siegel J, Tager-Flusberg H. Language laterality in autism spectrum disorder and typical controls: a functional, volumetric, and diffusion tensor MRI study. Brain Lang. 2010;112:113–120. doi: 10.1016/j.bandl.2009.11.005. [DOI] [PMC free article] [PubMed] [Google Scholar]
- Knecht S, Dräger B, Deppe M, Bobe L, Lohmann H, Flöel A, Ringelstein EB, Henningsen H. Handedness and hemispheric language dominance in healthy humans. Brain. 2000;123:2512–2518. doi: 10.1093/brain/123.12.2512. [DOI] [PubMed] [Google Scholar]
- Komaba Y, Senda M, Ohyama M, Mori T, Ishii K, Mishina M, Kitamura S, Terashi A. Bilateral representation of language function: Agenesis of the corpus callosum by Wada and PET activation. J Neuroimaging. 1998;8:246–249. doi: 10.1111/jon199884246. [DOI] [PubMed] [Google Scholar]
- O'Kusky J, Strauss E, Kosaka B, Wada J, Li D, Druhan M, Petrie J. The corpus callosum is larger with right hemisphere cerebral speech dominance. Ann Neurol. 1988;24:379–383. doi: 10.1002/ana.410240305. [DOI] [PubMed] [Google Scholar]
- Palmer LM, Schulz JM, Murphy SC, Ledergerber D, Murayama M, Larkum ME. The cellular basis of GABA(B)-mediated interhemispheric inhibition. Science. 2012;335:989–993. doi: 10.1126/science.1217276. [DOI] [PubMed] [Google Scholar]
- Paul LK, Brown WS, Adolphs R, Tyszka JM, Richards LJ, Mukherjee P, Sherr EH. Agenesis of the corpus callosum: genetic, developmental and functional aspects of connectivity. Nat Rev Neurosci. 2007;8:287–299. doi: 10.1038/nrn2107. [DOI] [PubMed] [Google Scholar]
- Pelletier I, Paquette N, Lepore F, Rouleau I, Sauerwein CH, Rosa C, Leroux JM, Gravel P, Valois K, Andermann F, Saint-Amour D, Lassonde M. Language lateralization in individuals with callosal agenesis: an fMRI study. Neuropsychologia. 2011;49:1987–1995. doi: 10.1016/j.neuropsychologia.2011.03.028. [DOI] [PubMed] [Google Scholar]
- Pinel P, Fauchereau F, Moreno A, Barbot A, Lathrop M, Zelenika D, Le Bihan D, Poline JB, Bourgeron T, Dehaene S. Genetic variants of FOXP2 and KIAA0319/TTRAP/THEM2 locus are associated with altered brain activation in distinct language-related regions. J Neurosci. 2012;32:817–825. doi: 10.1523/JNEUROSCI.5996-10.2012. [DOI] [PMC free article] [PubMed] [Google Scholar]
- Pujol J, Deus J, Losilla JM, Capdevila A. Cerebral lateralization of language in normal left-handed people studied by functional MRI. Neurology. 1999;52:1038–1043. doi: 10.1212/WNL.52.5.1038. [DOI] [PubMed] [Google Scholar]
- Reite M, Adams M, Simon J, Teale P, Sheeder J, Richardson D, Grabbe R. Auditory M100 component 1: relationship to Heschl's gyri. Brain Res Cogn Brain Res. 1994;2:13–20. doi: 10.1016/0926-6410(94)90016-7. [DOI] [PubMed] [Google Scholar]
- Riecker A, Ackermann H, Schmitz B, Kassubek J, Herrnberger B, Steinbrink C. Bilateral language function in callosal agenesis: an fMRI and DTI study. J Neurol. 2007;254:528–530. doi: 10.1007/s00415-006-0152-9. [DOI] [PubMed] [Google Scholar]
- Roberts TP, Khan SY, Rey M, Monroe JF, Cannon K, Blaskey L, Woldoff S, Qasmieh S, Gandal M, Schmidt GL, Zarnow DM, Levy SE, Edgar JC. MEG detection of delayed auditory evoked responses in autism spectrum disorders: towards an imaging biomarker for autism. Autism Res. 2010;3:8–18. doi: 10.1002/aur.111. [DOI] [PMC free article] [PubMed] [Google Scholar]
- Robinson S, Vrba J. Functional neuroimaging by synthetic aperture magnetometry (SAM) In: Yoshimoto, et al., editors. Recent advances in biomagnetism. Sendai, Japan: Tohoku University; 1999. pp. 302–305. [Google Scholar]
- Singh KD, Barnes GR, Hillebrand A. Group imaging of task-related changes in cortical synchronization using nonparametric permutation testing. Neuroimage. 2003;19:1589–1601. doi: 10.1016/S1053-8119(03)00249-0. [DOI] [PubMed] [Google Scholar]
- Somers M, Ophoff RA, Aukes MF, Cantor RM, Boks MP, Dauwan M, de Visser KL, Kahn RS, Sommer IE. Linkage analysis in a Dutch population isolate shows no major gene for left-handedness or atypical language lateralization. J Neurosci. 2015;35:8730–8736. doi: 10.1523/JNEUROSCI.3287-14.2015. [DOI] [PMC free article] [PubMed] [Google Scholar]
- Sun T, Patoine C, Abu-Khalil A, Visvader J, Sum E, Cherry TJ, Orkin SH, Geschwind DH, Walsh CA. Early asymmetry of gene transcription in embryonic hyman left and right cerebral cortex. Science. 2005;308:1794–1798. doi: 10.1126/science.1110324. [DOI] [PMC free article] [PubMed] [Google Scholar]
- van Rijn S, Aleman A, Swaab H, Vink M, Sommer I, Kahn RS. Effects of an extra X chromosome on language lateralization: an fMRI study with Klinefelter men (47, XXY) Schizophr Res. 2008;101:17–25. doi: 10.1016/j.schres.2008.02.001. [DOI] [PubMed] [Google Scholar]
- Wang L, Jensen O, van den Brink D, Weder N, Schoffelen JM, Magyari L, Hagoort P, Bastiaansen M. Beta oscillations relate to the N400m during language comprehension. Hum Brain Mapp. 2012;33:2898–2912. doi: 10.1002/hbm.21410. [DOI] [PMC free article] [PubMed] [Google Scholar]
- Westerhausen R, Kreuder F, Dos Santos Sequeira S, Walter C, Woerner W, Wittling RA, Schweiger E, Wittling W. The association of macro- and microstructure of the corpus callosum and language lateralization. Brain Lang. 2006;97:80–90. doi: 10.1016/j.bandl.2005.07.133. [DOI] [PubMed] [Google Scholar]
- Whalley HC, O'Connell G, Sussmann JE, Peel A, Stanfield AC, Hayiou-Thomas ME, Johnstone EC, Lawrie SM, McIntosh AM, Hall J. Genetic variation in CNTNAP2 alters brain function during linguistic processing in healthy individuals. Am J Med Genet B Neuropsychiatr Genet. 2011;156B:941–948. doi: 10.1002/ajmg.b.31241. [DOI] [PubMed] [Google Scholar]
- Whitehouse AJ, Bishop DV. Cerebral dominance for language function in adults with specific language impairment or autism. Brain. 2008;131:3193–3200. doi: 10.1093/brain/awn266. [DOI] [PMC free article] [PubMed] [Google Scholar]
- Wipf DP, Owen JP, Attias HT, Sekihara K, Nagarajan SS. Robust Bayesian estimation of the location, orientation, and time course of multiple correlated neural sources using MEG. Neuroimage. 2010;49:641–655. doi: 10.1016/j.neuroimage.2009.06.083. [DOI] [PMC free article] [PubMed] [Google Scholar]
- Yazgan MY, Wexler BE, Kinsbourne M, Peterson B, Leckman JF. Functional significance of individual variations in callosal area. Neuropsychologia. 1995;33:769–779. doi: 10.1016/0028-3932(95)00018-X. [DOI] [PubMed] [Google Scholar]