Abstract
Berberis lycium Royle (Kashmal) belongs to Berberidaceae family and it has a small edible purple berry. It is grown wildly grown in Himalaya. The berry anthocyanins were characterised by HPLC coupled to a photodiode array (PDA) and mass spectrophotometer (MS) detectors. Twelve anthocyanins were identified in the purified extract of berberis berry. Two anthocyanins delphinidin-3-glucoside (35.3 %) and cyanidin-3-glucoside (47.2 %) were characterized as major components. Ten minor anthocyanins were Cyanidin-3-lathyroside (0.08 %), Cyanidin-3-rutinoside (0.53 %), Cyanidin-3-galactoside (1.62 %), Pelargonidin-3-pentoxilhexoside (2.26 %), Malvidin-3,5-dihexoside (4.21 %), Pelargonidin-hexoside (0.58 %), Pelargonidin- 3,5-diglucoside (1.05 %), Cyanidin-3,5-dihexoside (6.12 %), peonidin-3-rutinoside (0.77 %), pelargonidin-3-rutinoside (0.22 %). Apart from anthocyanins, six phenolics were also identified as chlorogenic acid, coumaric acid, caffeic acid, syringic acid, vanillic acid and quercetin. Antioxidant activity evaluated by DPPH assay revealed IC50 value of anthocyanin was 25.3 μg ml−1. FRAP and CUPRAC assay also gave significant antioxidant activity. MTT assay gave the absorbance of 0.53 at 250 μg ml−1. It may be concluded that the wild berry should be exploited as a source of nutraceuticals for its constitutive phenolics and its activity.
Keywords: Berberis lycium, Anthocyanins, MTT assay, Antioxidant, LC-MS characterization
Introduction
Due to the potential health-benefitting effects of phytochemicals especially those presents in fruits and vegetables, considerable interest has developed in recent past (Hertog et al. 1993, 1995). High antioxidant activity of these phytochemicals is responsible for the claimed biological effects (Pietta 2000). Among fruits and vegetables, berries with dark colors have the highest antioxidant capacities (Wang et al. 1996).
Among phytochemicals, flavonoids are very important component of antioxidants. Anthocyanins, one of flavanoid class, are belonging to an important class of plant constituents. Anthocyanins, 3-O-glycosides or 3,5 di-O-glycosides are most common in plant kingdom (Cao et al. 2001). Huge potential as natural colorants and their significant health benefitting activity led to increase in research interest on anthocyanins (Jimenez et al. 2011).
Berberis lycium Royle is a wild species of India and Pakistan, grows in the Himalayan region at 2000–2700 m altitude. The berry is locally called as kashmal in India and Pakistan. It belongs to family Berberidaceae and is a sub-erect, rigid and spiny shrub. Roots of the plant are known to be active against a number of ailments (Sood et al. 2010). Fruits start ripening during second fortnight of May and it is available till July. Traditionally the fruit is known for its cooling laxative effect on children antiscurbutic. The fruit extract is generally recommended against stomach ache and intestinal problems (Sood et al. 2010).
Compositions of few species of Berberis berry have been reported in the literature. Chromatographic analysis found that berries of Berberis vulgaris contain glucosides of pelargonidin and cyanidine (Ruiz et al. 2010; Jimenez et al. 2011). Anthocyanin in Berberis buxifolia was reported long back (Pomilio 1973) followed by Du and Francis (1974) in Berberis thunbergii. Research findings by Pomilio (1973) reported that as many as 10 pigments were present in the fruits of Berberis buxifolia (Timberlake and Bridle 1982). Anthocyanin content in the B. lycium fruit was reported to be 82.5 mg 100 mL−1, but characterization of anthocyanin constituents has not been done yet (Sood et al. 2010). Recently, Andola et al. 2010 and Sasikumar et al. 2012 reported that the fruit may be a good source of nutraceuticals.
Objectives of the present study were to characterize the anthocyanins present in Berberis lycium (Royale) fruits and to evaluate the antioxidant potentiality.
Materials & methods
Plant material
Fruits of B. lycium (2 kg) were manually harvested from the plants in the Chamoli district (30.7° N, 79.6° E), Uttarakhand, West Himalaya, India. Only intact and fresh fruits were collected, transported and stored in a freezer at −40 °C. Sampling of berries was done by quartering method. These samples were used for the anthocyanin and other phenolics profile.
Anthocyanin standard and chemicals
HPLC grade solvents, acetonitrile, methanol, formic acid, trifluoro acetic acid reagents were obtained from Merck, India. 3-O-glucoside standards of cyanidin (>99 % purity) and delphinidin (>98 % purity) (HPLC grade) were purchased from Sigma and Aldrich, India.
Pigment extraction
A high speed homogenizer (Ika) and a rotary evaporator (Laborota, Heidolph, Germany) were used for the extraction purpose. Extraction of anthocyanins was executed by following the procedure reported by Revilla et al. 1998. B. lycium fruit tissues were blended after separation of seeds, with methanol containing 0.1 % HCl. The methanolic extract was filtered and the residual mass was re-extracted with the same solvent until the residual mass become colourless. Filtrates were combined and concentrated on a rotavapor under reduced pressure at 40 °C to get dark coloured viscous mass. The extract was stored at -40 °C till further purification and characterization.
Pigment purification
The dried acidified methanol extract was subjected to purification by passing through a macroporous adsorption resin (XAD-7) column. First the extract was loaded in the column and the column was eluted with H2O twice in order to remove sugars and other phenolics. Then the column was eluted with methanol to get the column bound anthocyanins. Elution of methanol continued till the column became almost colourless. Methanol was evaporated using rotary evaporator under vacuum (< 40 °C) and the residue was dissolved in minimum amount of H2O. After pre-freezing the extract was lyophilized on a tray type lyophilizer (Labconco to get fine anthocyanin crystals.
HPLC-PDA analysis
The HPLC system used was a Water Alliance HPLC (Waters Associates, Milford, MA), equipped with a degasser, a quaternary pump, an auto sampler (Waters 717 plus), a column oven and a diode array detector. The column used was a C-18 column (Thermo, USA), 25 cm × 4.6 mm × 5 μ was used for anthocyanin separation using a multistep linear gradient solvent system comprising of water (0.1 % TFA; solvent A) and water: ACN: TFA (53:46:1 v/v; solvent B). The injected volume was 20 μL and the flow rate was 0.6 ml min−1. The gradient elution profile was as follows: 0 min 80 % A, 26 min 60%A, thereafter to 20 % in 4 min and stay constant for 10 min and then back to initial composition. The chromatogram was recorded at wavelengths of 520 nm. Empower 2(R) (Waters corporation) was used as operating system for data analysis. Retention times and UV-Visible spectral fingerprint of the standard and compounds in extract were used for identification of individual anthocyanins.
Mass spectrometry analysis
In order to identify individual anthocyanins, LC/MS experiment was done. A ion trap mass spectrometer (Thermo Electron Corporation, USA) equipped with ESI interface was linked with the LC system (Spectra SYSTEM SCM 1000) with PDA detector (Surveyor PDA plus, Finnigan). Optimum condition for the LC-MS analysis was standardized by direct infusion of standard. Optimized conditions for the analysis of anthocyanins were: ion scan: positive mode, spray voltage: 4.5 kV, spray current: 0.44 μA; sheath gas flow: 28.5; auxiliary gas flow: 14.45; capillary voltage and temperature: 37.98 V and 280 °C. For the LC/MS analysis, the compounds eluted from the column after the PDA detection was analysed by mass detector (Xcalibur™, ThermoFinnigan) using SRM (selected reaction monitoring) in a mass range of 150–1500 u.
For the identification of phenolics other than anthocyanins, HPLC-MS/MS analysis was performed using an Alliance HPLC system coupled to a Quattro Premier™ XE tandem quadrupole mass spectrometer (Waters, Manchester, UK). The software used for the analysis was MassLynx 4.1 equipped with QuanLynx software (Waters). The chromatographic separation was carried out on an Atlantis T3 (100 × 2.1 mm, 5 μm; Waters India Pvt.Ltd) stationary phase. The mobile phase was consist of Solvent A [Methanol: water (10:90) + 0.1 % formic acid] and solvent B [Methanol: water (90:10) + 0.1 % formic acid] with flow rate of 0.3 mL min−1. An auto-sampler was used to inject 10 μL. The mobile phase was consisted of 0–1 min (10 % B); 7 min (98 % B), and 7–13 min (98 % B), 13–14 min (98–10 % B) and 14–20 min (10 % B) for the all selected analytes. A tandem quadrupole mass spectrometer (Quattro Premier™ XE) was operated in positive polarity with an electrospray-ionization (ESI) source. Operating conditions for the mass analysis were done using capillary voltage of 3.0 kV; ion source temperature of 120 °C; cone gas flow, 50 L h−1; desolvation gas flow of 900 L h−1 (both gases were nitrogen); and collision gas flow of 0.3 mL min−1 (argon).
Identification of anthocyanins
Retention times and UV-Vis spectra of standards compounds were used for the identification of anthocyanin by comparision. Further confirmed by spiking the samples with standards. Anthocyanidins were characterized after acid hydrolysis followed by mass spectrometric analysis. Unknown chromatographic peaks were tentatively identified via their MS/MS data and by literature data (Wu and Prior 2005).
Antioxidant assay
DPPH (2,2-diphenyl −1-picrylhydrazyl) assay: DPPH assay was done by following previously described method (Benzie and Strain 1996). The anthocyanins/standards were re-suspended in MeOH. Methanolic DPPH (0.0634 mM) was used for the analysis. MeOH and ascorbic acid was used as negative and positive controls. An aliquot (3.9 ml) of methanolic DPPH solution was added to 0.1 ml of extract and vortexed vigorously. The colour change was measured at 515 nm after 30 min till absorbance reached a steady state. Triplicate values were recorded from three replications. Inhibition percent was calculated using the standard equation. Inhibition (%) was plotted against concentration, and the IC50 value was calculated.
FRAP (Ferric reducing ability of plasma) assay: The FRAP assay measures the antioxidant capacity of compound to reduce ferric-tripiridyltriazine (Fe3+-TPTZ) to a ferrous form (Fe2+) that absorbs light at 593 nm (Brand-Williams et al. 1995). Measurements was recorded after 4 min.
CUPRAC (Cupric ion reducing antioxidant capacity) assay: The CUPRAC assay principle lies on the utilization of copper (II) -neocuproine (Cu(II)-Nc) reagent as the chromogenic oxidizing agent. 1 ml Cu(II)-Nc and NH4Ac buffer mixture, anthocyanin sample (or standard) and H2O were added to make the final volume of 4.1 ml. Change in absorbance was measured at 450 nm against a reagent blank after 30 min (Apak et al. 2006).
MTT [3-(4,5-Dimethylthiazol-2-yl)-2,5-Diphenyltetrazolium Bromide] assay: Stock solution of anthocyanins/standard and MTT were prepared in dimethyl sufoxide (DMSO). An aliquot of 780 μL MTT solution and 20 mL of test compounds, extracts and controls were vortexed in a capped glass vial for 1 min. The reaction mixture was then incubated at 37 °C for 6 h. Finally absorbance was measured at 570 nm (Liu and Nair 2010).
Concentration range for the anthocyanin was ranged between 1000 to 62.5 mg L−1 and for vit-C it was 250 to 15.5 mg L−1.
Results and discussion
Characterization of anthocyanins
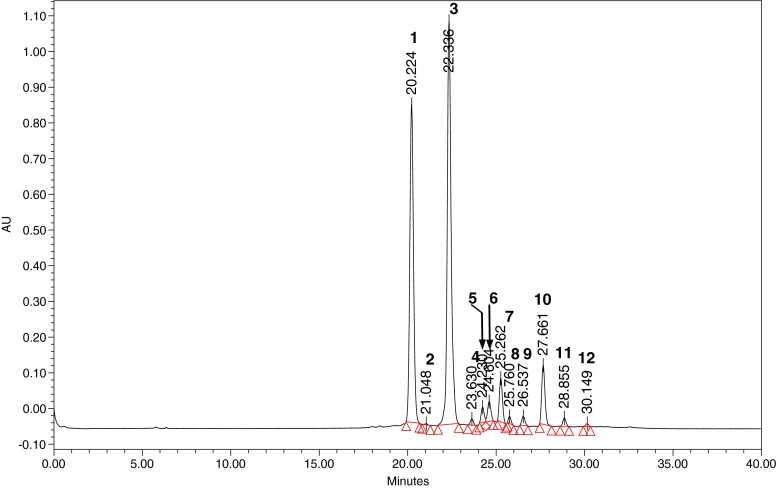
Purified B. lycium extract after HPLC analysis yielded a number of peaks that absorbed maximum visible light at 520 nm. After the detail study of the HPLC profiles at 280 nm and 520 nm (Fig. 1), it was observed that the extract contains anthocyanins as its major constituents but it also contains other phenolic compounds.
Fig. 1.
HPLC chromatogram of B. lycium anthocyanins
After extraction and purification of anthocyanin from the B. lycium berry, HPLC analysis was done to see the number of compounds present in the extract. HPLC profile of the purified extract of B. lycium revealed that there were two major peaks followed by two minor. Another eight minute peaks were also visible in the LC chromatogram. Each peak was analysed separately in order to characterize them.
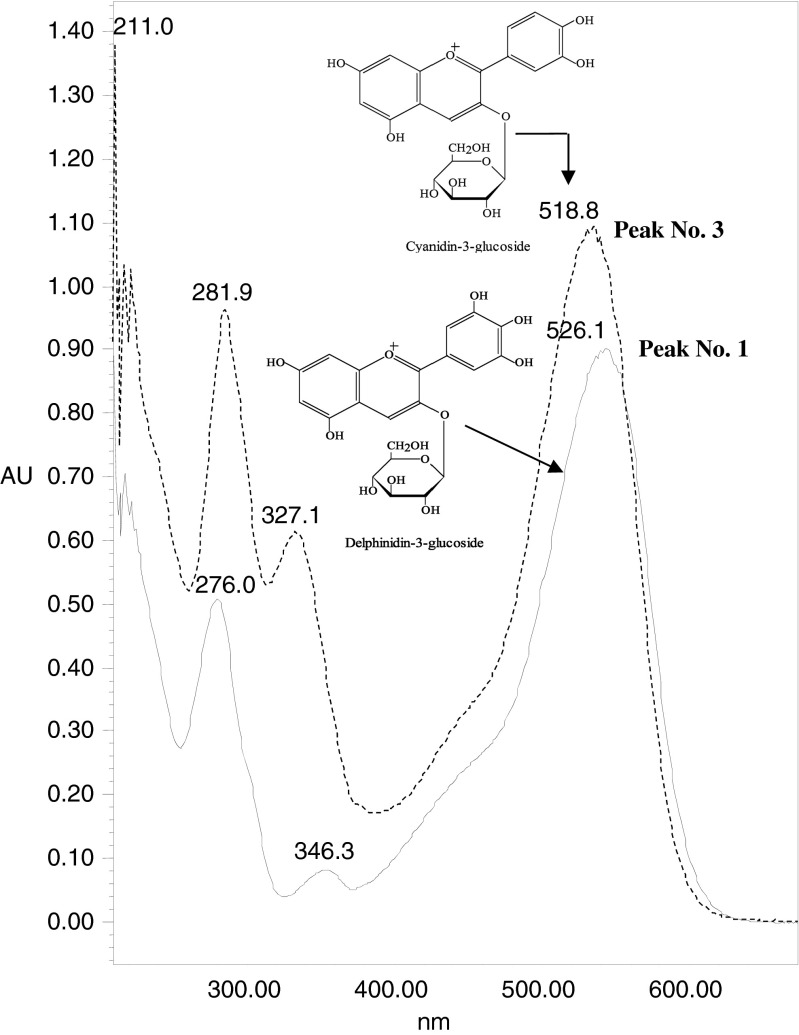
The first major peak 1 which eluted at retention time of 20.224 min in LC gave a PDA spectrum with maxima at 527.4 nm (Fig. 2). It is one of the major peak in the anthocyanin mixture of B. lycium berry out of two. Preliminary observation from the Rt value and its UV spectrum, it was considered to be delphinidin-3-glucoside (D3-G) (confirmed by LC run of commercial standard). After the run of D3-G standard, it was found that the Rt matches with the peak. It was further confirmed by the spiking of the standard with the extract. In LC/MS analysis it was found that the peak had a molecular ion (M+) at 465 and a fragment ion at m/z 303 (M+-162). It comprised of 35 % of total anthocyanin present in the B. lycium berry.
Fig. 2.
UV spectrum of two major anthocyanins present in B. lycium
Peak 2 (Rt 21.048 min) eluted between two major peaks and it had a molecular ion (M+) peak at m/z 581, base peak at m/z 287 attributed to a loss of M-294 (one lathyrosyl molecule).Peak 3 (Rt 22.336 min) showed an M+ peak at m/z 449 and m/z 287 cyanidin base peak formed by loss of a sugar unit (M+–162). The 3-glucoside conjugates of anthocyanidin (cyanidin) showed a loss of m/z 162 fragment, corresponds to a loss of glucose or galactose unit. (Table 1). In HPLC analysis of standard C3-G confirmed that molecule had glucose unit as the sugar attached with cyanidin. Thus the peak 2 characterised as cyanidin-3-glucoside and it constituted 47.24 % of total anthocyanin. Co-elution and spiking of C3-G finally confirmed the peak as cyanidin-3-glucoside.
Table 1.
HPLC, UV and MS data of anthocyanins of Berberis lycium
| Peak no. | Rt (HPLC-PDA) min | λmax (nm) | M+ (m/z) | Fragmentations (m/z) | Putative compound | %* |
|---|---|---|---|---|---|---|
| 1 | 20.22 | 527.4 | 465 | 303 | Delphinidin-3-glucoside | 35.32 |
| 2 | 21.05 | 520 | 581 | 287 | Cyanidin-3-lathyroside | 0.08 |
| 3 | 22.34 | 518.8 | 449 | 287 | Cyanidin-3-glucoside | 47.24 |
| 4 | 23.63 | 526.1 | 595 | 449, 287 | Cyanidin-3-rutinoside | 0.53 |
| 5 | 24.23 | 518.8 | 449 | 287 | Cyanidin-3-galactoside | 1.62 |
| 6 | 24.60 | 501.8 | 565 | 271 | Pelargonidin-3-pentoxilhexoside | 2.26 |
| 7 | 25.26 | 529.8 | 655 | 493, 331 | Malvidin-3,5-dihexoside | 4.21 |
| 8 | 25.76 | 523.7 | 433 | 271 | Pelargonidin-hexoside | 0.58 |
| 9 | 26.54 | 527.4 | 595 | 433, 271 | Pelargonidin- 3,5-diglucoside | 1.05 |
| 10 | 27.66 | 520 | 611 | 449, 287 | Cyanidin-3,5-dihexoside | 6.12 |
| 11 | 28.86 | 520 | 609 | 463, 301 | Peonidin-3-rutinoside | 0.77 |
| 12 | 30.15 | 505.4 | 579 | 433, 271 | Pelargonidin-3-rutinoside | 0.22 |
*Calculated based on area under peak in HPLC chromatogram
After elution of two major anthocyanin, D3-G and C3-G, peak 4 with λmax of 526.1 was eluted at Rt of 23.63 min as a minor peak. Loss of 308 and 162 confirmed the loss of rutinoside and glucosyl unit. Thus the peak characterized as Cyanidin-3-rutinoside. Peak 5 (Rt 24.229 min) had a molecular ion (M+) at 449 and a fragment ion at m/z 287. UV absorption maxima was recorded as 518.8 nm. By analyzing the mass fragmentation pattern and λmax, the peak was identified as Cyanidin-3-galactoside. Peak 4 and 5 constituted 0.5 and 1.6 % of total anthocyanin concentration.
Peak 6 (Rt 24.60 min, M+ 565) was characterized as Pelargonidin-3-pentoxilhexoside after examining the fragmentation of molecular ion into m/z at 271. λmax of 501.8 and second of 278 confirms the structure of the anthocyanin. The compound constituted 2.3 % of the total anthocyanin.
Peak 7 was eluted at 25.26 min with λmax of 529.8 nm was identified as Malvidin-3,5-dihexoside after examining the mass spectrometric data. The peak had molecular ion (M+) at 655 and fragment ion at m/z 493 (M+-162) and 331 (M+-162–162). Loss of 324 confirmed the loss of two glucosyl unit further confirmed the sugar unit attached to the anthocyanidin moiety. Fragment ion of m/z 331 confirms the aglycone unit as malvidin. Thus the peak was identified as Malvidin-3,5-dihexoside. The peak constituted 4.2 % of total anthocyanin.
Peak 8 (Rt 25.76 min) is another anthocyanin present in B. lycium and it had a molecular ion at 433 (M+). Its fragment ion of m/z 271 (M+-162) confirms the structure of the peak as Pelargonidin-hexoside. The compound constitutes 0.6 % of total anthocyanin.
Peak 9 and 10 was characterized as Pelargonidin- 3,5-diglucoside and Cyanidin-3,5-dihexoside by their mass spectral characteristics as well as UV absorption fingerprint. These two peaks eluted at 26.54 and 27.66 min in the HPLC run. Molecular ion peak of peak 9 was 595 with fragments of 433 (M+-162), 271 (M+-162) and for peak 10 was 449 (M+-162) and 287 (M+-162). λmax value of these peaks were analysed for identification of compound.
Peak 11, eluted at 28.86 min with λmax of 520 nm was identified as Peonidin-3-rutinoside after examining the mass spectrometric data. The peak had molecular ion (M+) at 609 and fragment ion at m/z 463 (M+-146) and 301 (M+-146–162). Rutinoside conjugate of the anthocyanin provided a loss of a m/z 146 fragment unit, corresponds to rhamnose sugar unit and glucose unit (loss of a m/z 162 fragment). Fragment ion of m/z 301 confirms the aglycone unit as peonidin. Thus the peak was confirmed as peonidin-3-rutinoside.
Peak 12 (Rt 30.15 min) showed an M+ anthocyanin peak at m/z 579 and anthocyanidin peak at m/z 271, which was formed by loss of a two monosaccharide units (M+–162–146) (Table 1). The characteristic λmax of 505.4 nm was helpful in characterising the molecule as pelargonidin-3-rutinoside. The compound constitutes 0.2 % of total anthocyanin.
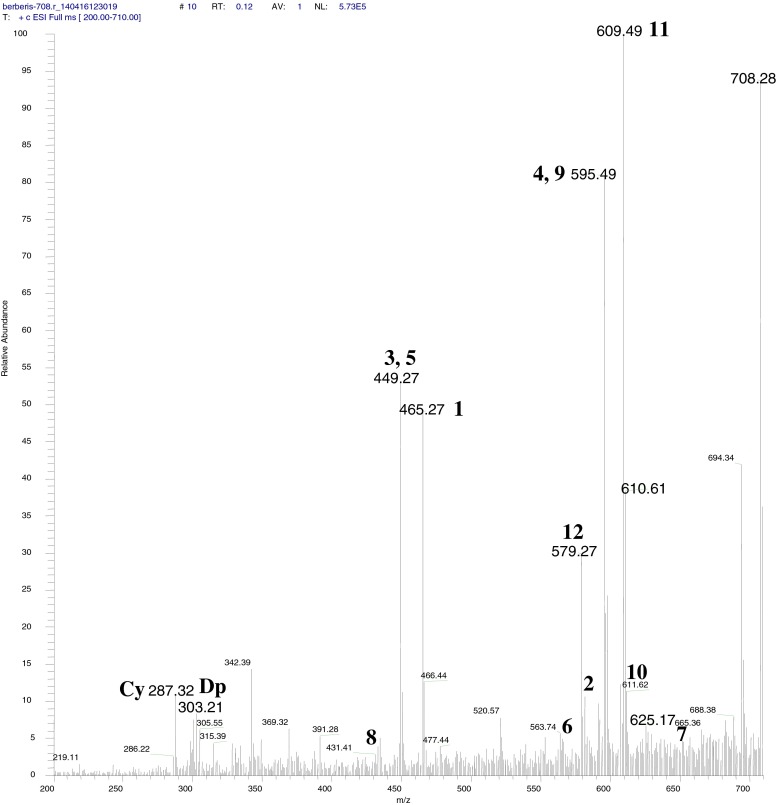
Characteristic features of individual anthocyanins viz. retention times, order of elution, UV-Visible spectral characteristics and λmax, comparison to standards and MS/MS data were used for the final identification (Fig. 3). These pigments were: Delphinidin-3-glucoside (35.3 %), Cyanidin-3-lathyroside (0.08 %), Cyanidin-3-glucoside (47.2 %), Cyanidin-3-rutinoside (0.53 %), Cyanidin-3-galactoside (1.62 %), Pelargonidin-3-pentoxilhexoside (2.26 %), Malvidin-3,5-dihexoside (4.21 %), Pelargonidin-hexoside (0.58 %), Pelargonidin- 3,5-diglucoside (1.05 %), Cyanidin-3,5-dihexoside (6.12 %), Peonidin-3-rutinoside (0.77 %), Pelargonidin-3-rutinoside (0.22 %) (Fig. 1).
Fig. 3.
Total ion chromatogram (TIC) of direct infusion of anthocyanin mixture. Peak numbers are presented in Table 1
The identified anthocyanins presented in this present paper have been reported previously in south Patagonian wild berries (Ruiz et al. 2013a). Anthocyanin profile found in this species (lycium) of Berberis were different from the other species (Ruiz et al. 2010; Jimenez et al. 2011). In both Berberis boliviana and B. microphylla, three major anthocyanins were reported. Reported anthocyanins were delphinidin-3-glucoside, petunidin-3-glucoside and malvidin-3-glucoside. In the B. lycium berry, delphinidin-3-glucoside and cyanidin-3-glucoside were the major anthocyanins apart from other minor anthocyanins. Interestingly, both petunidin-3-glucoside and malvidin-3-glucoside were absent in the B. lycium berry. Ruiz et al. 2013a reported similar anthocyanin profile in B. ilicifolia and empterifolia also, where delphinidin-3-glucoside was present in maximum concentration.
Characterization of phenolics other than anthocyanin
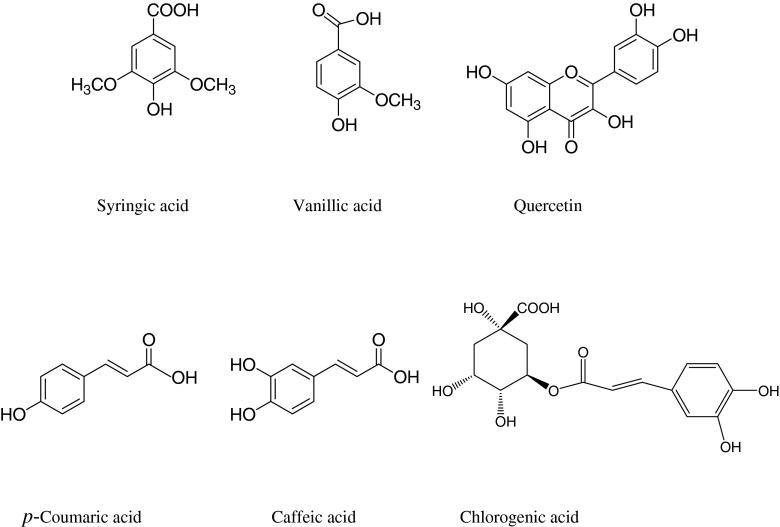
Table 2 shows the retention time and MS/MS spectral data of the phenolics present in the methanolic extract of B. lycium. Phenolics were characterized based on the multiple reaction monitoring (MRM) data analysed by LC-TQD-MS/MS instrument. The compound specific parameters used cone voltages, and collision energies in MRM are presented in Table 2. A total of six phenolics were identified based on their retention time of standards and their mass fragmentation patterns. Out of six phenolics, five compounds were identified as phenolic acids and one flavonol. Out of five phenolics acids, two were hydroxybenzoic acid derivatives and three were cinnamic acid derivatives (Fig. 4). Out of five phenolics acids, chlorogenic acids were in maximum concentration and the compound was identified by its molecular ion (M + H+) of 355 and its fragment ion of 163 and 145. Loss of caffeic acid by breaking the ester bond produces fragment ion at m/z 163 and further loss of –COOH group yielded fragment at m/z 145. Second compound was having [M + H]+ at 181 and its fragment ions at m/z 163 [M-OH]+ and 135 [M-COOH]+, confirmed the compound as caffeic acid. Third phenolics acid was identified as coumaric acid with [M + H]+ at 165. Its fragments were recorded at m/z of 147 [M-OH]+ and 119 [M-COOH]+. Compound with molecular ion of 199 [M + H]+ and fragments at m/z 155 [M-COOH]+ and 123 [M-COOH-OCH3]+ was identified as syringic acid. Fifth compound was identified as vanillic acid after analyzing its molecular ion peak 169 [M + H]+ and its mass fragments at m/z of 125 and 93. Fragments were identified as loss of –COOH and –OCH3 sequentially. Only flavonol identified as quercetin by its molecular ion of 303 and its fragmented ions at m/z 152.5 and 136.5, with the loss of ring attached at 2 position of the isoflavone unit and further breaking of C3 ring.
Table 2.
LC-MS/MS parameters for the selected phenolic compounds
| Sr.no. | Name of compounds | RT (min.) | ESI+ | Transition | Cone voltage (V) | CE (V) |
|---|---|---|---|---|---|---|
| 1 | Chlorogenic acid | 5.06 | 355 | 355>135 355>163 |
21 | 26 30 |
| 2 | Caffeic acid | 5.44 | 181 | 181>135 181>163 |
16 | 17 14 |
| 3 | Vannilic acid | 5.47 | 169 | 169>93 169>125 |
25 | 21 14 |
| 4 | Syringic acid | 5.52 | 199 | 199>77 199>123 199>155 |
25 | 38 18 14 |
| 5 | P-coumaric acid | 6.05 | 165 | 165>91 165>119 165>147 |
20 | 20 18 10 |
| 6 | Quercetin | 7.89 | 303.03 | 303.03>136.5 | 50 | 48 |
Fig. 4.
Chemical structures of phenolics other than anthocyanin characterized in the methanolic extract of Berberis lycium
Flavonols present in conjugated form was reported by Ruiz et al. 2010 in B. microphylla berry. Those were myricetin, quercetin and isorhamnetin glucosides present in different concentrations. Hydroxycinnamic acid derivatives present in the B. microphylla was also reported by the authors in a different study (Ruiz et al. 2013b). Gundogdu 2013 also reported similar phenolic compounds present in B. vulgaris as the present study. The study also reported that chlorogenic acid was in maximum concentration apart from other phenolics like catechin, gallic acid, caffeic, coumaric and syringic acid etc.
Antioxidant activity
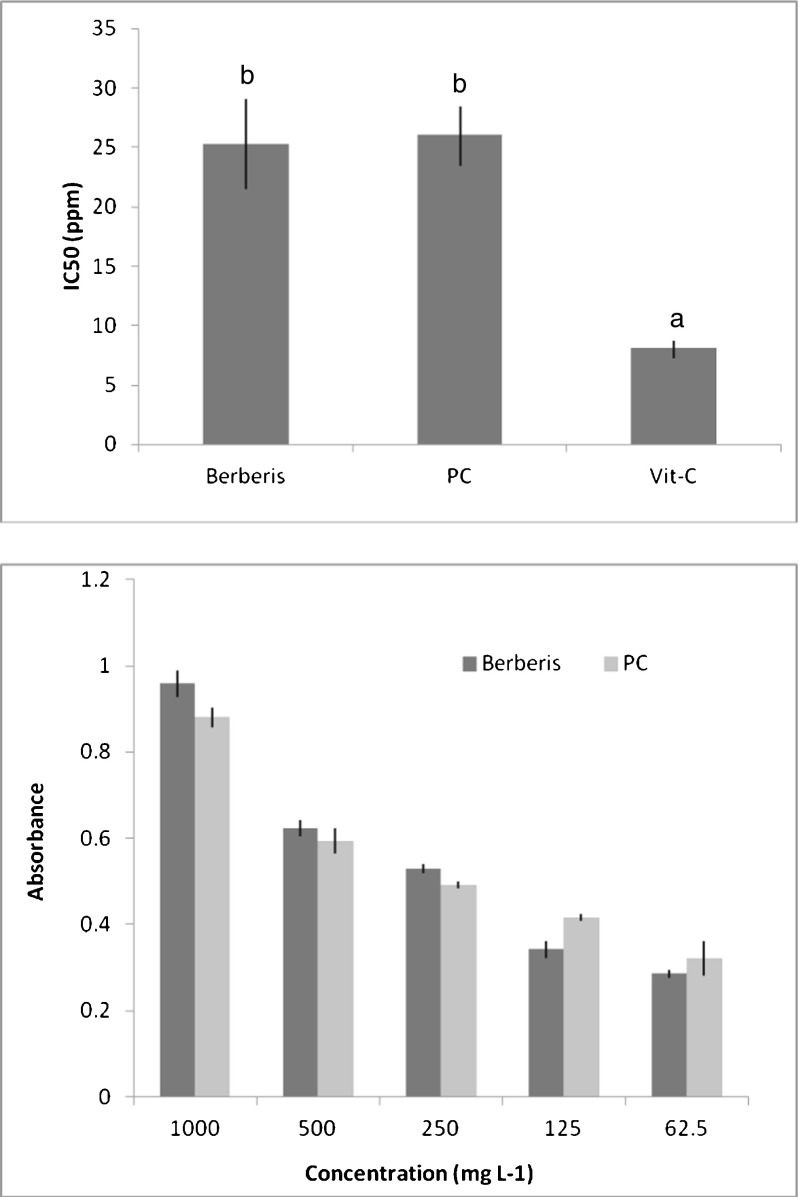
Purified anthocyanin was evaluated for its antioxidant activity using DPPH assay. Five concentrations were evaluated to calculate IC50 value. IC50 value of the purified extract of B.lycium berry 25.3 μg ml−1, whereas IC50 of positive control purple cabbage (PC) anthocyanin and vit-C were 26.1 and 8.1 μg ml−1 (Fig. 5).
Fig. 5.
DPPH and MTT assay of anthocyanin and purple cabbage (Positive control). Bars sharing the same letter are not significantly different (P < 0.05). Concentration of vit-C were 250, 125, 62.5, 31.25 and 15.5 mg L−1
In CUPRAC assay Berberis anthocyanin showed 350 μM trolox equivalent (TE), whereas PC showed 389 μM TE. In FRAP assay, B. lycium anthocyanin showed activity value of 80.3 vitamin-C equivalent (VCE). In the same assay, positive control, PC anthocyanin showed 62.4 VCE (Table 3). In general, higher FRAP and CUPRAC assay correlated with anthocyanin as well as total phenol content (Apak et al. 2007).
Table 3.
CUPRAC and FRAP assay of anthocyanins from Berberis lycium
| Compound | CUPRAC assay (μM TE) |
FRAP assay VCE (μg ml-1 ) |
|---|---|---|
| B. lycium | 35.04a± 0.56 | 80.3b ± 2.8 |
| Purple cabbage | 38.93b ± 0.52 | 62.4a ± 1.5 |
Columns sharing the same letter are not significantly different (P<0.05)
Evaluation of antioxidant potential can be measured by different in vitro methods and FRAP assay is one of them. The assay is the most rapid tests and very useful for large number of samples (Schlesier et al. 2002). Earlier researcher reported that the use of more than one method for determination of antioxidant activity is essential due to differences between the test systems.
Anthocyanin from B. lycium was also evaluated for antioxidant activity using MTT assay. The MTT assay detects compounds that are capable of reducing an oxidizing agent (Liu and Nair 2010). Berberis anthocyanin at concentration 62.5–1000 μg ml−1 gave absorbance value in the range between 0.29 and 0.96. Positive control PC anthocyanin gave absorbance in the range of 0.32–0.88 across the concentration range (Fig. 5).
Antioxidant activity of B. microphylla berry was reported as 50.8–99.5 μmol g−1 of trolox equivalent (Ruiz et al. 2010). Present study recorded the activity as 35.0 μmol g−1 of trolox equivalent and which was a shade less than the antioxidant activity of red cabbage anthocyanin, which was taken as reference control. In B. empetrifolia, ABTS assay revealed that the antioxidant activity was in the range of 41.7–73.9 μmol g−1 of trolox equivalent (Ruiz et al. 2013a).
Conclusions
Anthocyanin profile of Berberis lycium berry collected from the Himalayan region in India showed high predominance of two anthocyanins, namely delphinidin-3-glucoside (43.7 %) and cyanidin-3-glucoside. Total twelve anthocyanins were identified in the purified extract of Berberis berry by LC-MS and UV spectral analysis. Ten minor anthocyanins were also characterized and those are glycosides of cyanidin, pelargonidin, peonidin and malvidin. Among other phenolics, chlorogenic acid was predominant apart from caffeic, vannilic, syringic and coumaric acids.
The fruit is being consumed in local level as wild berry. Its nutraceuticals potential will definitely provide momentum towards further research for its application in food systems especially in functional foods.
Acknowledgments
Authors are thankful to Head, Division of Agricultural Chemicals for providing all the required facilities. Authors are also thankful to Dr. Kaushik Banerjee for his help in LC-MS/MS analysis of phenolics. Authors thank Dr. Jashbir Singh and Dr. Khushbu Sharma for extending their help during the research work.
Compliance with ethical standards
Conflict of interest
There is no conflict of interest between the authors.
References
- Andola H, Rawal RS, Rawat MSM, Bhatt ID, Purohit VK. Analysis of berberine content using HPTLC fingerprinting of root and bark of three Himalayan Berberis species. Asian J Biotechnol. 2010;2:239–245. doi: 10.3923/ajbkr.2010.239.245. [DOI] [Google Scholar]
- Apak R, Guçlu K, Ozyurek M, Esin Karademir S, Ercag E. The cupric ion reducing antioxidant capacity and polyphenolic content of some herbal teas. Int J Food Sci Nutr. 2006;57:292–304. doi: 10.1080/09637480600798132. [DOI] [PubMed] [Google Scholar]
- Apak R, Kubilay G, Birsen D, Mustafa O, Saliha Esin C, Burcu B, Berker KI, Dilek O. Comparative evaluation of various total antioxidant capacity assays applied to phenolic compounds with the CUPRAC assay. Molecules. 2007;12:1496–1547. doi: 10.3390/12071496. [DOI] [PMC free article] [PubMed] [Google Scholar]
- Benzie IFF, Strain JJ. The ferric reducing ability of plasma (FRAP) as a measure of “antioxidant power”: the FRAP assay. Anal Biochem. 1996;239:70–76. doi: 10.1006/abio.1996.0292. [DOI] [PubMed] [Google Scholar]
- Brand-Williams W, Cuvelier M E, Berset C. Use of free radical method to evaluate antioxidant activity. LWT Food Sci Tech. 1995;28:25–30. doi: 10.1016/S0023-6438(95)80008-5. [DOI] [Google Scholar]
- Cao G, Muccitelli U H, Sanchez Moreno C, Prior RL. Anthocyanins are absorbed in glycated forms in elderly women: a pharmacokinetic study. Am J Clin Nutr. 2001;73:920–962. doi: 10.1093/ajcn/73.5.920. [DOI] [PubMed] [Google Scholar]
- Du CT, Francis FJ. Anthocyanins of Roselle (Hibiscus sabdariffa) J Food Sci. 1974;38:810–812. doi: 10.1111/j.1365-2621.1973.tb02081.x. [DOI] [Google Scholar]
- Gundogdu M. Determination of antioxidant capacities and biochemical compounds of Berberis vulgaris L. Fruits. Adv Environ Biol. 2013;7(2):344–348. [Google Scholar]
- Hertog M G, Feskens E J, Hollman P C, Katan M B, Kromhout D. Dietary antioxidant flavonoids and risk of coronary heart disease: the zutphen elderly study. Lancet. 1993;342:1007–1011. doi: 10.1016/0140-6736(93)92876-U. [DOI] [PubMed] [Google Scholar]
- Hertog M G L, Aravanis C, Blackburn H, Buzina R, Fidanza F, Giampaoli S, Jansen A, Menotti A, Neddeljkovic S, Pekkarinen M, Simic B S, Toshima H, Feskens E J, Hollman P C H, Katan M B. Flavonoid intake and long-term risk of coronary heart disease and cancer in the seven countries study. Arch Int Med. 1995;155:381–386. doi: 10.1001/archinte.1995.00430040053006. [DOI] [PubMed] [Google Scholar]
- Jimenez CDC, Flores CS, He J, Tian Q, Schwart SJ, Giusti MM (2011) Characterization and preliminary bioactivity determination of Berberis boliviana Lechler fruit anthocyanins. Food Chem 128:717–724
- Liu Y, Nair M G. An efficient and economical MTT assay for determining the antioxidant activity of plant natural product extracts and pure compounds. J Nat Prod. 2010;73(7):1193–1195. doi: 10.1021/np1000945. [DOI] [PubMed] [Google Scholar]
- Pietta P G. Flavonoids as antioxidants. J Nat Prod. 2000;63:1035–1042. doi: 10.1021/np9904509. [DOI] [PubMed] [Google Scholar]
- Pomilio AB. Anthocyanins in fruits of Berberis buxifolia. Phytochem. 1973;12:218–220. doi: 10.1016/S0031-9422(00)84657-9. [DOI] [Google Scholar]
- Revilla E, Ryan JM, Martín-Ortega G. Comparison of several procedures used for the extraction of anthocyanins from red grapes. J Agric Food Chem. 1998;46:4592–4597. doi: 10.1021/jf9804692. [DOI] [Google Scholar]
- Ruiz A, Hermosín-Gutierrez I, Mardones C, Vergara C, Herlitz E, Vega M, von Baer D. Polyphenols and antioxidant activity of calafate (Berberis microphylla) fruits and other native berries from southern Chile. J Agric Food Chem. 2010;58:6081–6089. doi: 10.1021/jf100173x. [DOI] [PubMed] [Google Scholar]
- Ruiz A, Hermosín-Gutiérrez I, Vergara C, von Baer D, Zapata M, Hitschfeld A, Obando L, Mardones C. Anthocyanin profiles in south Patagonian wild berries by HPLC-DAD-ESI-MS/MS. Food Res Int. 2013;51(2):706–713. doi: 10.1016/j.foodres.2013.01.043. [DOI] [Google Scholar]
- Ruiz A, Mardones C, Vergara C, Hermosín-Gutiérrez I, von Baer D, Hinrichsen P, Dominguez E. Analysis of hydroxycinnamic acids derivatives in calafate (Berberis microphylla forst) berries by liquid chromatography with photodiode array and mass spectrometry detection. J Chromatogr A. 2013;1281:38–45. doi: 10.1016/j.chroma.2013.01.059. [DOI] [PubMed] [Google Scholar]
- Sasikumar JM, Maheshu V, Smilin AG, Gincy MM, Joji C. Antioxidant and antihemolytic activities of common nilgiri barberry from south India. Int Food Res J. 2012;19(4):1601–1607. [Google Scholar]
- Schlesier K, Harwat M, Böhm V, Bitsch R. Assessment of antioxidant activity by using different in vitro methods. Free Rad Res. 2002;36(2):177–187. doi: 10.1080/10715760290006411. [DOI] [PubMed] [Google Scholar]
- Sood P, Modgil R, Sood M. Physico-chemical and nutritional evaluation of indigenous wild fruit kasmal, Berberis lycium Royle. Ind J Nat Prod Resour. 2010;1(3):362–366. [Google Scholar]
- Timberlake CF, Bridle P. Distribution of anthocyanins in food plant. Anthocyanins as food colors. New York, USA: Academic Press, Inc.; 1982. p. 137. [Google Scholar]
- Wang H, Cao G, Prior RL. Total antioxidant capacity of fruits. J Agric Food Chem. 1996;44:701–705. doi: 10.1021/jf950579y. [DOI] [Google Scholar]
- Wu X, Prior RL (2005) Systemic identification and characterization of anthocyanins by HPLC-ESIMS/MS in common foods in the United States: fruits and berries. J Agric Food Chem 53:2589–2599 [DOI] [PubMed]


