Abstract
Background:
High-dose methotrexate (HD-MTX) with folinic acid (leucovorin) rescue is the gold standard therapy in the treatment of osteosarcoma. The plasma concentration of MTX is closely related to efficacy and toxicity. There are large individual differences. Many authors have described the pharmacokinetic (PK) profile of MTX regarding osteosarcoma under a variety of circumstances. However, no data concerning Chinese osteosarcoma patient PKs using the nonlinear mixed effects models (NONMEM) have been previously reported. The goals of this study were to establish the population pharmacokinetics (PPK) of HD-MTX treatment in Chinese osteosarcoma patients, and to explore the influence of patient covariates and between-occasion variability on drug disposition.
Methods:
An intravenous HD-MTX solution (10 g/m2) was given 274 times to 148 osteosarcoma patients. MTX plasma concentrations were measured at 0, 6, 12, 24, 48 and 72 h after commencement of the infusion, and the fluorescence polarization immunoassay was used to determine MTX plasma concentrations. The PPK model and parameters were estimated using NONMEM software. The effects of fixed-effect factors were evaluated, and the final regression model was obtained.
Results:
The following population parameters were obtained using a two-compartment model: CL1 (clearance of central compartment):
(CL1)i = CL1TV × [1- θCL1 −MTXNUM × MTXNUM]×[1-θCL1 −CrCI1 × (CrCl1 −1.89)]×eηCL1i (L/h). V1 (central volume):
(V1)i = V1TV × eηV1i (L). CL2 (clearance of peripheral compartment):
(CL2)i = CL2TV ×[1- θCL2 −BODYAREA × (bodyarea − 1.62)]×eηCL2i (L/h). V2(peripheral compartment):
(V2)i = V2TV ×[1 − θV2−bodyarea × (bodyarea-1.62)]× eηV2i (L). The PPK parameters (RSD%) were CL1, V1, CL2 and V2 with values of 6.20 L/h (8.48%), 19.6 L (extremely small), 0.0172 L/h (50.9%) and 0.515 L (39.1%), respectively. Creatinine clearance and the number of methotrexate chemotherapy cycles before MTX infusion had a significant effect on the CL1, and body surface area had a significant effect on the CL2 and the V2 (P < 0. 01).
Conclusions:
A good fit was derived for the PPK. The model could be used to provide guidance for MTX treatment and reduce adverse effects.
Keywords: Methotrexate, Osteosarcoma, Population Pharmacokinetics
INTRODUCTION
Osteosarcoma is the most common primary malignant bone tumor. Over the past decades, dramatic improvements have been made in the treatment of and the final clinical outcomes for this highly aggressive disease. The concept of administering chemotherapy before definitive surgery on the primary tumor was first introduced by Rosen et al.[1,2] Since then, high-dose methotrexate (HD-MTX) with folinic acid (leucovorin) rescue is still the gold standard therapy in the treatment of osteosarcoma. Today, with the combination of preoperative or “neoadjuvant” chemotherapy including HD-MTX, cisplatin, ifosfamide or doxorubicin and radical surgery, disease-free survival rates of ≤70% can be achieved.[3]
There is a close relationship between MTX concentration, adverse reaction and treatment effect, with large individual differences. The incidence of toxicity has decreased as a result of plasma MTX concentration monitoring and appropriate leucovorin rescue, combined with adequate hydration and urine alkalinization. Effective concentration of MTX in the blood can significantly increase the clinical tumor necrosis rate.[4,5] Recent studies have reported that a serum MTX concentration of 1000 μmol/L after a 4 h infusion and 700 μmol/L after a 6 h infusion can achieve good efficacy in the treatment of osteosarcoma. However, the higher the concentration of MTX is, the more side effects it will cause. The safe range for the area under the curve has been found to be between 4000 mM/h and 12,000 mM/h.[6]
Therefore, it is important to obtain the individual pharmacokinetic (PK) parameters. The scattered serum drug concentration of MTX and the estimated population pharmacokinetics (PPK) parameters were analyzed in the present study using the nonlinear mixed effect model (NON-MEM), the established PPK model employed for Chinese patients with osteosarcoma, and used to help obtain the final PPK model. We also examined the effects of some covariates (including height, body weight and other factors) on the PPK parameters and hence that our study could provide evidence for clinically personalized medication. In a further step, its implementation in the TDM software (Vital Scientific N.V.) that is most commonly used in the clinical setting might help optimize MTX dosing in patients with osteosarcoma and consequently, improve clinical outcome. Moreover, PPK models can also account for both the PK between-subject and between-occasion variability, allowing individual tailoring of the optimal dose.[7,8]
The goals of the present study were: (1) To establish the PPK of HD-MTX treatment in Chinese osteosarcoma patients; and (2) to explore the influence of patient covariates and between-occasion variability on drug disposition.
METHODS
Subjects
This study included 148 patients with osteosarcoma, who had received HD-MTX treatment for a total of 274 times (194 for males and 80 for females) from August 2009 to August 2010 in our department. Patients had the following characteristics: Age, 17.00 ± 7.06 years; height, 166.00 ± 12.44 cm; body weight, 58.00 ± 18.28 kg; and body surface area, 1.63 ± 0.27 m2.
High-dose methotrexate administration
In the first phase (hyperhydration and urine alkalinization) a 500 ml 5% glucose injection (GDD) + a 500 ml 5% glucose and sodium chloride (GNS) injection + 10 ml of 15% KCL; (2) 200 ml 5% NaHCO3 was given at 12 h before MTX infusion.
The second phase (MTX infusion) consisted of seven groups of drugs that were consecutively administered: (1) 500 ml 5% GDD + 500 ml 5% GNS + 10 ml 15% KCL; (2) 100 ml 5% NaHCO3; (3) 2 mg vincristine + 10 ml 0.9% sodium chloride (NaCl); (4) 500 ml 5% GDD + 8–12 g/m2 MTX for 4–6 h in darkness; (5) 1000 ml 5% GDD; (6) 1000 ml 5% GNS + 10 ml 15% KCL; (7) 200 ml 5% NaHCO3; (8) 100 ml 0.9% NaCl + 5 mg3 Tropisetron.
In the third phase (hyperhydration and urine alkalinization) the following compounds were administered: (1) 100 ml 0.9% NaCl + 5 mg Tropisetron; (2) 1000 ml 5% GDD; (3) 1000 ml 5% GNS + 10 ml 15% KCL; and (4) 200 ml 5% NaHCO3.
During chemotherapy, 1.0 tid NaHCO3 and 200 mg tid allopurinol was taken orally daily. Urine volume was recorded over a 24 h period, and urinary pH between 7 and 9 was monitored.
Cystic fibrosis rescue solution
At 6–8 h after the end of MTX infusion 12 mg q6h leucovorin cystic fibrosis (CF) rescue was given until the serum concentration of MTX was reduced to 0.05 μmol/L. If delayed excretion occurred, the dose of CF was increased according to the standard.
Blood collection
Two mililitre of blood was drawn from the lateral vein at 0, 6, 12, 24, 48 and 72 h after MTX infusion. If the drug concentration in the blood was ˃0.05 μmol/L after 72 h, 2 ml of blood was continuously drawn every 24 h until the concentration was ˂0.05 μmol/L.
Methotrexate assay
Blood samples were centrifuged at 3000 g for 5 min at room temperature in tubes without anticoagulant. MTX concentration was measured using fluorescence polarization immunoassay (TDX, ABBOTT, USA) with a quantification limit of 0.01 μmol/L. The recovery rate of high-, medium- and low-quality control samples was 90–110%. The interday precision was ˂10%.
Population pharmacokinetic analysis
Population pharmacokinetic analysis was performed using the nonlinear mixed effects model (NONMEM, Version V, Level 1.1: GloboMax, USA). A two-compartment model was established for data fitting. The nonlinear least squares principle was applied to find a group of PPK parameters to minimize the value of the objective function (OFV). The values of the OFV among the similar models approximately followed a χ2 distribution: When df = 1, χ20.05, 1 = 3.84, χ20.001, 1 = 10.83. When the parameter numbers between two models differed by 1, if ΔOFV >3.84, there was a significant difference (P < 0.05); if ΔOFV >10.83, there was a highly significant difference (P < 0.001).
Statistical model: Pij=PTV j·Exp(ηij)
where Pij is the ith individual's jth PK parameters, PTVj is the typical group value of the jth PK parameters, and ɳij represents the inter-individual random error of the individual parameter Pij to the group parameter PTVj. The values of ɳij followed the normal distribution, zero in the center with a variance of ω2.
Residual random effect model: CObs = CPred · (1 + ɛ1) + ɛ2 where and CObs and CPred are the actual observed value and the predicted value, respectively. ɛ1 and ɛ2 are inter-individual/inter-experiment random errors, which follow the normal distribution: Zero in the center with a variance of σ21 and σ22. ɛ1 represents the proportional error and ɛ2 represents the additive error.
Fixed effect model:

where PTVij is the typical individual value of the ith individual's jth PK parameter, PTVj is the typical group value of the jth PK parameter, and COVRik and  are the ith individual's kth covariate and its mean, respectively. θjk represents the degree of deviation of the individual parameter from its typical group value when the individual covariate differs from its mean by one unit.
Variable selection
The sample volume independent effect size (ES, statistical effect) was used as the test indicator for the biochemical index collected from the modeling process.[9] An ES between 0.2 and 0.8 was considered as a medium effect, and a median of 0.5 was used here as the critical value. The physiological indexes before and after drug administration were considered as being changed when the ES was ˃0.5, and were then excluded as covariates.
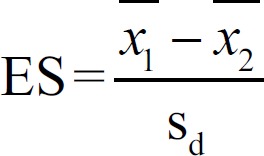
Where Sd is the combined standard deviation. The equation used to calculate the Sd was 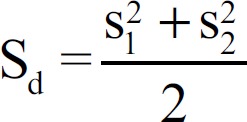 , where the upper line represents the average value, and S is the standard deviation.
Correlation of covariates
The extent of correlation among every element could be visualized using the diagram of covariants created using the R software version 2.12.0 for Windows (Mathsoft, Halethorpe, MD, USA).
Full regression model
The full regression model was established using the stepwise regression method. If the OFV decreased by ˃3.84, the covariate had a significant effect (P < 0.05) on this model, and this covariate should be retained in the model. All covariates with no significant effect were excluded. The full model was obtained after all covariates that had a significant effect were added in.
Final model
All covariates involved in the full regression model were tested using a more rigorous statistical standard (when df = 1, χ20.001, 1 = 10.83). If a change in the OFV was ˃10.83, the covariates were considered to have a significant effect and were retained in the model. Otherwise, the covariates were removed from the model. The final model was obtained through reverse elimination of the full regression model.
RESULTS
Base model
The drug serum concentration-time curve is shown in Figure 1. There were 148 patients with osteosarcoma, who received HD-MTX treatment a total of 274 times. The plot indicated a two-compartment model, and NONMEM, first-order conditional estimation was applied for fitting; the PK of the two-compartment model (OFV) was 487.856.
Figure 1.
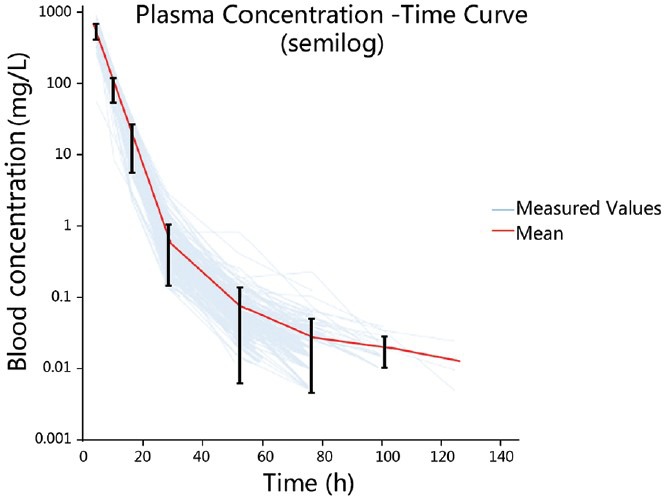
Plots of logarithm concentration versus time after intravenous infusion of methotrexate in 274 patients.
Covariate selection and correlation of covariates
A summary of the selected covariates is given in Table 1. They were: Number of chemotherapy (NUM) cycles; number of methotrexate chemotherapy (MTXNUM) cycles; Volume 1, the volume of infusion 1 day before drug administration (ml); pH 1, pH 1 day before drug administration; T1, body temperature 1 day before drug administration; U1, urine volume 1 day before drug administration (ml).
Table 1.
Covariates investigated during the modeling process
| Covariate [1*] | Median | Minimum | Maximum | n |
|---|---|---|---|---|
| Number | 8 | 1 | 28 | 272 |
| Gender | NA | NA | NA | 274 |
| Age (years) | 17 | 6 | 49 | 274 |
| BMI | 19.95 | 11.32 | 40.17 | 267 |
| Weight (kg) | 58 | 20 | 97 | 268 |
| Volume1 (ml) | 1520 | 710 | 4240 | 259 |
| MTXNUM | 2 | 1 | 12 | 270 |
| BODYAREA (m2) | 1.63 | 0.62 | 2.21 | 270 |
| CrCl1 (ml/min) | 1.88 | 0.94 | 4.64 | 245 |
| pH1 | 8 | 5 | 9 | 258 |
| RBC1 (1 × 10⁹/L) | 4.06 | 2.28 | 5.7 | 264 |
| HCT1 (%) | 36.5 | 20.4 | 48.9 | 262 |
| Cr1 (mg/dl) | 49 | 19 | 81 | 250 |
| AKP1 (1U/L) | 94 | 43 | 479 | 238 |
| T1 (°C) | 36.3 | 35.3 | 37.9 | 231 |
| Total protein1 (g/L) | 67.8 | 40.9 | 87.5 | 251 |
| Albumin1 (g/L) | 41.2 | 24.4 | 51.7 | 250 |
| Na1 (mmol/L) | 142.5 | 132.9 | 151.1 | 237 |
| Cl1 (mmol/L) | 103 | 85.5 | 140.6 | 237 |
| U1 (ml) | 1820 | 420 | 5670 | 222 |
Number: Number of chemotherapy cycles; Gender: Sex; BMI: Body mass index; Volume1: The amount of fluid the day before administration; MTXNUM: Number of MTX chemotherapy cycles; BODYAREA: Body surface area; CrCl1: Creatinine clearance before administration; PH1: Urinary pH before dosing day; RBC1: Erythrocyte count before administration; HCT1: Hematocrit level before administration; Cr1: Serum creatinine level before administration; AKP1: Alkaline phosphatase before administration; T1: Temperature before administration; Total protein1: Total protein level before administration; Albumin1: Albumin level before administration; Na1: Serum sodium level; Cl1: Serum chloride; U1: Urine volume before administration; RBC: Red blood cell; NA: Not available.
In addition, we explored the correlation between these covariates. We found that the covariates with a strong correlation included MTXNUM and NUM [Figure 2]. Additionally, the three covariates–weight, body mass index (BMI) and body area—were strongly correlated with each other. In the process of modeling, special attention needed to be given to the covariates with strong correlation, and the factors with a significant effect should be selected rather than non-significant ones to prevent the development of an over-complicated model.
Figure 2.
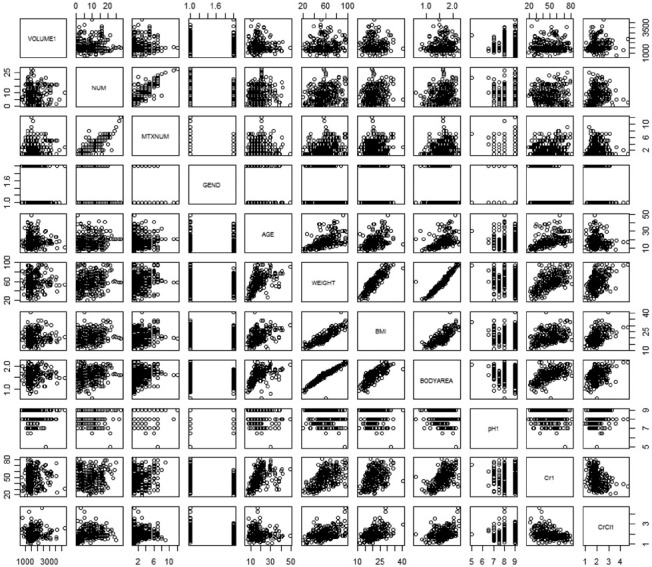
Correlation charts for some covariates, VOLUME1, the amount of fluid the day before administration; NUM, number of chemotherapy cycles; Number of MTX chemotherapy cycles, number of MTX chemotherapy cycles; GEND, sex; BMI: Body mass index; BODYAREA, body surface area; pH1, urinary pH before the dosing day; Cr1 serum creatinine level before administration; CrCl1, creatinine clearance before administration MTX: Methotrexate.
Final regression model equation and parameter values
The final model of the MTX PPK established using the NONMEM was as follows:
(CL1)i = CL1TV * [1- θCL1 −MTXNUM × MTXNUM]×[1-θCL1 −CrCI1 × (CrCl1 −1.89)]×eηCL1i (L/h)
(CL2)i = CL2TV ×[1- θCL2−BODYAREA × (BODYAREA − 1.62)]×eηCL2i (L/h)
(V1)i = V1TV × eηV1i (L)
(V2)i = V2TV ×[1−θV2−BODYAREA × (BODYAREA-1.62)]× eηV2i (L)
where CL1, V1, CL2 and V2 are the individual central compartment clearance rate, the central compartment distribution volume, the peripheral compartment clearance rate and the peripheral compartment distribution volume in the population, respectively. η is the inter-individual variation among the various parameters. MTXNUM was the time of chemotherapy using MTX before chemotherapy, body area is the body surface area, and Cr is the serum creatinine clearance rate. The PKs parameters of the basic model and final model are listed in Table 2.
Table 2.
Estimates of pharmacokinetic parameters regarding the base and final model
| PPK parameter | Basic model standard value | Final model standard value | ||||
|---|---|---|---|---|---|---|
| Standard value | RSE % | Inter-individual RSD % | Standard value | RSE % | Inter-individual RSD % | |
| CL1 | 5.81 | 2.07 | 8.93 | 6.20 | 4.87 | 8.48 |
| V1 | 19.2 | 2.34 | - | 19.6 | 4.39 | - |
| CL2 | 0.0154 | 5.61 | 55.0 | 0.0172 | 14.9 | 50.9 |
| V2 | 0.471 | 4.88 | 47.3 | 0.515 | 9.92 | 39.1 |
| θCL1−MTXNUM | 0.0183 | 35.6 | ||||
| θCL1−CrCl | 0.0416 | 32.2 | ||||
| θCL2−BODYAREA | 0.880 | 28.3 | ||||
| θV2−BODYAREA | 0.874 | 21.2 | ||||
CL1: Clearance of the central compartment; V1: The apparent distribution volume of the central compartment; CL2: Clearance of the peripheral compartment; V2: The apparent distribution volume of the peripheral compartment; θCL1−MTXNUM: The correction factor for MTXNUM regarding the parameter CL1; θCL1−CrCl: The correction factor of CrCl1 regarding the parameter CL1; θCL2−BODYARE: The correction factor for BODYAREA regarding the parameter CL2; θV2−BODYARE: The correction factor for BODYAREA regarding the parameter V2; PPK: Population pharmacokinetics; RSE: Relative standard error; RSD: Relative standard deviation.
Internal validation method
This model was validated using the Bootstrap method.[10] Sampling was normally repeated 200–1000 times, building 200–1000 random sets of validation data. It was reported in the literature that the error would be ˂5% if the sampling frequency was ˃50.[11] In our study, sampling was carried out 1000 times for validation of the final distribution [Figure 3].
Figure 3.
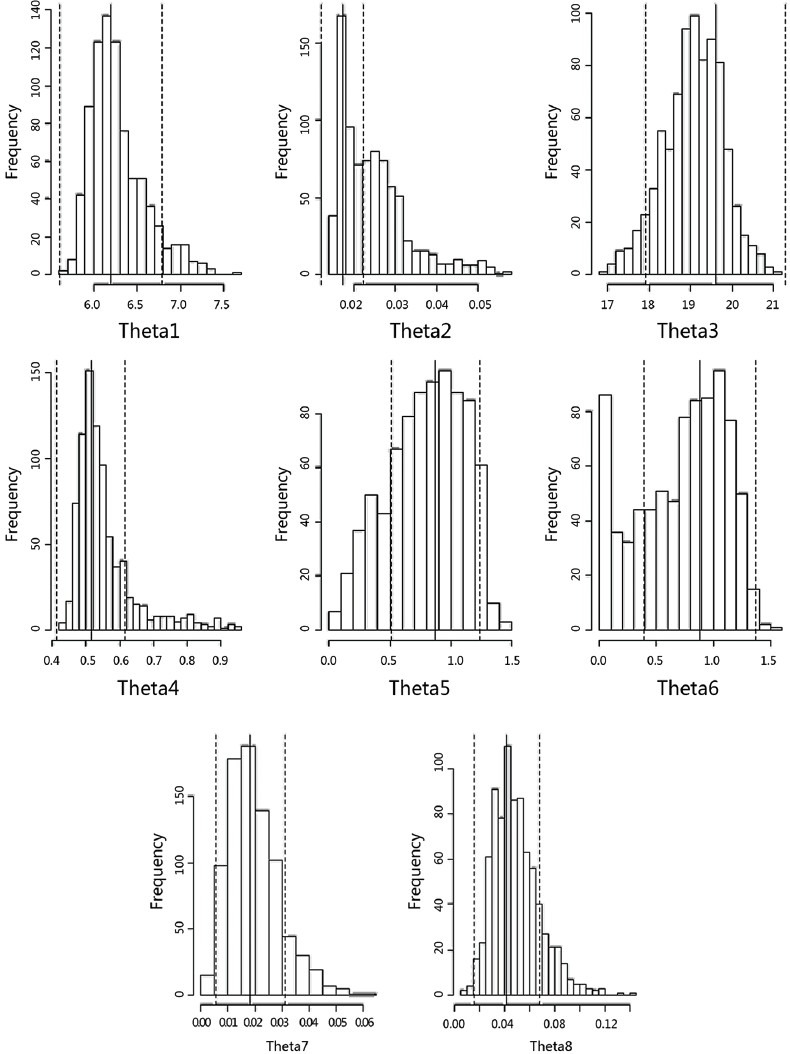
Output of model evaluation running 1000 times: Theta Parameters Bootstrap Analysis Run mtx 1204.
Evaluation of the diagnosis from the base model and the final model
The correlation between the observed value, the population predicted value and time
The goodness of fit between the predicted and observed values of serum drug concentration could be evaluated overall by plotting these two values against time. The half-logarithm coordinate diagram of the observed value, population predicted value, individual predicted value and time is shown in Figure 4. Figure 4a shows the basic model while Figure 4b shows the final model; the population predicted values from final model were closer to the observed values than was the case for the basic model, indicating that final model was an improvement on the basic model.
Figure 4.
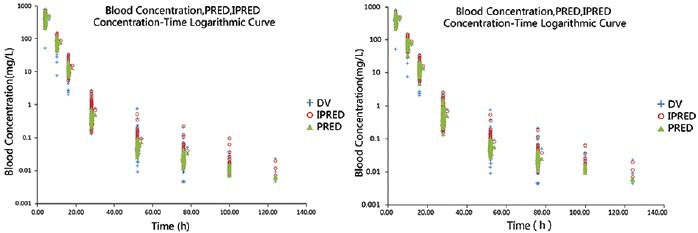
Observed concentration (DV; semilog), individual predicted concentration (IPRED; semilog) and population predicted concentration (PRED; semilog) versus TIME in the base model (a) and the final model (b). The blue crosses represent the DV, the red blank circles represent the IPRED and the yellow triangles represent the PRED.
The correlation between the population predicted value and the observed value
We could observe the quality of the curve fitting approximately by plotting the predicted values (individual, group) as abscissa and observed values as vertical coordinates. The fitting quality was better when the data points were uniformly distributed on both sides of the line with a zero intercept and a slope of 1. The closer to the line the data points were, the better the precision of their fitting. The relationship between the population predicted value, the individual predicted value and the observed value are shown in Figure 5. Figure 5a shows the basic model and Figure 5b shows the final model; 1 was the population predicted value and 2 was individual predicted value. It was found that the individual predicted value was better fitted than the population predicted value in both the basic model and the final model. In addition, the final model proved to be better than the basic model.
Figure 5.
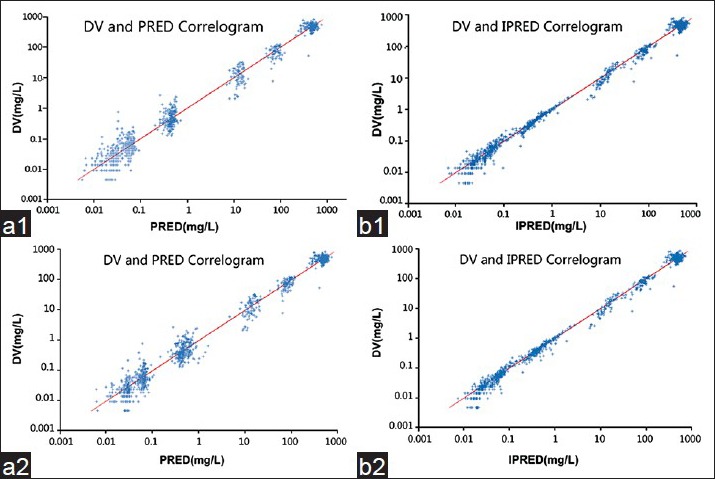
Observed concentration (DV) versus the population predicted concentration (PRED) in the base model (a1) and the final model (b1). Observed concentration (DV) versus the individual predicted concentration (IPRED) in the base model (a2) and the final model (b2).
The correlation between weighted residual and population predicted value
The variance in weighted residual (WRES) under different concentrations could be estimated by plotting the population predicted value as abscissa and the WRES as vertical coordinates. The WRES made it easier to compare the results from different models. With better fitting, data points should be randomly and uniformly distributed on both sides of the zero line (−4, 4). The correlation between the WRES and the population predicted value is shown in Figure 6, where Figure 6a shows the basic model and Figure 6b shows the final model. A portion of the WRESs was beyond the − 4–4 range, with a few ˃20. When compared with the distribution of WRES in the basic model, the WRES values in the final model were more uniformly distributed, which was an improvement to a certain extent.
Figure 6.

Weighted residual versus population predicted concentration in the base model (a) and the final model (b).
The correlation between residuals, weighted residual and time
Residuals (RES) and WRES were plotted against time to determine their change over time. In a better fitting model, all the data points should be uniformly distributed on both sides of line zero. The correlation between RES and time is shown in Figure 7, and between WRES and time in Figure 8, where A is the basic model and B is the final model in both figures.
Figure 7.

Residual versus time in the base model (a) and the final model (b).
Figure 8.
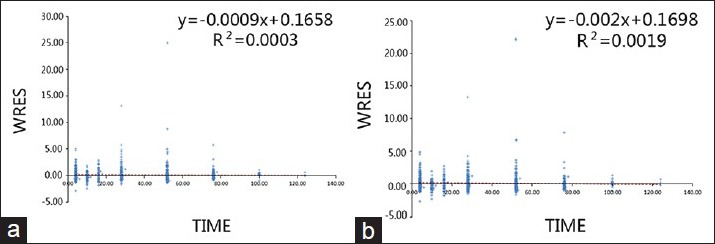
Weight residual versus time in the base model (a) and the final model (b).
DISCUSSION
The PPK model of high-dose MTX in osteosarcoma patients was established in the present study. In the final model, OFV was 373.294, a decrease of 114.562 when compared to the initial model, indicating a significant improvement. In addition, this model provided a very good fit for the predicted and observed concentrations with the exception of C0 [Figure 5]. The RSEs% of two variables were greater than 30%, but were still acceptable. In addition, the calculated results were verified by means of Bootstrap and thus were reliable with a small RSE%.
Population pharmacokinetics studies outside of China regarding MTX are currently focused on blood tumors; there have been two PPK studies on osteosarcoma. One involving adult patients, concluded that the three-compartment model provided a good fit.[12] The parameter estimates for the final model were CL1 = 6.57 L/h and V1 = 42 L. In our study, CL1 = 6.20 L/h and V1 = 19.6 L. The difference in V1 between the two studies may be related to the age of the patients. The average age in the previous study[12] was 26.7 years, while the average age in our study was 17 years. In another PPK study of MTX in osteosarcoma patients at average age of 15 years,[13] the obtained parameter values were CL1 = 4.79 L/h, V1 = 16.7 L, CL2 = 0.019 L/h and V2 = 0.464 L, close to those obtained in the present study. In previously reported studies, the Bayesian approach has been proposed to analyze the PK of HD-MTX for individual dose adjustment. The PK parameters were estimated by several methods, including the Iterative Bayesian algorithm (IT2B37) and Non-parametric Em algorithm (NPEM38), assuming a 2-compartment PK model. In comparison with the result from a traditional PK study using Bayesian Estimation,[14] we achieved a very similar result in the estimation of CL (7.11 ± 3.20 L/h) and V1 (18.24 ± 9.87 L), partially because both populations are fairly young. But besides that, we can see they have a huge RSE%, around 50%, and in our study it's usually within 10%. One reason is that we have more data, and thus more confidence, but more importantly, using the PPK method we can control for differences in other variables like CrCl1 and MTXNUM, further reducing potential variance. In the study, the value of 19.6 L is consistent with results reported by Rousseau et al.[14] and Aquerreta et al.[15] in children. In addition, intercompartmental clearance (0.0172 L/h) and peripheral distribution volume (0.515 L) values were in the same range as those previously published by Aquerreta et al.[15] (CLD1 0.053 L/h, V2 1.82 L).
Dosing regimens differed depending on the disease; therefore, the differing degrees of hydration and administration times significantly affected the PK parameters. Each added covariate had physiological significance and was examined by forward selection and backward elimination tests. Many studies have reported that the MTX clearance is influenced by the clearance rate of serum creatinine or creatinine.[12] The duration of chemotherapy was also an effect concerning the clinic. Osteosarcoma chemotherapy involves 4–6 h infusion of high-dose (8–12 g/m2) sequential therapy. The preoperative treatment consists of four cycles, and the postoperative treatment consists of 12–16 cycles. Thus, the number of chemotherapy cycles using this method is many times greater than using general MTX chemotherapy. Therefore, the ability of the surrounding room clearance was affected. It has been found in several previous cases that the concentration of MTX remained high during chemotherapy after many cycles of chemotherapy. This could be due to the fact that repeated chemotherapy can impair renal function leading to MTX damage to liver cells as a result of the decreased rate of clearance. Body surface area was also a very important reference index for MTX treatment. The recommended measurement of the MTX dose was generally in g/m2. Therefore, when using the body surface area calculation it is necessary to pay attention to special patient populations such as amputees, or patients who experience severe weight loss after multiple chemotherapy cycles.
Other covariates reported in literature include hydration[16] and the pH of urine.[17] However, these two covariates had no significant effect in our model; the reason for urine pH having no significant effect was possibly the result of poor recording, because patients self-measured the pH using pH test paper, with a precision of only one digit and the frequent appearance of recordings of 7–8 or 6–9. Regarding hydration, different doses of drug were administered in the present study as compared with other previous studies. Moreover, it has been reported[7] that differences in serum drug concentration were not detectable at high infusion volume, which might have also happened in our study.
There were some patients who received HD-MTX multiple times, and we treated them as totally separate individuals in the modeling process to gather more data, but that also meant that we ignored the internal correlation within patients. This may partially explain the existing difference.
Through the analysis of the data from 274 cases with high-dose MTX chemotherapy, we considered that the PK characteristics followed the two-compartment model; the elimination of MTX was influenced by the timing of MTX chemotherapy, the clearance rate of creatinine and body surface area. The clearance rate of MTX decreased with increased times of MTX chemotherapy or a decreased creatinine clearance rate, while body surface area had a positive correlation with the peripheral clearance rate and the apparent volume of distribution of the peripheral compartment. The results indicate that it is important to strengthen the pharmaceutical care of patients receiving multiple MTX chemotherapy treatments, paying attention to the dosage calculations in amputee patients and obtaining renal creatinine clearance data prior to chemotherapy. The objective of this study was to improve the clinical effectiveness of chemotherapy and reduce the serious risks associated with this treatment. The findings provide an important theoretical basis for the proposed clinical MTX chemotherapy and the critical monitoring points for reducing the risks. An in-depth PPK study of individual doses should be undertaken in the future in a large osteosarcoma patient population involving HD-MTX to develop software for individualized dose calculation.
Footnotes
Edited by: Xiuyuan Hao
Source of Support: Nil.
Conflict of Interest: None declared.
REFERENCES
- 1.Rosen G, Marcove RC, Caparros B, Nirenberg A, Kosloff C, Huvos AG. Primary osteogenic sarcoma: The rationale for preoperative chemotherapy and delayed surgery. Cancer. 1979;43:2163–77. doi: 10.1002/1097-0142(197906)43:6<2163::aid-cncr2820430602>3.0.co;2-s. [DOI] [PubMed] [Google Scholar]
- 2.Winkler K, Beron G, Kotz R, Salzer-Kuntschik M, Beck J, Beck W, et al. Neoadjuvant chemotherapy for osteogenic sarcoma: Results of a Cooperative German/Austrian study. J Clin Oncol. 1984;2:617–24. doi: 10.1200/JCO.1984.2.6.617. [DOI] [PubMed] [Google Scholar]
- 3.Crews KR, Liu T, Rodriguez-Galindo C, Tan M, Meyer WH, Panetta JC, et al. High-dose methotrexate pharmacokinetics and outcome of children and young adults with osteosarcoma. Cancer. 2004;100:1724–33. doi: 10.1002/cncr.20152. [DOI] [PubMed] [Google Scholar]
- 4.Bacci G, Ferrari S, Delepine N, Bertoni F, Picci P, Mercuri M, et al. Predictive factors of histologic response to primary chemotherapy in osteosarcoma of the extremity: Study of 272 patients preoperatively treated with high-dose methotrexate, doxorubicin, and cisplatin. J Clin Oncol. 1998;16:658–63. doi: 10.1200/JCO.1998.16.2.658. [DOI] [PubMed] [Google Scholar]
- 5.Graf N, Winkler K, Betlemovic M, Fuchs N, Bode U. Methotrexate pharmacokinetics and prognosis in osteosarcoma. J Clin Oncol. 1994;12:1443–51. doi: 10.1200/JCO.1994.12.7.1443. [DOI] [PubMed] [Google Scholar]
- 6.Comandone A, Passera R, Boglione A, Tagini V, Ferrari S, Cattel L. High dose methotrexate in adult patients with osteosarcoma: Clinical and pharmacokinetic results. Acta Oncol. 2005;44:406–11. doi: 10.1080/02841860510029770. [DOI] [PubMed] [Google Scholar]
- 7.Ette EI, Williams PJ, Lane JR. Population pharmacokinetics III: Design, analysis, and application of population pharmacokinetic Studies. Ann Pharmacother. 2004;38:2136–44. doi: 10.1345/aph.1E260. [DOI] [PubMed] [Google Scholar]
- 8.Karlsson MO, Sheiner LB. The importance of modeling interoccasion variability in population pharmacokinetic analyses. J Pharmacokinet Biopharm. 1993;21:735–50. doi: 10.1007/BF01113502. [DOI] [PubMed] [Google Scholar]
- 9.Chen GX, Rong D. Estimating methods and applications of statistical effectiveness and effect. J Enterp Sci Technol Dev. 2010;22:132–3. [Google Scholar]
- 10.Ding JJ, Jiao Z, Li ZD, Shi XQ, Zhong MK. Validation to multi-regression model of limited sampling strategy by Bootstrap method. J Chin J Health Stat. 2004;5:289–92. [Google Scholar]
- 11.Ette EI. Stability and performance of a population pharmacokinetic model. J Clin Pharmacol. 1997;37:486–95. doi: 10.1002/j.1552-4604.1997.tb04326.x. [DOI] [PubMed] [Google Scholar]
- 12.Dupuis C, Mercier C, Yang C, Monjanel-Mouterde S, Ciccolini J, Fanciullino R, et al. High-dose methotrexate in adults with osteosarcoma: A population pharmacokinetics study and validation of a new limited sampling strategy. Anticancer Drugs. 2008;19:267–73. doi: 10.1097/cad.0b013e3282f21376. [DOI] [PubMed] [Google Scholar]
- 13.Colom H, Farré R, Soy D, Peraire C, Cendros JM, Pardo N, et al. Population pharmacokinetics of high-dose methotrexate after intravenous administration in pediatric patients with osteosarcoma. Ther Drug Monit. 2009;31:76–85. doi: 10.1097/FTD.0b013e3181945624. [DOI] [PubMed] [Google Scholar]
- 14.Rousseau A, Sabot C, Delepine N, Delepine G, Debord J, Lachâtre G, et al. Bayesian estimation of methotrexate pharmacokinetic parameters and area under the curve in children and young adults with localised osteosarcoma. Clin Pharmacokinet. 2002;41:1095–104. doi: 10.2165/00003088-200241130-00006. [DOI] [PubMed] [Google Scholar]
- 15.Aquerreta I, Aldaz A, Martínez V, Sierrasesúmaga L, Giráldez J. Predicción del retraso en la eliminación de metotrexato mediante métodos bayesianos. Farm Hosp. 2002;26:90–5. [Google Scholar]
- 16.Li HY, Zheng Y, Yu JN, Zheng CJ. Relationship between difference volume hydration and serum concentration in chemotherapy of high-dose methotrexate. J Appl Clin Pediatr. 2010;25:216–8. [Google Scholar]
- 17.Sand TE, Jacobsen S. Effect of urine pH and flow on renal clearance of methotrexate. Eur J Clin Pharmacol. 1981;19:453–6. doi: 10.1007/BF00548590. [DOI] [PubMed] [Google Scholar]


