

Abstract
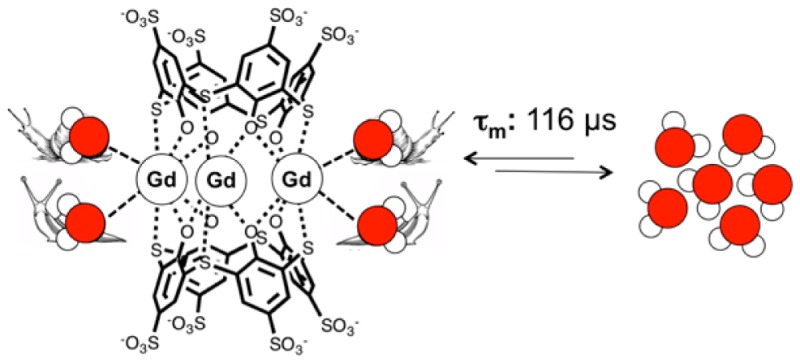
In aqueous solution, Gd3+ and thiacalix[4]arene-p-tetrasulfonate (TCAS) form the complex [Gd3TCAS2]7–, in which a trinuclear Gd3+ core is sandwiched by two TCAS ligands. Acid-catalyzed dissociation reactions, as well as transmetalation and ligand exchange with physiological concentrations of Zn2+ and phosphate, showed [Gd3TCAS2]7– to be extremely inert compared to other Gd complexes. Luminescence lifetime measurements of the Tb analogue Tb3TCAS2 allowed estimation of the mean hydration number q to be 2.4 per Tb ion. The longitudinal relaxivity of [Gd3TCAS2]7– (per Gd3+) was r1 = 5.83 mM–1 s–1 at 20 Hz (37 °C, pH 7.4); however, this relaxivity was limited by an extremely slow water exchange rate that was 5 orders of magnitude slower than the Gd3+ aqua ion. Binding to serum albumin resulted in no relaxivity increase owing to the extremely slow water exchange kinetics. The slow dissociation and water exchange kinetics of [Gd3TCAS2]7– can be attributed to the very rigid coordination geometry.
Short abstract
Gd3+ and thiacalix[4]arene-p-tetrasulfonate (TCAS) form the complex Gd3TCAS2, in which a trinuclear Gd3+ core is sandwiched by two TCAS ligands. Gd3TCAS2 is extremely inert compared to other Gd complexes, and the mean hydration number q is estimated to be 2.4 per Gd ion. The relaxivity of Gd3TCAS2 is limited by an extremely slow water exchange rate.The slow dissociation and water exchange kinetics of Gd3TCAS2 can be attributed to a very rigid coordination geometry.
Introduction
The aqueous coordination chemistry of the trivalent lanthanides is characterized by high coordination numbers and, classically, kinetically labile complexes. For instance the aqua ion Gd3+(aq) has the fastest water exchange rate of any trivalent metal ion (1 × 10⁹ s–1 at 25 °C) and is at the extreme for water exchange among all metal ions in solution.1 The application of Gd(III) complexes as contrast agents in magnetic resonance imaging (MRI) led to a rich development in aqueous lanthanide coordination chemistry.2 Clinically approved contrast agents use octadentate polyaminocarboxylate ligands based on 1,4,7,10-tetraazacyclododecane-1,4,7,10-tetraacetic acid (DOTA) or diethylenetriamine pentaacetic acid (DTPA) to provide Gd(III) complexes safe for human use.3,4 These complexes also have one water coligand. The presence of the multidentate chelating ligand also affects the water exchange rate, and among these types of complexes, water exchange kinetics can be tuned over 5 orders of magnitude by judicious choice of the donor atoms on the multidentate ligand.5,6
For T1 relaxation agents like Gd3+ complexes, the optimal water exchange rate is in the 1 × 10⁷ to 1 × 10⁸ s–1 range.7 When the water exchange rate becomes too slow, the relaxivity of the complex is limited because the relaxed water molecule cannot exchange fast enough to diminish the relaxation time of bulk water. However, very slow water exchange can be exploited by using a non-Gd paramagnetic lanthanide ion that induces a large pseudocontact chemical shift. If the water exchange rate (1/τ) is slow enough to meet the slow exchange condition (ωτ > 1), then the coordinated water ligand can be observed as a highly shifted 1H NMR resonance. Saturation of this resonance results in transfer of saturation to the bulk water resonance resulting in MRI signal loss. This is the basis of paramagnetic chemical exchange saturation transfer (PARACEST) effect.8,9 For PARACEST applications the exchange rate should be from 1 × 10³ to 1 × 10⁴ s–1. For water exchange rates in the 1 × 10⁵ to 1 × 10⁶ s–1 range, there is another contrast generating effect called T2-exchange.10 This is essentially exchange broadening but by a highly shifted water ligand resonance. By judicious choice of lanthanide and coligand, different MRI contrast enhancing properties (T1, T2-exchange, saturation transfer) can be exploited. Thus, water exchange is a critical parameter to understand and control in lanthanide chemistry.
Almost all the ligand design in MR contrast agents has focused on DOTA and DTPA analogues because of their ability to form stable, inert complexes with Ln3+. Chelators of lower denticity fail to provide sufficient inertness for in vivo applications. Previously, we found that thiacalix[4]arene-p-tetrasulfonate (TCAS, Figure 1) is capable of binding Ln3+ ions in different binding modes depending on the reaction conditions and the species of countercation.11,12 For Ln = Nd and Yb, we showed that it self-assembled to form a sandwich-type complex, [Ln3TCAS2]7–, formed in which two cone-shaped TCAS ligands sandwich a trinuclear Ln3+ core.13 The ligand binds to the metal ions at the periphery, which we refer to as an exo-binding mode. The Yb(III) complex exhibited remarkable kinetic inertness for dissociation in strong acid (half-life t1/2 = 1.53 h at pH 1.16, 25 °C), which was unexpected from the exo-binding mode. The mean hydration number per Yb(III) ion was q = 2.5 in [Yb3TCAS2]7–.13 Given high kinetic inertness, the large hydration number, and the presence of three Ln3+ ions in a compact structure, we hypothesized that the corresponding Gd3+ analogue, [Gd3TCAS2]7–, could be a promising candidate for development of high relaxivity Gd-based contrast agents. Instead we observed a remarkable inertness of water exchange that ultimately muted relaxivity.
Figure 1.

Structures of TCAS and the 1:1 and 3:2 lanthanide(III) complexes.
Results and Discussion
Preparation of Gd3TCAS2
Previously, we formed [Ln3TCAS2]7– (Ln3+ = Nd3+, Yb3+) in 24 h by self-assembly of the components at pH 7.4.13 We sought optimum conditions to scale up the reaction while avoiding the formation of unwanted impurities such as Gd2TCAS2 and Gd4TCAS2. We were able to obtain 1.31 g of a solid powder containing Na7[Gd3TCAS2] (2.0 × 10⁻⁴ mol) and CAPS (2.5 mmol), the latter of which was used to buffer the pH to 11.2 for the initial complex formation. To confirm that other species GdnTCAS2 (n = 2, 4) were not formed, we analyzed the reaction mixture and the resultant powder by capillary electrophoresis (CE). CE is able to separate LnnTCAS2 species (n = 2–4) with high resolution based on the charge-to-size ratio. The only obtained and detected species was [Gd3TCAS2]7– (Figure S1; see also Figure S2 for Nd, Tb, and Yb analogues).
Kinetic Inertness
A prerequisite for in vivo use is high kinetic inertness under physiological conditions. We determined the solvolytic dissociation rate constant (kd) of [Gd3TCAS2]7– under acid-catalyzed conditions ([H+] = 0.03–0.23 M) at 25 °C. The dissociation of the [Gd3TCAS2]7– sandwich cluster was followed in the presence of excess acid to guarantee the pseudo-first-order condition. The reaction was monitored by HPLC to selectively detect the signal from the remaining [Gd3TCAS2]7– in the reaction mixture (Figure 2A). The time dependence of the peak height clearly showed a single exponential decay to give the observed dissociation rate constants (kobs; Figure 2B). This reaction was studied at different acid concentrations while keeping the ionic strength constant (I = 0.5 M) to afford first-order dependence of kobs on [H+] (Figure 2C, eq 1).
| 1 |
Figure 2.

(A) Typical chromatograms of a reaction mixture of [Gd3TCAS2]7– under acid-catalyzed dissociation conditions, (B) time dependence of peak height (H) of [Gd3TCAS2]7–, and (C) dependence of the observed dissociation rate constant, kobs, on proton concentration, [H+] at 25 °C (I = 0.5 M). Sample: [Gd] = 6.0 × 10⁻⁵ M, [TCAS] = 4.0 × 10⁻⁵ M, [HCl] = 0.15 M, pH 0.89, I = 0.50 M, 25 °C. (A) Eluent: [HEPES] = 0.01 mol/kg (pH 7.4), [TBABr] = 30 mmol/kg in 50 wt % CH3CN. Flow rate: 2 mL/min, injection volume: 5 μL, detection wavelength: 320 nm. (B) The decay of H was fitted with an equation: H = A exp(−1.27 × 10⁻³t) with R2 = 0.997.
This suggests that there are two paths of dissociation: solvolytic dissociation and proton-assisted. In the latter, a protonated species, [Gd3H1TCAS2]6–, dissociates with a second-order rate constant kH. The protonation likely occurs on one of the phenolic oxygens of TCAS, which in turn should decrease the donating ability to Gd3+ and increase dissociation of the Gd3+ ion. By fitting with eq 1, both of the rate constants were estimated: kd = (2.73 ± 2.67) × 10–5 s–1 and kH = (8.10 ± 0.19) × 10–3 M–1 s–1. The large uncertainty associated with kd stems from the fact the dominant path of dissociation is the proton-assisted path via [Gd3H1TCAS2]6– under the conditions studied. [Gd3TCAS2]7– exhibits a remarkable kinetic inertness with a t1/2 = 2.4 h at pH 2. The dissociation kinetics of [Gd3TCAS2]7– can be compared to approved contrast agents where its inertness appears intermediate between acyclic contrast agents and macrocyclic agents. The proton-assisted dissociation rate constant kH is 3 times larger than for [Gd(HP-DO3A)] (2.9 × 10⁻⁴ M–1 s–1),14 but 2 orders of magnitude smaller than for [Gd(DTPA)]2– (0.58 M–1 s–1).15
We also assessed kinetic inertness under more physiological conditions. In the body, endogenous ions such as Zn2+ and phosphate can catalyze transchelation of the Gd3+ complex (GdL), leading to dissociation via transmetalation (to ZnL) and ligand substitution (to GdPO4). We used a standard assay16 to monitor changes in the longitudinal nuclear relaxation rate R1 (= 1/T1) of solvent water for [Gd3TCAS2]7– in the presence of 1.0 M phosphate and 0.1 mM Zn2+. GdPO4 precipitates out of the solution upon formation resulting in a decrease in R1. In the absence of Zn2+, the R1 value showed a 5% decrease in the first 3 h, a plateau until 44 h, then a 23% decrease at 100 h (Figure 3A◦). The initial rapid decrease in R1 may be attributed to an initial ternary phosphate complex while the slower decrease in R1 is caused by the dissociation of [Gd3TCAS2]7– to form GdPO4. Notably, even after 100 h 77% of [Gd3TCAS2]7– remained intact (for estimation, see Supporting Information). This clearly indicates that [Gd3TCAS2]7– is substantially inert at neutral pH. In the presence of Zn2+, the behavior of R1 over time (Figure 3A■) was comparable to R1 measured in the absence of Zn2+, suggesting that any dissociation proceeds not by transmetalation, but rather by ligand substitution with phosphate. This is evident when R1 with Zn2+ is standardized by R1 without Zn2+. [Gd3TCAS2]7– did not show a significant change until 45 h and only a slight decrease after 100 h, suggesting [Gd3TCAS2]7– is not sensitive to transmetalation by Zn2+ (Figure 4).
Figure 3.

Time dependence of the longitudinal relaxation rate R1 of solutions containing (A) [Gd3TCAS2]7– and (B) MS-325 in the presence or absence of ZnII ion. Reaction conditions: [Gd]total = 0.1 mM, [Zn(OTf)2] = 0 (◦) or 0.1 mM (■), [phosphate] = 1.0 M, pH 7.0, 25 °C. Relaxivity measurement: 37 °C, 60 MHz.
Figure 4.
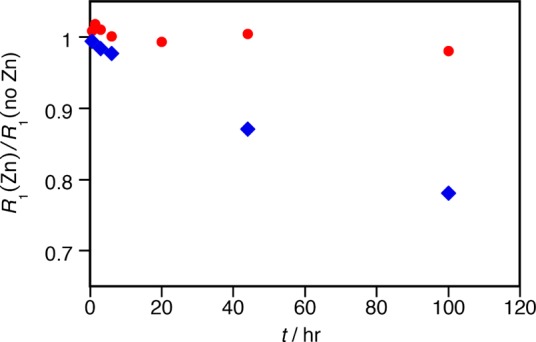
Time dependence of the longitudinal relaxation rate R1(Zn) of solutions containing (●) [Gd3TCAS2]7– and (◆) MS-325 in the presence of ZnII ion standardized to the relaxation rate measured in the absence of ZnII, R1(no Zn). Reaction conditions: [Gd3+]total = 0.1 mM, [Zn(OTf)2] = 0 or 0.1 mM, [phosphate] = 1.0 M, pH 7, 25 °C. Relaxivity measurement: 37 °C, 60 MHz.
For comparison, we also measured the time course of R1 for the Food and Drug Administration approved contrast agent MS-325 (gadofosveset, Ablavar) in the same fashion.17,18 Of the approved linear contrast agents (Gd-DTPA, etc), MS-325 was the most inert in this assay.19 In the absence of Zn2+, little change of R1 value was observed even at t = 100 h (Figure 3B◦), suggesting that MS-325 is very inert to ligand substitution by phosphate. However, in the presence of Zn2+, the R1 value gradually decreased (Figure 3B■) indicating a more facile transmetalation than observed for [Gd3TCAS2]7– (Figure 3A■). This is further seen in Figure 4 when R1 with Zn2+ is standardized by R1 without Zn2+ and indicates that MS-325 dissociation proceeds by exchange of Gd3+ with Zn2+. [Gd3TCAS2]7– is very inert under both highly forcing, acidic conditions as well as under excess Zn2+ and phosphate challenge, suggesting sufficient kinetic inertness for in vivo applications.
Determination of Hydration Number of [Tb3TCAS2]7–
As a surrogate for [Gd3TCAS2]7–, we used the luminescent [Tb3TCAS2]7– complex, which we anticipate is isostructural based on the similar ionic radii of Gd3+ and Tb3+. Here the Tb3+-centered luminescence lifetime was measured in H2O and D2O (τH and τD, respectively), and q was estimated using Horrocks’ equation.20,21 We estimate an average q value of 2.4 per ion (Table S2 Supporting Information). This could indicate two Tb(III) ions with two water ligands and the third ion with three water ligands, and it strongly suggests that each Gd in [Gd3TCAS2]7– is q ≥ 2.
Water Exchange Kinetics
We evaluated the mean water exchange kinetics at each Gd3+ center of [Gd3TCAS2]7– by measuring the 17O NMR transverse relaxation rate (R2) of solvent water as a function of temperature in the presence (R2) and absence (R2d) of [Gd3TCAS2]7–. Normalizing the difference in these rates to the mole fraction of water that is coordinated to the Gd ion (we assumed q = 2) gives the so-called reduced relaxation rate R2r. Figure 5 shows the temperature dependence of ln(R2r) versus reciprocal temperature for [Gd3TCAS2]7–. For most Gd3+ complexes, R2r increases with increasing temperature, reaches a maximum and then decreases. However, for [Gd3TCAS2]7– we see R2r first decrease, reach a minimum at ∼25 °C, and then increase as temperature is increased. This behavior is indicative of extremely slow water exchange.
Figure 5.

Temperature dependence of reduced 17O transverse relaxation rate for [Gd3TCAS2]7– at 11.7 T. Samples: [Gd3TCAS2]7– = 7.03 mM, [HEPES] = 50 mM, pH = 7.4. Temp: 3–94 °C.
For Gd3+ where the paramagnetic induced chemical shift is small compared to the T2 of the coordinated water ligand (T2m), R2r depends on T2m and the water residency time (τm, reciprocal of water exchange rate, kex) as described by eq 2:22
| 2 |
The term R2OS refers to paramagnetic relaxation of water outside the first coordination sphere, and for most Gd(III) complexes this term makes a negligible contribution to R2r. In the slow exchange regime (τm ≫ T2m), the reduced relaxation rate simplifies to eq 3.
| 3 |
This is the behavior that we observe for [Gd3TCAS2]7–. As the temperature is lowered, the τm increases with respect to R2OS and eventually results in R2r = R2OS. Generally, for Gd3+ the R2OS term is much smaller than the contribution from inner-sphere water and can be ignored,23 but for [Gd3TCAS2]7–, τm is so long at low temperatures that this outer-sphere phenomenon becomes observable. A similar outer-sphere effect on R2r has been reported for the solvent exchange of the complex [Ti(DMF)6]3+.24
We calculated the τm of the coordinated waters to be 116 μs at 25 °C (or 20.8 μs at 37 °C, see Supporting Information). As a comparison, τm of the aqua ion [Gd(H2O)9]3+ is 5 orders of magnitude shorter (0.9 ns at 25 °C).25 Only the Gd3+ complex of the tetra(methylphosphonate)amide derivative of DOTA, [Gd(DOTA-4AMP)(H2O)]5–, has a longer reported τm.26 The extremely slow water exchange rate suggests that the proton relaxivity will be very low.
An alternative model is that there are two classes of coordinated water ligands. There is obviously a very slow exchangeable water, but the magnitude of the R2OS term is compatible with an extremely fast exchangeable water; for example, R2OS observed here is comparable to R2r for [Gd(H2O)8]3+ at the same temperature.27 Using this physical model, we assumed that for the [Gd3TCAS2]7– cluster that there were two slow exchangeable water molecules per Gd and one fast exchangeable water per cluster (since the Tb luminescence gave q = 7 per cluster). This model will also fit the data in Figure 5 equally well since essentially we are replacing the R2OS term in eq 3 with a 1/T2mfast term (the T2 of the coordinated rapidly exchanging water). In that model, the residency time of the fast exchanging water is 0.6 ns at 37 °C. We have no way of knowing the relative population of very fast and very slow exchangeable water molecules, but if we arbitrarily take a different model with five slow exchanging waters and two fast exchanging waters, then the residence time of the slow exchanging waters decreases from 17 to 14 μs at 37 °C, and the fast exchanging water residency times change from 0.6 to 0.3 ns. Regardless, there would exist two classes of exchangeable water molecules separated by over 4 orders of magnitude.
Proton Relaxivity
Relaxivity, r1, per Gd was determined in 4-(2-hydroxyethyl)piperazine-1-ethanesulfonic acid (HEPES) buffer and in excess human serum albumin (HSA) at 0.47 and 1.41 T, Table 1. We independently measured the affinity of [Tb3TCAS2]7– for HSA (Kb = (1.71 ± 0.31) × 106 M–1, 20 mM HEPES, pH 7.4, 25 °C, see Supporting Information, section 5), and a hydration number of q = 1.7 for the HSA-bound complex. Because of its high affinity for HSA, [Gd3TCAS2]7– is effectively completely bound to albumin for these measurements. The measured relaxivity values in Table 1 are in line with the very slow water exchange kinetics. Equation 4 relates the contribution to relaxivity due to the inner-sphere water ligands.
| 4 |
From the Solomon–Bloembergen–Morgan equation, one can estimate T1m for [Gd3TCAS2]7– in the absence and presence of HSA, assuming rotational correlation times of 250 ps and 10 ns,6,28 respectively (Table 1). Relaxivity in both cases is almost exclusively determined by τm even at 37 °C. The contribution to relaxivity from the 2.5 water ligands is only 1.9 mM–1 s–1 at 37 °C and less as temperature is decreased. In HSA solution the inner-sphere water ligands only contribute 2.1 mM–1 s–1 to the observed relaxivity. This slight decrease in relaxivity compared to the unbound state is at odds with other HSA-bound complexes29 but consistent with the extremely slow water exchange rate and the reduced hydration number from 2.5 to 1.7 upon HSA binding. Interestingly, if the water exchange rate was 1000-fold faster (typical of many Gd complexes), then the relaxivity would be in excess of 150 mM–1 s–1 at 0.47 T and >50 mM–1 s–1 at 1.4 T. The extremely slow water exchange rate has effectively quenched the relaxivity. We also made measurements at lower temperatures, and the relaxivity increased slightly to 7.9 mM–1 s–1 at 13 °C (see Supporting Information); cooling will further decrease r1IS but will increase the second/outer-sphere relaxivity.
Table 1. Per Gd Relaxivity and Estimated T1m Valuesa (at 1.4 T) for [Gd3TCAS2]7–
| r1 (0.47 T) [mM–1 s–1] | r1 (1.41 T) [mM–1 s–1] | T1m [μs] | |
|---|---|---|---|
| [Gd3TCAS2]7– | 5.8 | 7.0 | 2.3 |
| [Gd3TCAS2]7– in HSA | 5.5 | 6.1 | 0.8 |
In presence and absence of HSA at 37 °C measured at [Gd] < 0.15 mM. τm from 17O NMR is 21 μs at 37 °C, and thus τm ≫ T1m.
We also studied the effect of concentration on relaxivity. For a single species in solution, a plot of the longitudinal relaxation rate, R1 (= 1/T1) as a function of [Gd] (= 3[Gd3TCAS2]7–) should give a straight line with the slope giving the relaxivity. However, for [Gd3TCAS2]7– we observed nonlinear behavior with the slope decreasing at concentrations above [Gd] = 0.4 mM. This concentration-dependent behavior suggested the aggregation of [Gd3TCAS2]7– at higher concentrations. We were able to confirm the presence of aggregation by dynamic light scattering (DLS) measurements of different concentrations of [Gd3TCAS2]7– ([Gd] = 0.1–2.0 mM). DLS showed an increase in mean diameter from 0.7 to 10 nm at [Gd] = 0.4 mM (Figure 5), implying the formation of an aggregate above this concentration. Hence, the data in the low concentration range (0–0.15 mM), showing good linearity (Figure S7B), was used for determination of r1 reported in Table 1. The reduction in relaxivity at higher concentrations suggests a reduction of water access (reduced q) in the aggregate as was seen in the HSA-bound species. The Tb luminescence measurements were performed at low micromolar concentration, and the hydration state reflects the monomeric [Gd3TCAS2]7– species.
Figure 6.

Dependence of number mean diameter on the concentration of Gd. Sample: [Gd] (= 3[Gd3TCAS2]7–) = 0.1–2 mM, [HEPES] = 50 mM, pH = 7.4 at 25 °C.
Only very few Gd complexes can be found in literature that show similarity to [Gd3TCAS2]7–. Among the few is the structurally similar [Gd3(H3taci)2(H2O)6]3+ complex, which was reported to have a much shorter mean water residency time, with 91 ns at 25 °C.30 This complex however was reported to be quite kinetically labile. The opposite is true for [Gd3TCAS2]7–; the rigidity of the [Gd3TCAS2]7– system may make the nine-coordinated Gd3+ transition state energetically unfavorable. This results in slow water exchange, but it also rationalizes the kinetic inertness of [Gd3TCAS2]7– to solvolysis. Thus, the rigid structure of [Gd3TCAS2]7– has brought both preferable and negative consequences to its ability to act as a contrast agent: very high kinetic inertness yet extremely slow water exchange rate, limiting relaxivity.
In conclusion, we found that the unusual sandwich-cluster complex [Gd3TCAS2]7– has high kinetic inertness, high hydration number (q ≥ 2 per Gd) as well as a high affinity to HSA: all prerequisites for MRI contrast agents. The relaxivity of the complex however was found to be much lower than expected both in the presence and absence of HSA, and this was due to an exceedingly slow water exchange rate. Indeed the extreme inertness of [Gd3TCAS2]7– with respect to dissociation and water exchange is akin to that seen with the Ln(III) complexes of DOTA-tetraamides. The slow water exchange kinetics of LnDOTA-tetraamide complexes (where Ln ≠ Gd) have been exploited for PARACEST applications.88,31 Future investigations of the Ln3TCAS2 system will aim to exploit this slow water exchange rate for PARACEST applications.
Experimental Section
Equipment
A capillary electrophoresis measuring system CAPI-3300 of Otsuka Electronics Co, Ltd. (Osaka) with a fused silica capillary (50 μm id) purchased from GL Sciences Inc. (Tokyo) was used to assess the purity of the prepared [Gd3TCAS2]7–. The luminescent spectra in the visible region and the luminescence lifetimes were measured using a Hitachi F-4500 fluorescent spectrometer. An HPLC consisting of a Shimadzu LC-10AD pump and a JASCO UV 2075 Plus spectrophotometric detector equipped with a Mightysil ODS RP-18 GP II column (150 × 4.6 mm, 5 μm, Kanto Chemical Co, Inc.) was used. The chromatograms were recorded with a JASCO 807-IT integrator. Longitudinal relaxation times, T1, were measured by using the inversion recovery method on Bruker Minispecs mq20 (20 MHz) and mq60 (60 MHz). Relaxivity was determined from the slope of a plot of 1/T1 versus concentration for GdIII. The GdIII concentrations of the measured samples were determined by inductively coupled plasma mass spectrometry on an Agilent 7500a system. Dynamic light scattering equipment Zetasizer Nano ZetasizerSP (Malvern Instruments Ltd, U.K) was used to estimate the size of aggregate of [Gd3TCAS2]7– observed at high concentration. 17O NMR measurements of solutions were performed at 11.7 T on 150 μL samples contained in 2 mm Shigemi tubes inside a 5 mm standard NMR tube on a Varian spectrometer. The pH was recorded using a TOA HM-25R pH meter with a combined glass electrode.
The TCAS was synthesized as previously reported[i] and stocked as an aqueous solution of 0.01 M. The stock solution of 0.01 M LnIII was prepared by dissolving nitrate hexahydrate (99.5% purity each) purchased from Wako Pure Chemical Industries, Ltd. (Osaka) into 0.01 M HNO3 solution. A stock solution of 0.01 M AgI was prepared by dissolving AgNO3 (99.8%, Kanto Chemical Company, Inc, Tokyo) in 0.01 M HNO3. The concentration of the metal ion in the stock solutions was determined using accepted chelatometry.[ii] pH buffers HEPES and N-cyclohexyl-3-aminopropane-sulfonic acid (CAPS) were purchased from Dojindo Laboratories, Kumamoto. All other chemicals used were of guaranteed ultrapure grade. Deionized water was used throughout the study.
Preparation of [Gd3TCAS2]7–
To a 100 mL beaker, 0.5 M CAPS buffer (pH 11.2, 5 mL), 24.6 mM TCAS solution (16.3 mL), water (ca. 3 mL), and 9.64 mM Gd(NO3)3 (62.2 mL) were added. The pH of the mixture was adjusted to 11.2 by stepwise addition of 2 M NaOH in small portions. Then the solution was diluted to 100 mL with water ([Gd] = 3.0 × 10⁻⁴ M, [TCAS] = 2.0 × 10⁻⁴ M, [CAPS] = 2.0 × 10⁻² M, pH 11.2). The reaction mixture stirred gently at 60 °C for 64.5 h. Finally, the solution was evaporated to dryness at 45 °C, dried in vacuo at 45 °C for 10 h, and additionally dried in vacuo for 44 h over P2O5 to give 1.31 g of white powder of a mixture of sodium salts of [Gd3TCAS2]7– (2.0 × 10⁻⁴ mol) and CAPS (2.5 mmol). The reaction mixture after 1.0 h and the resulting solid powder were assayed with capillary electrophoresis (CE, Figure S1) to display essentially a single peak assigned to [Gd3TCAS2]7– that excluded formation of Gd-TCAS complexes of other stoichiometry.
Supporting Information Available
The Supporting Information is available free of charge on the ACS Publications website at DOI: 10.1021/acs.inorgchem.6b00241.
Preparation of Gd3TCAS2, dissociation kinetics, determination of hydration number, binding of Tb3TCAS2 to HSA, longitudinal relaxation rates for Gd3TCAS2, temperature dependence of relaxivity, dynamic light scattering, water exchange rate. (PDF)
Author Contributions
The manuscript was written through contributions of all authors. All authors have given approval to the final version of the manuscript.
No competing financial interests have been declared. This work was supported in part by Award No. R01EB009062 from the National Institute for Biomedical Imaging and Bioengineering and the National Center for Research Resources for instrumentation (Grant Nos. S10OD010650, S10RR023385, and P41RR14075). E.B. thanks the Swiss National Science Foundation (advanced postdoc mobility fellowship) as well as the NIH (K99HL125728) for support. N.I. thanks JSPS for KAKENHI (Grant No. 25288061).
The authors declare no competing financial interest.
Supplementary Material
References
- Helm L.; Merbach A.. The Chemistry of Contrast Agents in Medical Magnetic Resonance Imaging, 2nd ed.; Wiley, 2013; pp 25–81. [Google Scholar]
- Boros E.; Gale E. M.; Caravan P. Dalton Trans. 2015, 44, 4804–4818. 10.1039/C4DT02958E. [DOI] [PMC free article] [PubMed] [Google Scholar]
- Caravan P.; Ellison J. J.; McMurry T. J.; Lauffer R. B. Chem. Rev. 1999, 99, 2293–2352. 10.1021/cr980440x. [DOI] [PubMed] [Google Scholar]
- Bonnet C. S.; Tóth É. Adv. Inorg. Chem. 2016, 68, 43–96. 10.1016/bs.adioch.2015.09.002. [DOI] [Google Scholar]
- Helm L.; Merbach A. E. Chem. Rev. 2005, 105, 1923–1960. 10.1021/cr030726o. [DOI] [PubMed] [Google Scholar]
- Dumas S.; Jacques V.; Sun W.-C.; Troughton J. S.; Welch J. T.; Chasse J. M.; Schmitt-Willich H.; Caravan P. Invest. Radiol. 2010, 45, 600–612. 10.1097/RLI.0b013e3181ee5a9e. [DOI] [PMC free article] [PubMed] [Google Scholar]
- Caravan P.; Farrar C. T.; Frullano L.; Uppal R. Contrast Media Mol. Imaging 2009, 4, 89–100. 10.1002/cmmi.267. [DOI] [PMC free article] [PubMed] [Google Scholar]
- Zhang S.; Merritt M.; Woessner D. E.; Lenkinski R. E.; Sherry A. D. Acc. Chem. Res. 2003, 36, 783–790. 10.1021/ar020228m. [DOI] [PubMed] [Google Scholar]
- Aime S.; Delli Castelli D.; Terreno E. Angew. Chem., Int. Ed. 2005, 44, 5513–5515. 10.1002/anie.200501473. [DOI] [PubMed] [Google Scholar]
- Soesbe T. C.; Merritt M. E.; Green K. N.; Rojas-Quijano F. A.; Sherry A. D. Magn. Reson. Med. 2011, 66, 1697–1703. 10.1002/mrm.22938. [DOI] [PMC free article] [PubMed] [Google Scholar]
- Iki N.; Tanaka T.; Hoshino H. Inorg. Chim. Acta 2013, 397, 42–47. 10.1016/j.ica.2012.11.016. [DOI] [Google Scholar]
- Tanaka T.; Iki N.; Kajiwara T.; Yamashita M.; Hoshino H. J. Inclusion Phenom. Mol. Recognit. Chem. 2009, 64, 379–383. 10.1007/s10847-009-9567-0. [DOI] [Google Scholar]
- Iki N.; Hiro-oka S.; Nakamura M.; Tanaka T.; Hoshino H. Eur. J. Inorg. Chem. 2012, 2012, 3541–3545. 10.1002/ejic.201200464. [DOI] [Google Scholar]
- Baranyai Z.; Pálinkás Z.; Uggeri F.; Maiocchi A.; Aime S.; Brücher E. Chem. - Eur. J. 2012, 18, 16426–16435. 10.1002/chem.201202930. [DOI] [PubMed] [Google Scholar]
- Sarka L.; Burai L.; Király R.; Zékány L.; Brücher E. J. Inorg. Biochem. 2002, 91, 320–326. 10.1016/S0162-0134(02)00418-X. [DOI] [PubMed] [Google Scholar]
- Laurent S.; Elst L. V.; Muller R. N. Contrast Media Mol. Imaging 2006, 1, 128–137. 10.1002/cmmi.100. [DOI] [PubMed] [Google Scholar]
- Caravan P.; Cloutier N. J.; Greenfield M. T.; McDermid S. A.; Dunham S. U.; Bulte J. W. M.; Amedio J. C.; Looby R. J.; Supkowski R. M.; Horrocks W. D.; McMurry T. J.; Lauffer R. B. J. Am. Chem. Soc. 2002, 124, 3152–3162. 10.1021/ja017168k. [DOI] [PubMed] [Google Scholar]
- Zhou X.; Caravan P.; Clarkson R.; Westlund P.-O. J. Magn. Reson. 2004, 167, 147–160. 10.1016/j.jmr.2003.12.006. [DOI] [PubMed] [Google Scholar]
- Laurent S.; Vander Elst L.; Copoix F.; Muller R. N. Invest. Radiol. 2001, 36, 115–122. 10.1097/00004424-200102000-00008. [DOI] [PubMed] [Google Scholar]
- Horrocks W. D. W.; Sudnick D. R. J. Am. Chem. Soc. 1979, 101, 334–340. 10.1021/ja00496a010. [DOI] [Google Scholar]
- Beeby A.; Clarkson I. M.; Dickins R. S.; Faulkner S.; Parker D.; Royle L.; de Sousa A. S.; Williams J. A. G.; Woods M. J. Chem. Soc., Perkin Trans. 2 1999, 2, 493–503. 10.1039/a808692c. [DOI] [Google Scholar]
- Swift T.; Connick R. E. J. Chem. Phys. 1962, 37, 307–320. 10.1063/1.1701321. [DOI] [Google Scholar]
- Micskei K.; Helm L.; Brucher E.; Merbach A. E. Inorg. Chem. 1993, 32, 3844–3850. 10.1021/ic00070a013. [DOI] [Google Scholar]
- Dellavia I.; Helm L.; Merbach A. E. Inorg. Chem. 1992, 31, 2230–2233. 10.1021/ic00037a043. [DOI] [Google Scholar]
- Southwood-Jones R. V.; Earl W. L.; Newman K. E.; Merbach A. E. J. Chem. Phys. 1980, 73, 5909–5918. 10.1063/1.440148. [DOI] [Google Scholar]
- Zhang S.; Wu K.; Sherry A. D.; Inves Invest. Radiol. 2001, 36, 82–86. 10.1097/00004424-200102000-00003. [DOI] [PubMed] [Google Scholar]
- Powell D. H.; Dhubhghaill O. M. N.; Pubanz D.; Helm L.; Lebedev Y. S.; Schlaepfer W.; Merbach A. E. J. Am. Chem. Soc. 1996, 118, 9333–9346. 10.1021/ja961743g. [DOI] [Google Scholar]
- Gianolio E.; Cabella C.; Colombo Serra S.; Valbusa G.; Arena F.; Maiocchi A.; Miragoli L.; Tedoldi F.; Uggeri F.; Visigalli M. JBIC, J. Biol. Inorg. Chem. 2014, 19, 1–12. 10.1007/s00775-014-1111-z. [DOI] [PubMed] [Google Scholar]
- Moriggi L.; Yaseen M. A.; Helm L.; Caravan P. Chem. - Eur. J. 2012, 18, 3675–3686. 10.1002/chem.201103344. [DOI] [PMC free article] [PubMed] [Google Scholar]
- Tóth É.; Helm L.; Merbach A. E.; Hedinger R.; Hegetschweiler K.; Jánossy A. Inorg. Chem. 1998, 37, 4104–4113. 10.1021/ic980146n. [DOI] [PubMed] [Google Scholar]
- Aime S.; Carrera C.; Delli Castelli D.; Geninatti Crich S.; Terreno E. Angew. Chem., Int. Ed. 2005, 44, 1813–1815. 10.1002/anie.200462566. [DOI] [PubMed] [Google Scholar]
Associated Data
This section collects any data citations, data availability statements, or supplementary materials included in this article.