

Abstract
Traditional toxicology testing has relied on low-throughput, expensive mammalian studies; however, timely testing of the large number of environmental toxicants requires new in vitro and in vivo platforms for inexpensive medium- to high-throughput screening. Herein, we describe the suitability of the asexual freshwater planarian Dugesia japonica as a new animal model for the study of developmental neurotoxicology. As these asexual animals reproduce by binary fission, followed by regeneration of missing body structures within approximately 1 week, development and regeneration occur through similar processes allowing us to induce neurodevelopment “at will” through amputation. This short time scale and the comparable sizes of full and regenerating animals enable parallel experiments in adults and developing worms to determine development-specific aspects of toxicity. Because the planarian brain, despite its simplicity, is structurally and molecularly similar to the mammalian brain, we are able to ascertain neurodevelopmental toxicity that is relevant to humans. As a proof of concept, we developed a 5-step semiautomatic screening platform to characterize the toxicity of 9 known neurotoxicants (consisting of common solvents, pesticides, and detergents) and a neutral agent, glucose, and quantified effects on viability, stimulated and unstimulated behavior, regeneration, and brain structure. Comparisons of our findings with other alternative toxicology animal models, such as zebrafish larvae and nematodes, demonstrated that planarians are comparably sensitive to the tested chemicals. In addition, we found that certain compounds induced adverse effects specifically in developing animals. We thus conclude that planarians offer new complementary opportunities for developmental neurotoxicology animal models.
Keywords: planarian, aquatic toxicology, developmental neurotoxicity, behavior, screening
The “Tox21” initiative (http://epa.gov/ncct/Tox21/), a multiagency partnership was launched in 2008 to establish a new area in toxicology testing, away from low throughput, high-cost mammalian models, toward in vitro and alternative nonmammalian animal systems amenable to low cost, high-throughput screening (HTS) (Vliet, 2011). To achieve this, the ToxCast program (http://www.epa.gov/ncct/toxcast/) was launched, using a large scale in vitro HTS robotic approach to evaluate thousands of chemicals for a variety of potential molecular and cellular toxicity effects (Judson et al., 2010). However, the inherently artificial environment and lack of biological complexity in in vitro HTS make them difficult to directly connect with organism level toxicity (Knight et al., 2009). Therefore, as the second component of the Tox21 agenda, medium-throughput screening (MTS) animal models were introduced to complement HTS assays (Collins et al., 2008). Because each animal model has specific strengths and weaknesses, in terms of throughput, cost, and homology to humans, any one system is insufficient to cover all aspects of toxicity in humans, making comparative analyses across diverse animals important for the proper prioritization of toxicants for further study and development of human exposure guidelines.
In this study, we establish the suitability of freshwater planarians, famous for their regenerative capabilities due to a large population of adult pluripotent stem cells (Cebrià, 2007; Reddien and Sánchez Alvarado, 2004; Rink, 2013; Scimone et al., 2014; Wagner et al., 2011), as a new model for MTS toxicology studies. In terms of organismal complexity, planarians occupy an intermediate position between the newly developed alternative toxicology animal models zebrafish and nematodes (Boyd et al., 2012; Peterson et al., 2008; Selderslaghs et al., 2009; Sipes et al., 2011; Truong et al., 2014) and possess unique features that make them especially well-suited for developmental neurotoxicology. Like zebrafish and nematodes, freshwater planarians are small, inexpensive, easy to breed, sensitive to chemicals in the water, and develop quickly (in approximately 1 week). For the asexual Dugesia japonica species used in this study, development and regeneration are similar processes as these animals reproduce by transverse fission creating a head and a tail piece, each subsequently regenerating all missing body structures (Sakurai et al., 2012). We can thus induce development “at will” by amputation in a purely clonal population.
What renders freshwater planarians unique and particularly well-suited for developmental neurotoxicology is our ability to simultaneously study genetically identical adult and developing animals, allowing us to directly compare the effect of potential toxicants on the adult and developing brain, without possible complications from the variability of genetic factors. In addition, the planarian nervous system, consisting of a bi-lobed cephalic ganglion (brain) and ventral nerve cords, is much more complex than that of nematodes, but simpler than that of zebrafish. It remains tractable on the cellular level (approximately 10 000 neurons) although having sufficient complexity and homology, sharing the same neuronal subpopulations and neurotransmitters as the mammalian brain, to be relevant to human studies (Buttarelli et al., 2008; Cebrià, 2007; Cebrià et al., 2002). In fact, the planarian brain is thought to be more similar to the vertebrate brain than to other invertebrate brains in terms of structure and function (Buttarelli et al., 2008). Most notably, 95% of nervous system related genes in D. japonica have homologs in humans (Mineta et al., 2003). Thus, by studying planarian brain development, we can gain insight into key mechanisms for human brain development.
As a result, various species of freshwater planarians have previously been used for pharmacological and toxicological studies (Lowe et al., 2015; Pagán et al., 2006; Stevens et al., 2014; Talbot and Schötz, 2011). These studies, albeit primarily focused on a single compound, low throughput, and largely qualitative in nature, demonstrated that planarians are highly sensitive to certain chemicals and that toxicity can be assessed via behavioral and morphological readouts.
In this study, we evaluated the potential of the planarian system as a new model for MTS toxicology studies by studying 9 known neurotoxicants and the neutral compound, glucose. Using a proof-of-concept screen, we determined and characterized, for these compounds, the lethal dose, systemic and behavioral effects, and neurotoxicity, resulting from exposure in adult and developing animals. We show that D. japonica has comparable sensitivity to other model systems, as evaluated by a quantitative comparison of our data with data from zebrafish and nematodes. Furthermore, by studying full and developing animals simultaneously, we detected toxicity specific to the developing brain. Based on these results, we conclude that planarians are well-suited for screening potential developmental neurotoxicants and allow for the addition of a new alternative animal model to the field of neurotoxicology.
MATERIALS AND METHODS
Test animals
Freshwater planarians of the species D. japonica were used for all tests. Planarians were stored in 1× planarian water (Cebrià and Newmark, 2005) in Tupperware containers at 20°C in a Panasonic refrigerated incubator in the dark. Animals were fed organic beef liver once a week and cleaned twice a week when not used for experiments (Dunkel et al., 2011). Test animals were randomly selected from a healthy population. For all experiments, only fully regenerated worms that had not been fed within 1 week and which were found gliding normally in the container were used. Worms were manually selected to fall within a certain range of sizes and we found them, after automated size measurement, to be 3.4 ± 0.7 mm (mean ± SD) in length. To study regenerating animals, on day 1, intact worms were amputated with an ethanol-sterilized razor blade no more than 3 h before an assay was started.
Test compounds
The following were tested and reconstituted according to the manufacturer guidelines as described below: dimethyl sulfoxide (DMSO, Sigma Aldrich, D2650), permethrin (Sigma Aldrich, 44-2748), chlorpyrifos (Fluka Analytical, 45 395), dichlorvos (Chem Service, N-11675), ethanol (Roptec, V1001), methanol (Fisher Scientific, A454), TritonX-100 (Alfa Aesar, A16046), sodium dodecyl sulfate (SDS, Promega, H5113), acrylamide (Tokyo Chemical Industry, A1132), and d-glucose (Sigma-Aldrich, D9434). All solutions were prepared in 1× planarian water. Chemicals that were soluble in water, ie, DMSO, dichlorvos, ethanol, methanol, TritonX-100, SDS, acrylamide, and d-glucose, were added directly to planarian water to obtain the desired concentrations. Stocks of 500 mM chlorpyrifos and 100 mM permethrin were prepared in 100% DMSO such that, in the final working solutions, the DMSO concentration did not exceed 0.1%. All solutions were checked with a pH meter and were found to fall within a reasonable range (pH 7.39–7.75). Working solutions were stored at room temperature. DMSO, acrylamide, and permethrin solutions were stored in the dark. To mitigate diminishing effects due to evaporation, all ethanol solutions were replaced daily. Table 1 summarizes tested chemicals and concentrations.
TABLE 1.
Chemicals And Concentration Ranges Tested
| Compound | CAS | Source | Purity (%) | Concentration range tested |
|---|---|---|---|---|
| Acrylamide | 79-06-1 | Tokyo Chemical Industry | 98.0 | 10 µM to 100 mM |
| Chlorpyrifos | 2921-88-2 | Fluka Analytical | 99.7 | 0.1–500 µM |
| Dichlorvos | 62-73-7 | Chem Service | 97.8 | 10 nM to 8 µM |
| DMSO | 67-68-5 | Sigma Aldrich | 99.7 | 0.05–15% |
| Ethanol | 64-17-5 | Roptec | 100 | 0.01–15% |
| Glucose | 50-99-7 | Sigma-Aldrich | 99.5 | 55 µM to 550 mM |
| Methanol | 67-56-1 | Fisher Scientific | 99.9 | 0.5–7% |
| Permethrin | 52645-53-1 | Sigma-Aldrich | N/A | 10–1000 µM |
| SDS | 151-21-3 | Promega | 99.5 | 0.2–6 mg/l |
| TritonX-100 | 9002-93-1 | Alfa Aesar | N/A | 5–50 mg/l |
Lethality assay
The first step in determining the toxicity of a compound was a broad range screen on its effect on planarian health and regeneration. Small planarians were selected as described earlier and distributed into a 48-well plate (Falcon, 353 078) such that each well contained 1 worm. Each row was filled with half full and half recently amputated (< 3 h) animals. Once a plate was completely filled with worms, the planarian water was removed, and 200 µl of the appropriate chemical solution was added to each well. For each concentration of a chemical, at least 2 independent experiments with 8 full worms and 8 regenerating worms were performed as biological replicates, thus at least 16 full and regenerating animals were assayed for each condition.
Animals were stored in the plate for 15 days at room temperature in the dark. Worms that did not move even after gentle prodding or agitation of the water were considered dead. Deaths were manually inspected and tallied in Microsoft Excel. The resulting data were manually imported into MATLAB (Mathworks) for plotting and analysis. The fraction of dead worms as a function of concentration at days 2, 4, 8, and 15 was plotted and fitted using the following equation (Selderslaghs et al., 2009):
where y is the fraction of dead individuals, x is the logarithm of the chemical concentration to obtain the LC50, and Hill slope is the slope factor of the dose–response curve. The 2 asymptotes of the original Hill equation were forced to be 0 and 1 because most of our ranges were sufficient to cover these 2 asymptotes. In one instance, we did not calculate a LC50 value due to lack of death and in 2 instances with insufficient data to cover these asymptotes this choice lead to an increased uncertainty in the LC50 measurements.
Unstimulated behavioral assays
For each toxicant concentration tested, 24 planarians were placed in 2 12-well plates (Falcon, 353 043), with a single worm placed in each well, and their locomotion was determined using automated center of mass (COM) tracking (Supplementary Figs. 1A and 1B). Once both plates were filled, the planarian water was removed, and 500 µl of the appropriate concentration of chemical was added to each well. For evaluation of acute toxicity, plates were imaged within 5 min of adding the chemical. These same worms were also imaged after 8 days of exposure. To assay the locomotion of regenerating worms, for each concentration, 24 planarians were amputated using an ethanol-sterilized razor blade and immediately stored in a 48-well plate, with a single worm in each well containing 200 µl of the appropriate chemical. On day 8, the regenerating worms were transferred to 2 12-well plates containing a single worm and 500 µl of the respective chemical per well. Regenerating worms were imaged 8 and 15 days after amputation and chemical exposure. Except during imaging, the plates were stored at 20°C in the dark.
The imaging system consisted of a ring stand with a CCD camera (PointGrey Flea3 1.3MP Mono USB 3.0) equipped with a 16-mm lens (Tamron M118FM16 Megapixel Fixed-focal Industrial Lens). The plates were illuminated from below using a cold LED panel (Amazon.com). Image acquisition was controlled through a custom LabVIEW (National Instruments) script. The 2 plates were imaged at 5 frames per second (fps) for 10 min, following our previously established protocol for characterizing behavioral phenotypes in response to drug exposure (Talbot and Schötz, 2011). Image analysis was performed using custom made scripts in MATLAB. An average intensity projection image was first generated from the entire movie and subtracted from each picture in the stack. The resulting images were thresholded to obtain the worm’s outline, and each worm was automatically assigned a well number, whereas its COM, length, and area were recorded. Worm tracks were sometimes truncated, when worms were lost at the well edges. Only tracks longer than 2 s were analyzed. Instantaneous speeds (in mm/s) were calculated for all tracks at 2 s intervals to improve the signal-to-noise ratio (Talbot and Schötz, 2011).
We distinguished between 3 different behaviors: resting, swimming, and gliding. A speed below 0.3 mm/s was considered as the worm’s resting or wiggling speed. To distinguish swimming from gliding, we defined a dynamic cutoff as follows: the speed distribution of the entire population of 24 worms was computed and fitted by the sum of 2 Gaussians and a constant value (Supplementary Fig. 1C) according to:
The fit was performed using the built-in MATLAB fit function and nonlinear least square method. The fit output was shown graphically on top of the raw data. In case of poor fit results, the user could manually determine the relevant parameters instead. Worms were considered as gliding at any time point for which the speed was larger than , a value that was adapted by hand to represent the behavior of control populations. The worms were declared swimming at time points for which the speed was between the absolute resting cutoff and this dynamic gliding cutoff (Supplementary Fig. 1C).
From this population level classification, each worm was assigned a fraction of time spent in each of the 3 behaviors for all time points tracked. To remove bias due to differences in worm size, we scaled the animal’s speed by its aspect ratio, calculated as the ratio of the worm’s length squared to the worm area, or , to reduce noise in the measurement. Based on control populations and the MATLAB built-in power law fit tool, we found that the gliding speed scaled with the power 2/3 of this aspect ratio (Supplementary Fig. 1D). We therefore defined a scaled gliding speed as the absolute gliding speed divided by that measurement. All measurements were averaged over the entire population (n = 24), and error bars were calculated as the standard error of the mean. Of note, the contribution of each worm to the mean was not weighed by the time for which it was tracked, thus treating all worms equal.
Thermotaxis assay
For every tested concentration, 20 worms were amputated and allowed to regenerate for 15 days in the respective concentration of chemical. After this period, the regenerating worms were placed in a single 100 mm Petri dish filled with 20 ml of planarian water. The dish was placed atop a kimwipe on top of a custom 10.5 cm wide circular Peltier cooler with a central 3 cm wide square cold plate surrounded by a circular heat sink. This cooler was powered by a DC regulated power supply (BK Precision) set to 5 V. During the assay, the temperature was initially homogenous at 20°C (gradient off) and then displayed a gradient between 15°C in the center to 20°C at the edges (gradient on). Similar values were previously used to induce negative thermotaxis (motion towards cold regions) in planarians (Inoue et al., 2014).
Per experiment, 2 trials were run to compare the behavior of the worms with the gradient turned on and off. Imaging was performed with the same set up as the behavior assay for 10 min at 1 fps. Heat maps were generated from the resulting movies by subtracting a background picture without worms and computing the standard deviation projection of the resulting stack in ImageJ (National Institutes of Health). To quantify the amount of thermotaxis, each heatmap was first rescaled to have a mean intensity of 1 to account for possible differences in background lighting. We then computed the ratio of the resulting intensity in the cold region with gradient over the same region without gradient. Thus, ratios > 1 signify increased grouping of the worms toward the center of the dish, indicating successful negative thermotaxis.
Regeneration assay
For each chemical, a regeneration assay was set up with a minimum of n = 10 similarly sized planarians at selected nonlethal concentrations. On day 1, planarians were imaged and amputated with an ethanol-sterilized razor blade. Within 3 h postamputation, planarians were transferred to 48-well plates, 1 worm per well, and 200 µl of the appropriate concentration of chemical was added to each well. Except during imaging, all worms were stored at 20°C in the dark. Because little regenerative tissue (blastema) is discernible during the first few days, imaging began on day 4. Worms were imaged on days 4–7 on a MZ16FA stereo microscope (Leica), using a SPOT RT3 camera (Model 25.1, Diagnostics Instruments) controlled by SPOT Basic 5.1 software (SPOT Imaging Solutions). The appearance of eyes was manually scored during imaging.
Image analysis of head regeneration dynamics was carried out using a custom semiautomatic MATLAB script in which the area of the blastema was determined using thresholding techniques (Supplementary Figs. 1E and 1F) based on 2 images independently analyzed by 2 people (ie, average of 4 data points). Multiple images were analyzed to account for possible variability in analysis. Only worms that remained intact over the course of the experiment, ie, were not damaged due to manual manipulation or did not undergo asexual reproduction via fission, were used for analysis. If this occurred, a biological replicate was performed and the data from all replicates were combined. To eliminate any bias based on the size of the worm, for each worm, the average blastema area was normalized by the square of the worm’s width (Supplementary Fig. 1E), as measured from 2 images taken on day 1. The rationale behind this normalization is a correlation between blastema size and wound cross-sectional area. Because we do not have access to the worm thickness in our measurements, but thickness scales proportionally to worm width (Supplementary Fig. 1G), we approximated the cross-sectional area using width squared. Widths were manually measured in ImageJ. The normalized blastema growth rate (1/days, denoted as γ) was determined as the slope of the linear regression of the normalized blastema area for the entire population (including independent experiments) over days 4–7 (Supplementary Fig. 1H). Error bars represent the 99% confidence intervals.
Immunohistochemistry experiments
To analyze effects on brain structure and regeneration, immunohistochemistry (IHC) was performed on full worms which had incubated in the respective chemical for 8 days or regenerated therein for 15 days. Following each experiment described earlier, worms were washed 3 times in 1× planarian water and transferred to a 1.5-ml microcentrifuge tube, with approximately 8 worms per tube. Planarians were fixed using a modified version of a previously published protocol (Umesono et al., 2013), with all solutions prepared in phosphate buffered saline. In brief, worms were incubated in 2% hydrochloric acid for 5 min and 4% paraformaldehyde/5% methanol for 3 h, both at 4°C with rotation. Worms were then transferred to room temperature and washed twice quickly with 0.3% Triton-X 100, followed by a 15-min incubation with reduction solution (50 mM dithiothreitol, 1% NP-40, and 0.5% SDS) to increase permeabilization. Worms were subsequently washed in 50% methanol for 10 min and stored in 100% methanol at −20°C.
Fixed samples were bleached under bright white light for 5–6 h in 6% hydrogen peroxide, followed by overnight blocking at 4°C in antibody blocking buffer (1% DMSO, 10% fetal bovine serum, 0.1% Tween-20, and 0.3% TritonX-100). To visualize brain structure, worms were subsequently incubated with mouse α-synapsin antibody (Developmental Studies Hybridoma Bank, 3C11, anti-SYNORF1, deposited to the DSHB by Buchner, Erich) diluted 1:500 in antibody blocking buffer, overnight at 4°C. The samples were washed with 0.1% Tween-20 and 0.3% TritonX-100 5 times for 20–30 min and incubated overnight at 4°C with Alexa Fluor 488 Goat Anti-Mouse IgG (H + L) secondary antibody (Life Technologies, A-11001), diluted 1:1000 in antibody blocking solution. Worms were washed 5 times for 20–30 min at room temperature with 0.1% Tween-20 and 0.3% TritonX-100 before mounting and imaged on an inverted IX81 spinning disc confocal microscope (Olympus DSU) using an ORCA-ER camera (Hamamatsu Photonics) and Slidebook software (version 5, Intelligent Imaging Innovations, Inc). As worms could be lost or damaged during the course of staining, IHC was performed on at least 2 biological replicates of treated worms to obtain n greater than or equal to 10.
To analyze the relative size of the brain, we quantified the fraction of the width of the brain over the width of the head (Supplementary Fig. 1I). Quantification was manually performed in ImageJ by analyzing the maximum intensity projections of z-stacks taken with a 10× objective independently by 2 researchers who did not know which images he or she was analyzing, thus ensuring that experimenter bias could not influence the analysis. Measurement data were compiled and analyzed in Microsoft Excel and MATLAB.
Potency measurement
To summarize our results, we determined the lowest concentrations of each toxicant at which an effect was seen (lowest observed effect level [LOEL]), converted to µM, on 17 quantitative read outs: LC50 for full and regenerating worms at 4 different time points, mean scaled gliding speeds for full and regenerating worms at two different time points each, blastema growth rate, eye regeneration, brain structure for full and regenerating worms, and proper thermotaxis. To compare these concentrations over wide ranges, we defined potency as –log10 (concentration in µM).
Statistical testing
To determine statistical significance in the obtained results for the various assays, we performed a student t test for pair wise comparison between toxicant population and controls after verification that the data were normally distributed. All statistical analyses were performed in MATLAB. As this was a pilot study to establish the sensitivity of planarians for toxicological screening, we empirically determined the number of samples used in each assay. Using a post hoc power analysis with Gpower (Erdfelder et al., 1996), we determined that the sample sizes used in unstimulated behavior, regeneration, and brain structure assays were sufficient to detect effects of one standard deviation at the 1% level at a statistical power of 85%, 75%, and 62%, respectively.
RESULTS
Overview
The primary objective of this study was to evaluate whether the asexual freshwater planarian D. japonica is a suitable animal model for studying environmental toxicants, particularly developmental neurotoxicants. Therefore, to assess the usefulness of the system, we evaluated the toxicity of 10 well-studied substances: DMSO, a classic solvent and known neurotoxicant; pesticides commonly used in agriculture: 2 organophosphates, chlorpyrifos and dichlorvos, and 1 pyrethroid, permethrin, because of their relevance for human health and their known toxic mechanisms inhibiting the enzyme acetylcholinesterase and disrupting neuronal sodium channels, respectively (Amitai et al., 1998; Bradberry et al., 2005); the detergents TritonX-100 and SDS, commonly used in cleaning products and with characterized detrimental effects on fish and other aquatic organisms (Abel, 1974); the most common alcohols, ethanol and methanol, which are well-established to cause developmental neurotoxicity; acrylamide, a widely used industrial chemical also commonly found as a food contaminant (Parzefall, 2008), with known effects as a potential neurotoxicant (LoPachin, 2004); and glucose, expected to be inert to neurodevelopment but potentially affecting other pathways, particularly in metabolism, to establish how effects other than neurotoxicity could be assessed in our system.
We used these compounds to determine (1) how sensitive planarians were to these toxicants when compared with other animal models, and (2) whether a detectable difference existed in the response of adult versus developing planarians, with particular interest in changes in brain structure. To this end, we developed a 5-step semi-automated screening platform that enabled us to first determine the LC50 and then the LOEL for each compound, using 4 additional readouts at sublethal concentrations: unstimulated behavior, stimulated behavior, regeneration dynamics, and structural brain defects, as outlined in Figure 1.
FIG. 1.

Overview of assay. Description of experiments performed with readout, method, times tested, and average weekly throughput listed for each. With the exception of thermotaxis, full and regenerating tail pieces were used for all assays. A timeline is given to describe the screening experimental procedure.
Viability
The first step in our screening platform was to determine the lethal concentration of each compound. Selection of several of the initial broad concentration ranges was guided using previously published reports of lethality and toxicity in planarians (Li, 2008; Pagán et al., 2006; Yuan et al., 2012) and zebrafish (Bichara et al., 2014; DeMicco et al., 2010; Maes et al., 2012; Watson et al., 2014). Because lethality does not solely depend on toxicant concentration but also on the length of exposure, we assessed lethality after 2, 4, 8, and 15 days of exposure (Fig. 2). In addition, we compared the survival of full (adult) and regenerating worms, exposed within 3 h postamputation, over this time scale to assess whether some chemicals were more potent during development. Each chemical was therefore attributed a LC50 at 4 different time points for both full and regenerating worms (n = 16 each, from 2 independent experiments, Table 2). As expected, the LC50 decreased with the length of exposure. For our other assays, we retained the 15 day LC50 as the maximum concentration to be used.
FIG. 2.

Viability of full and regenerating worms. The lethality of each chemical is shown as the fraction of dead worms (Fdead) after 2, 4, 8, or 15 days of exposure to: A, DMSO, B, permethrin, C, chlorpyrifos, D, dichlorvos, E, ethanol, F, methanol, G, SDS, H, TritonX-100, I, acrylamide, and J, glucose for full (black) and regenerating (gray) worms. Solid black and gray dashed lines show the result of the fit, as described in “Materials and methods” section, for full and regenerating worms, respectively.
TABLE 2.
LC50 Values After 2, 4, 8, Or 15 Days of Exposure for Full And Regenerating Worms
| Chemical | Worm condition | Day 2 | Day 4 | Day 8 | Day 15 |
|---|---|---|---|---|---|
| Acrylamide | Full | 6787 µM | 2720 µM | 991 µM | 785 µM |
| Regen | 6787 µM | 1462 µM | 1208 µM | 904 µM | |
| Chlorpyrifos | Full | 238 µM | 181 µM | 177 µM | 67 µM |
| Regen | 386 µM | 252 µM | 209 µM | 135 µM | |
| Dichlorvos | Full | 11.9 µM | 2.86 µM | 1.92 µM | 1.73 µM |
| Regen | N/A | 6.07 µM | 3.40 µM | 3.04 µM | |
| DMSO | Full | 7.08% | 7.03% | 4.13% | 3.35% |
| Regen | 7.06% | 6.80% | 5.03% | 3.75% | |
| Ethanol | Full | 1.94% | 1.92% | 0.90% | 0.70% |
| Regen | 2.00% | 1.98% | 1.34% | 0.75% | |
| Glucose | Full | 139 mM | 110 mM | 105 mM | 74 mM |
| Regen | 144 mM | 143 mM | 125 mM | 83 mM | |
| Methanol | Full | 5.88% | 5.31% | 5.18% | 4.92% |
| Regen | 6.38% | 5.68% | 5.63% | 5.51% | |
| Permethrin | Full | 653 µM | 500 µM | 384 µM | 139 µM |
| Regen | 1000 µM | 784 µM | 609 µM | 382 µM | |
| SDS | Full | 2.22 mg/l | 2.26 mg/l | 2.26 mg/l | 1.82 mg/l |
| Regen | 1.24 mg/l | 1.57 mg/l | 1.57 mg/l | 1.57 mg/l | |
| TritonX-100 | Full | 36 mg/l | 34 mg/l | 31 mg/l | 25 mg/l |
| Regen | 41 mg/l | 40 mg/l | 39 mg/l | 35 mg/l |
LC50 was quantified using a modified Hill’s equation (see “Materials and Methods” section). N/A indicates no deaths were observed.
Surprisingly, we found that regenerating worms were slightly more resilient than full worms in the same conditions, with the notable exception of SDS. This effect was most apparent with the pyrethroid permethrin (Fig. 2, Table 2), where, after 15 days of exposure, the LC50 value for regenerating worms (382 µM) was found to be almost 3 times greater than that for full worms (139 µM). A possible explanation for this difference in sensitivity may be that regenerating worms are generally more stationary than full worms, potentially reflecting a difference in metabolism.
Notably, we observed a 100-fold difference in LC50 values between the 2 organophosphates, chlorpyrifos and dichlorvos. This difference is potentially due to the differences in the structure and metabolism of these 2 compounds. Dichlorvos and chlorpyrifos are dimethyl and diethyl organophosphates, respectively; thus, they could potentially have different affinities for planarian acetylcholinesterase. Furthermore, dichlorvos is already in its toxic oxon form, whereas chlorpyrifos must be metabolically converted into its oxon by proteins of the cytochrome P450 family to be able to inhibit acetylcholinesterase (Tang et al., 2001), potentially reflecting the observed decreased sensitivity to chlorpyrifos, in comparison with dichlorvos.
Overall, the observed values are comparable with data from zebrafish and Caenorhabditis elegans (see “Discussion” section) demonstrating that planarians are not unusually sensitive or resilient to any of these compounds.
Unstimulated Behavior
For the sublethal concentrations determined earlier, we assayed possible defects in unstimulated planarian behavior induced by the different toxicants through quantification of the gliding speed and overall activity level of individual worms. Proper gliding requires both a constant production of mucus and coordinated cilia beating. Even recently amputated worms are capable of gliding, albeit at a reduced speed until 12–13 days of regeneration (Supplementary Fig. 2), showing that gliding does not require a fully functional brain but more likely depends on the function of the ventral nerve cords and proper metabolism.
First, we tested the toxicants’ acute general toxicity by measuring the mean gliding speed of full worms immediately after exposure to different sublethal concentrations. Then, to determine the subchronic toxicity of these toxicants, we measured gliding speeds of both full and regenerating worms after 8 days of exposure to distinguish subchronic toxic effects that affected either full or regenerating worms and thus identify possible effects specific to development. Finally, we tested regenerating worms after 15 days of exposure to assess possible delays in the return of normal gliding speeds following amputation.
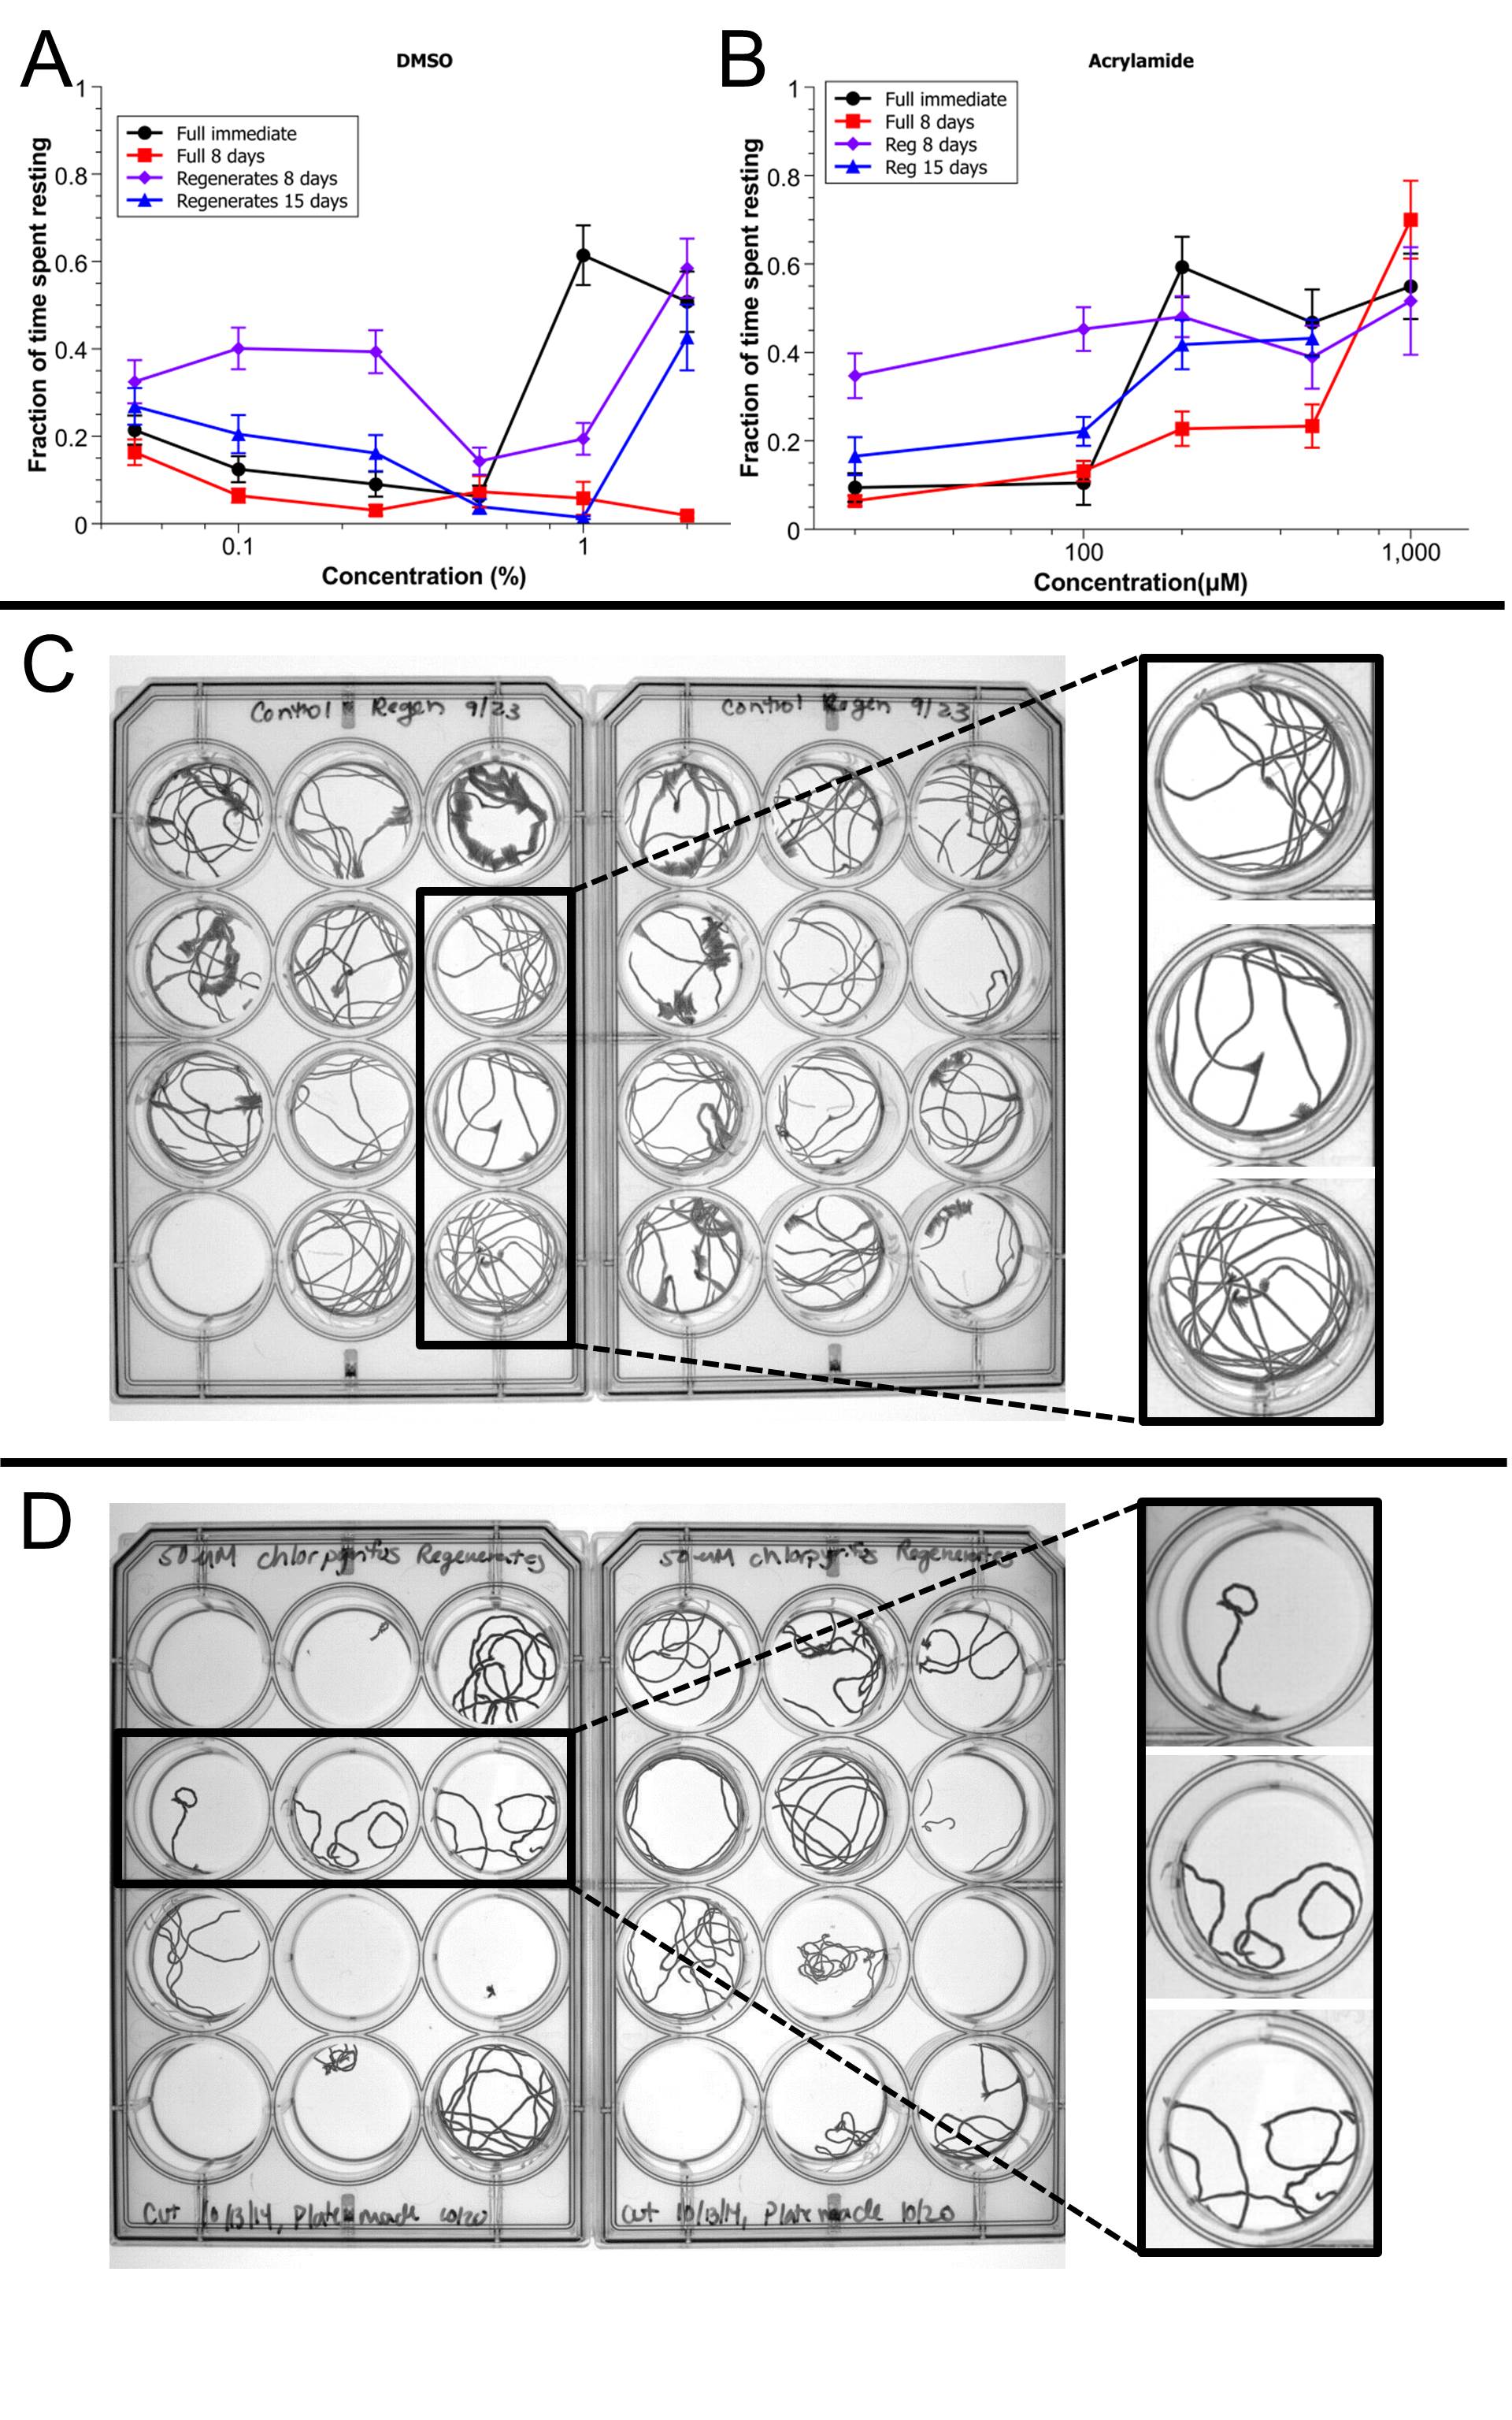
Acute toxicity was observed as a reduction in gliding speed in 200 µM permethrin (Fig. 3B), 100 and 500 nM dichlorvos (Fig. 3D), and 0.5 and 1 mg/l SDS (Fig. 3G). As expected, these concentrations also caused decreased gliding speeds on longer time scales in both full and regenerating worms. In addition, acute toxicity was also observed by a decrease in the worms’ activity for 1% and 2% DMSO (Supplementary Fig. 3A) and 200 and 500 µM acrylamide (Supplementary Fig. 3B). Here again, similar effects were observed at longer time scales in these conditions.
FIG. 3.

Unstimulated behavior of toxicant-exposed full and regenerating worms. Semi-log plot of mean scaled gliding speeds as a function of concentration during exposure to: A, DMSO, B, permethrin, C, chlorpyrifos, D, dichlorvos, E, ethanol, F, methanol, G, SDS, H, TritonX-100, I, acrylamide, and J, glucose. Different graphs correspond to the different time points and situations tested: immediate reaction of full worms, 8 days reaction of full worms and reaction of regenerating worms at both 8 and 15 days. Errors bars are SE of populations of n = 24 worms. Stars indicate statistical relevance at the 1% level for the corresponding time point when compared with control worms.
All tested chemicals displayed subchronic toxicity, demonstrating the sensitivity of our unstimulated behavioral assay. Of the 10 tested chemicals, 5 (DMSO, permethrin, SDS, TritonX-100, and glucose) showed subchronic toxicity in all conditions with slight differences in threshold concentrations between regenerating and full worms. The fact that subchronic exposure to glucose resulted in perturbed behavior was expected given its central role in metabolism, which directly affects unstimulated behavior. More specifically, of these 5 chemicals, all except TritonX-100, displayed lower threshold concentrations in regenerating worms, indicating possible increased sensitivity of developing planarians to these chemicals. However, the other 5 toxicants had more surprising toxicity profiles.
The alcohols, methanol and ethanol, were peculiar in the sense that they only affected 8 days regenerating worms (above 0.8% and 0.1%, respectively) but neither full nor 15 days regenerating worms (Figs. 3E and 3F), suggesting that these concentrations induced a slight delay in the retrieval of locomotion function during regeneration but did not impair these functions altogether.
The organophosphates, chlorpyrifos and dichlorvos, were particularly interesting because regenerating worms showed a higher sensitivity to these class of toxicants when compared with full worms (either immediately or after 8 days of exposure). Chlorpyrifos was the most striking with concentrations as low as 1 µM inducing reduced gliding speeds in both 8 and 15 days regenerating worms, whereas none of the tested concentrations showed any effect on full worms (Fig. 3C). In addition, qualitative differences in the worm’s trajectories were visible in chlorpyrifos with an increased frequency of sharp turns and head wiggles (Supplementary Figs. 3C and 3D), similar to reports of a zigzag swimming pattern seen in zebrafish larvae exposed to chlorpyrifos (Watson et al., 2014). Similarly, regenerating worms were more sensitive to dichlorvos than full worms (Fig. 3D). These results support the hypothesis that organophosphates might have developmental specific neurotoxic effects (Bjørling-Poulsen et al., 2008; Richendrfer et al., 2012) whose mechanisms remain to be understood.
Finally, acrylamide only showed subchronic toxicity on 8 days full and regenerating worms at concentrations higher than 100 µM (Fig. 3I). However, this effect was coupled to a clear reduction of activity levels (seen as the increased fraction of time spent resting, see Supplementary Fig. 3B) in full and regenerating worms, at both 8 and 15 days. These results suggest a more subtle effect of acrylamide on unstimulated behavior with potential effects on both the type of behavior adopted by the worms and their ability to perform gliding normally.
Altogether, these results show the ability of our semiautomated setup to reveal subtle effects on passive behavior due to toxicant exposure. We were able to distinguish acute and subchronic toxicity as well as reveal defects specific to developing brains. This emphasizes the strength of the opportunity offered by planarians to study, in parallel and at medium throughput, both adult and regenerating organisms.
Regeneration/Development Dynamics
Because we are using asexual D. japonica planarians, regeneration of a new brain after amputation is comparable to the typical development of a new planarian brain after “birth,” which is the generation of a tail piece during binary fission (Sakurai et al., 2012). Thus, by assaying brain regeneration, we are, in a way, simultaneously assaying brain development. To test whether any of the chemicals had adverse effects on regeneration dynamics and therefore development, amputated planarians were exposed to our predetermined sublethal range of concentrations for each chemical for 7 days, during which regeneration dynamics and eye reappearance were quantified as outlined in “Material and methods” (see Supplementary Figs. 1J–L for example images). Because proper regeneration requires the coordination of many different processes, including stem cell proliferation, differentiation, and re-establishment of polarity (Reddien, 2013; Umesono et al., 2013), possible toxic effects on this process are likely due to mechanisms of general developmental toxicity. Moreover, although equally regulated by the same processes as general regeneration, eye regeneration, is coordinated by specific neuronal populations (Dong et al., 2012; Mannini et al., 2004) and is therefore a more sensitive endpoint to assay possible specific neurotoxic effects. Therefore, this combined quantitative analysis of regeneration allowed us to simultaneously assess general physiological developmental toxicity and specific neuronal toxicity.
Surprisingly, most of the tested chemicals did not have a significant effect on either the normalized blastema growth rate (γ) or the number of eyes detected at day 7 (Fig. 4). Of the tested chemicals and concentrations, only 1% DMSO and 15 mg/l TritonX-100 (Supplementary Fig. IK) caused a significant delay in blastema growth. Similarly, at these same concentrations, more worms were found to have delays in eye regeneration, as a large number of worms had only one or no eyes at day 7, whereas the majority of controls had regenerated both eyes (Figs. 4C and 4L).
FIG. 4.

Regeneration is generally unaffected by toxicant exposure. Effects of the various chemicals on regeneration were quantified by the population blastema growth rate over days 4–7, normalized by the worm width squared, (γ), and the percent of worms with 0, 1, or 2 eyes at day 7 for: A–C, DMSO (n = 15, 20, and 19) and permethrin (n = 12, 22, and 9), D–F, chlorpyrifos (n = 19, 31, 34) and dichlorvos (n = 12, 20, and 11), G and H, ethanol (n = 20, 24, and 11) and methanol (n = 11, 12, and 24), J and K, SDS (n = 12, 12, and 10) and TritonX-100 (n = 12, 11, and 10), and M and N, acrylamide (n = 20, 20, and 10) and glucose (n = 18, 20, and 12) compared with controls (n = 58). Error bars represent the 99% confidence intervals of the fit. *Denotes the confidence intervals do not overlap with those of controls.
Interestingly, although no significant effect on blastema growth was found, worms regenerated in 100 and 200 µM permethrin and 200 µM acrylamide showed a delay in eye regeneration (Figs. 4C and 4O; and Supplementary Fig. 1L), suggesting that the effects of permethrin and acrylamide may be more specifically neurotoxic rather than generally toxic. This is consistent with the known effects of pyrethroids on neuronal voltage-gated sodium channels (Bradberry et al., 2005) and acrylamide on axonal swelling and demyelination (LoPachin, 2004; Parng et al., 2007).
In general, we found that the majority of the tested toxicants were not toxic to the overall physiology of the regenerating planarian. This suggests that, at the concentrations tested, any adverse effects seen in the toxicant-treated regenerating worms may be due to more targeted effects on specific pathways, rather than an effect of general toxicity.
Brain Structure
A powerful tool of alternative model organisms, such as zebrafish, nematodes, and planarians, is the ability to probe toxicity at different levels, from the organismal level down to the cellular and molecular level. To evaluate whether subchronic exposure to sublethal concentrations of the tested chemicals could lead to obvious morphological changes in the planarian brain, indicating possible brain defects resulting from toxicant exposure, we visualized the nervous system by IHC with a pan-neuronal marker, α-synapsin. To account for differences in worm size, the relative brain size was calculated as the ratio of the width of the brain to the width of the head at the same location (Supplementary Fig. 1I). Importantly, through this quantitative analysis, we were able to detect neurotoxicity manifested by large scale defects in the gross anatomy of the brain; however, more subtle neurotoxicity at the cellular level could be missed including defects in specific neurodevelopmental processes, such as neurite outgrowth or synaptogenesis.
We compared the relative brain size of full and regenerating worms exposed to different concentrations for 8 and 15 days, respectively (Fig. 5). These time scales were chosen as behavioral defects were detectable after 8 days for both full and regenerating animals (Fig. 3). However, for regenerating animals, toxicant exposure could potentially slow brain reformation. To specifically analyze toxic effects on brain morphology, rather than developmental delays, regenerating worms were assayed after 15 days of exposure to allow for complete nervous system regeneration. Full worms were tested to allow for comparison with regenerating worms to determine whether the toxicants were specific to either the developing or mature brain or were general to both.
FIG. 5.

Effects on brain morphology. Quantification of relative brain size as brain width/head width comparing controls (n = 20 full and 30 regenerating worms) to animals exposed to: A, DMSO (n = 11, 14, 13; 13, 15, 10), B, permethrin (n = 13, 13, 13; 15, 11, 13), C, chlorpyrifos (n = 10, 11, 16; 14, 21, 11), D, dichlorvos (n = 12, 13, 16, 12; 17, 16, 10, 11), E, ethanol (n = 19, 13, 10; 16, 19, 11), F, methanol (n = 12, 22, 20; 11, 11, 13), G, SDS (n = 12, 12, 11; 17, 15, 11), H, TritonX-100 (n = 14, 19, 13; 16, 10, 15), I, acrylamide (n = 15, 14, 19, 15, 12; 19, 16, 12, 14, 13), and J, glucose (n = 13, 17, 13; 19, 13, 13). n listed as (full; regenerated worm) in increasing concentration order. Error bars denote SE and * denotes p < .01 when compared with controls of the same worm type.
Generally, after toxicant exposure, brain morphology was more sensitively affected in regenerating worms than in full worms treated with the same concentrations. Development-specific defects in brain size, wherein regenerating but not full worms were affected, were detected after exposure to DMSO, permethrin, chlorpyrifos, ethanol, methanol, and TritonX-100 (Fig. 5).
This increased sensitivity displayed by regenerating worms was especially evident in worms exposed to permethrin, ethanol, and methanol, wherein a significant decrease in brain size was detected at multiple tested concentrations, although, even at the highest tested sublethal concentrations, no changes in the full worm brain morphology were found. Notably, although no quantitative differences in brain size were detected for regenerated worms treated with dichlorvos, qualitative differences in brain density were observed (Supplementary Fig. 4), indicating possible neurotoxicity that would require more in-depth analysis at the molecular or cellular level. Overall, the chemicals we tested were more potent on developing brains than on adult ones underlying the need for specific guidelines controlling exposure of infants and pregnant women to various toxicants.
Compared with exposure to the other chemicals, which resulted in classical dose-dependent changes in regenerated brain size, exposure to acrylamide was special with a seemingly biphasic effect on brain size. In fact, we found that exposure to lower concentrations of acrylamide (notably, 100 µM) led to a significant decrease in regenerated brain size; however, exposure to high concentrations (200 µM) resulted in an increase in regenerated brain size compared with non-treated controls (Fig. 5I). Upon inspection of the respective images associated with these brains, this effect was clearly visible as developing brains incubated in 200 µM acrylamide seemed to have a swollen and wider distribution of neurons, compared with control and lower concentrations of acrylamide (Supplementary Fig. 4). This effect is consistent with the previously described ability of acrylamide to cause axonal swelling (Parng et al., 2007). Furthermore, of all the tested concentrations in the various chemicals, only 500 µM acrylamide caused significant morphological changes in the adult brain. Similar to the effects with high concentrations of acrylamide on regenerating brains, this concentration induced an increase in brain size compared with controls, suggesting similar mechanisms of toxicity are occurring in the developing and adult brain, although with different sensitivities.
Full or regenerating worms exposed to sublethal concentrations of SDS did not display significant changes in brain morphology (Fig. 5G); however, more subtle effects on brain structure or function (see below) could be present which we would be unable to discern by this large-scale morphological approach. This was similarly seen for the nontoxic, neutral chemical, glucose (Fig. 5J), wherein we did not expect to find any structural changes in the brain.
Overall, quantitative comparison of relative brain sizes in regenerating and full worms allowed us to detect large-scale developmental-specific effects of neurotoxicity as exposure at the same concentrations specifically affected the brain size of regenerating animals.
Stimulated Behavior: Thermotaxis
Because the neuronal processes involved in unstimulated behavior are likely limited, evidenced by the ability of regenerating worms without a fully reformed brain to glide (Supplementary Fig. 2), we analyzed the ability of worms exposed to the various toxicants to perform temperature sensing as a more subtle readout of neuronal function. It has been previously shown (Inoue et al., 2014) that wild-type planarians exhibit a strong preference for colder temperatures; therefore, we tested for proper brain function using the worms’ negative thermotaxis, ie, their ability to move towards regions of lower temperature. The neuronal mechanisms underlying planarian thermotaxis involve temperature sensing by receptors of the transient receptor potential family, signal processing by serotoninergic neurons in the brain, and behavioral output mediated by cholinergic motor neurons (Inoue et al., 2014). The ability of a worm to perform negative thermotaxis is thus a good readout of the proper function of these specific sensory and processing neurons. We tested thermotaxis on worms that were allowed to regenerate for 15 days in the presence of the different toxicants. Because these tests were conducted manually, as described in “Material and methods”, we only tested one concentration per chemical using either the lowest concentration found to induce defects in brain morphology or found to induce behavioral abnormalities for 15 days regenerating animals.
Through quantification of the worms’ response and visual inspection of the density heat maps (Figs. 6A and 6B; Supplementary Fig. 5), we found that thermotactic ability was entirely suppressed after exposure to 0.5% ethanol, 50 µM chlorpyrifos, and 25 mg/l TritonX-100 (dark gray bars in Fig. 6C). In addition, we found that this behavior was impaired but not entirely suppressed after exposure to 55 µM glucose, 2% methanol, and 1 mg/l SDS (light gray bars in Fig. 6C).
FIG. 6.

Temperature sensing assay. A, Wild-type worms (n = 20) density heatmap over a 10-min course in the absence or B, presence of a thermal gradient. Black dotted line shows the area of the cold spot in the center of the dish and gray levels indicate higher worm density in that region in presence of the gradient. Scale bar: 1 cm. C, Thermotaxis coefficient for worm populations (n = 20 for each) exposed to different toxicants. The black dotted lines indicate the level of absence of any reaction (thermotaxis coefficient of 1) and the lowest measurement of 3 control populations. The different conditions are further classified based on these 2 cutoffs as normal thermotaxis (white bars), impaired thermotaxis (light gray bars) and no thermotaxis (dark gray bars).
Of these 6 toxicants, 4 (ethanol, methanol, chlorpyrifos, and TritonX-100) were already shown to induce large-scale defects in brain morphology (Fig. 5), likely explaining this impaired behavior. However, the structural defects induced by DMSO, permethrin, and acrylamide did not impair thermotaxis and, therefore, are likely targeted at different neuronal populations, not involved in this type of behavior. Finally, at the tested concentrations, neither glucose nor SDS induced visible changes in brain morphology but still impaired thermotaxis. This effect of glucose could potentially be explained by its role in the insulin pathway which has been shown to play a role in thermotaxis and memory in C. elegans (Li et al., 2013). In addition, both glucose and SDS were found to have effects on locomotion (Fig. 3) which could also alter the worms’ thermotactic response which, ultimately, requires proper motility.
Overall, these results show how planarians can be used in large scale, population experiments which, in concordance with our other assays, reveal subtler effects on neuronal functions. In the future, similar tests could be conducted using the worm’s photo- or chemo-tactic responses which require different neuronal subpopulations to further refine the neurotoxicity profiles of various toxicants.
DISCUSSION
As shown in Fig. 7, all the tested toxicants displayed some form of toxicity demonstrated through either unstimulated or stimulated behavior, regeneration dynamics, or brain structure indicating that planarians are an appropriately sensitive animal model for toxicology studies. Importantly, the tested toxicants displayed differential toxicity with different levels of effect on the various endpoints, suggesting these endpoints are specific to various types of toxicity, ranging from general physiological toxicity (regeneration dynamics) to toxicity toward specific neuronal subpopulations (thermotaxis).
FIG. 7.

Effect and potency of all toxicants on 10 quantitative endpoints: LC50 for full and regenerating worms at 4 different time points, mean scaled gliding speeds for full and regenerating worms, blastema growth rate, eye regeneration, brain structure for full and regenerating worms and, finally, proper thermotaxis. The colorbar represents potency defined as –log10 (LOEL in µM) (see “Materials and Methods” section), whereas white squares are used when no effects were detected.
Moreover, comparison with other toxicology model organisms, such as zebrafish and nematodes, shows that planarians generally displayed comparable sensitivity to the tested toxicants, with LC50 and LOEL values on the same order of magnitude (Tables 3 and 4). However, species-specific differences in sensitivity do exist, most strikingly in the case of permethrin. Although, in terms of lethality, planarians were 1000-fold less sensitive than zebrafish to permethrin, it has been shown that fish are particularly sensitive to pyrethroid exposure, with a 1000-fold higher sensitivity than mammals (Bradbury and Coats, 1989). This emphasizes the need for a comparative analysis of toxicology across diverse model organisms to better represent possible effects on humans and to find the appropriate threshold concentrations.
TABLE 3.
Comparison of LC50 Values for Planarians With Zebrafish And Nematodes
| Chemical | Full planarians | Regenerating planarians | Zebrafish | Nematodes | References |
|---|---|---|---|---|---|
| DMSO | 4.13% | 5.03% | 1.8–2.5% | Bichara et al. (2014) and Maes et al. (2012) | |
| Permethrin | 384 µM | 609 µM | 800 nM | DeMicco et al. (2010) | |
| Chlorpyrifos | 177 µM | 209 µM | 1 µM | 2.76 µM | Roh and Choi (2008) and Watson et al. (2014) |
| Dichlorvos | 1.92 µM | 3.40 µM | 17 µM | 39 µM | Rajini et al. (2008) and Watson et al. (2014) |
| Ethanol | 0.9% | 1.34% | 1.2% | 5% | Bichara et al. (2014) and Yu et al. (2011) |
| Methanol | 5.18% | 5.63% | |||
| SDS | 2.26 mg/l | 1.57 mg/l | 16.1 mg/l | Bichara et al. (2014) | |
| TritonX-100 | 31 mg/l | 39 mg/l | |||
| Acrylamide | 785 µM | 904 µM | approximately 6.25 mM | 3.4 mM | Fei et al. (2010) and Li et al. (2015) |
| Glucose | 105 mM | 125 mM |
LC50 values of 8 day full and regenerating planarians, from Table 2, are compared with values found in zebrafish larvae and nematodes. When necessary, concentrations were converted for better comparison.
TABLE 4.
Comparison of LOEL Values of Tested Chemicals in Planarians with in Zebrafish And Nematodes
| Chemical | Planarians | Zebrafish | Nematodes | References |
|---|---|---|---|---|
| DMSO | 1% | 0.01–2% | 1% | Chen et al. (2011), Maes et al. (2012), Selderslaghs et al. (2009), and Sprando et al. (2009) |
| Permethrin | 20 µM | 130 nM | DeMicco et al. (2010) | |
| Chlorpyrifos | 1 µM | 0.01–0.1 µM | 0.029 µM | Richendrfer et al. (2012), Roh and Choi (2008), and Watson et al. (2014) |
| Dichlorvos | 10 nM | 0.1 µM | 1.2 nM | Rajini et al. (2008) and Watson et al. (2014) |
| Ethanol | 0.05% | 0.01–1% | 0.1% | Chen et al. (2011), Chromcova et al. (2012), Dhawan et al. (1999), and Maes et al. (2012) |
| Methanol | 0.8% | 1% | 2% | Chromcova et al. (2012), Katiki et al. (2011), and Maes et al. (2012) |
| SDS | 0.2 mg/l | 6.4 nM (approximately 1.8 mg/l) | Truong et al. (2014) | |
| TritonX-100 | 5 mg/l | |||
| Acrylamide | 100 µM | 141 µM | Li et al. (2015) | |
| Glucose | 55 µM | > 55 mM | 250 mM | Mondoux et al. (2011) and Selderslaghs et al. (2009) |
LOEL determined as the lowest concentration which elicited a statistically significant effect compared with controls. When necessary, concentrations were converted for better comparison.
Species-related sensitivities may reflect differences in toxicokinetics in these different animal models, including toxicant uptake and metabolism. In planarians, the toxicants reach their target tissue by absorption through the skin and diffusion; however, future studies are needed to precisely determine the amount of chemicals taken up and processed by the animal.
In summary, we have shown that the freshwater planarian D. japonica is a suitable alternative animal model for developmental neurotoxicology. Although planarians do not have the morphological richness of zebrafish larvae (Truong et al., 2014), thus limiting morphological readouts, they have other unique features that make them a relevant model system: (1) the ability to test adult and developing animals, in parallel, allows us unprecedented insight into development specific effects of toxicants whose molecular and cellular basis remains to be explored in mechanistic studies and (2) because planarians are invertebrates but still possess significant neuronal complexity and homology to the human brain (Buttarelli et al., 2008), they allow us to conduct MTS studies to assess the toxicity of new compounds in a relevant context without the ethical dilemma that comes from working with vertebrate animals. To achieve the necessary throughput and specificity, our current assay clearly needs to be modified in 2 ways: (1) the different manual components must be integrated into an automated plate handling and scoring platform, and (2) additional readouts, eg, phototaxis, chemotaxis, etc., must be added to the screen and quantitatively evaluated. Now that we have established the suitability of freshwater planarians as an animal model for developmental neurotoxicology, we plan on starting this second phase of system development.
SUPPLEMENTARY DATA
Supplementary data are available online at http://toxsci.oxfordjournals.org/.
FUNDING
National Institutes of Health Cell and Molecular Genetics Training Grant (5T32GM007240-37 to D.H.); Hellman Foundation (to E.-M.S.C.); Burroughs Wellcome Fund CASI award (to E.-M.S.C.); Alfred P. Sloan Fellowship (to E.-M.S.C.).
Supplementary Material
ACKNOWLEDGMENTS
The authors thank the following undergraduate students (Mary B. Tamme, M. Phuong Truong, Innkyu Moon, Jannet Cardin, David Duplantier, Yingtian He) and high school student (Milena Chakraverti-Wuerthwein) who helped with feeding, cleaning, and imaging worms, running some assays, and analyzing imaging data, and Angel Leu for help with IHC. The anti-SYNORF1 antibody developed by Erich Buchner was obtained from the Developmental Studies Hybridoma Bank, created by the NICHD of the NIH, and maintained at The University of Iowa, Department of Biology, Iowa City.
Glossary
Abbreviations
- HTS
high-throughput screening
- MTS
medium-throughput screening
- DMSO
dimethyl sulfoxide
- SDS
sodium dodecyl sulfate
- COM
center of mass
- fps
frames per second
- IHC
immunohistochemistry
- LOEL
lowest observed effect level
REFERENCES
- Abel P. D. (1974). Toxicity of synthetic detergents to fish and aquatic invertebrates. J. Fish Biol. 6, 279–298. [Google Scholar]
- Amitai G., Moorad D., Adani R., Doctor B. P. (1998). Inhibition of acetylcholinesterase and butyrylcholinesterase by chlorpyrifos-oxon. Biochem. Pharmacol. 56, 293–299. [DOI] [PubMed] [Google Scholar]
- Bichara D., Calcaterra N. B., Arranz S., Armas P., Simonetta S. H. (2014). Set-up of an infrared fast behavioral assay using zebrafish (Danio rerio) larvae, and its application in compound biotoxicity screening. J. Appl. Toxicol. 34, 214–219. [DOI] [PubMed] [Google Scholar]
- Bjørling-Poulsen M., Andersen H. R., Grandjean P. (2008). Potential developmental neurotoxicity of pesticides used in Europe. Environ. Health 7, 50. [DOI] [PMC free article] [PubMed] [Google Scholar]
- Boyd W., Smith M., Freedman J. (2012). Caenorhabditis elegans as a model in developmental toxicology. In Developmental Toxicology (Harris C., Hansen J. M., Eds.), pp. 15–24. Humana Press, New York City, USA. [DOI] [PMC free article] [PubMed] [Google Scholar]
- Bradberry S. M., Cage S. A., Proudfoot A. T., Vale J. A. (2005). Poisoning due to pyrethroids. Toxicol. Rev. 24, 93–106. [DOI] [PubMed] [Google Scholar]
- Bradbury S. P., Coats J. R. (1989). Comparative toxicology of the pyrethroid insecticides. Rev. Environ. Contam. Toxicol. 108, 133–177. [DOI] [PubMed] [Google Scholar]
- Buttarelli F. R., Pellicano C., Pontieri F. E. (2008). Neuropharmacology and behavior in planarians: Translations to mammals. Comp. Biochem. Physiol. Toxicol. Pharmacol. 147, 399–408. [DOI] [PubMed] [Google Scholar]
- Cebrià F. (2007). Regenerating the central nervous system: How easy for planarians! Dev . Genes Evol. 217, 733–748. [DOI] [PubMed] [Google Scholar]
- Cebrià F., Newmark P. A. (2005). Planarian homologs of netrin and netrin receptor are required for proper regeneration of the central nervous system and the maintenance of nervous system architecture. Development 132, 3691–3703. [DOI] [PubMed] [Google Scholar]
- Cebrià F., Nakazawa M., Mineta K., Ikeo K., Gojobori T., Agata K. (2002). Dissecting planarian central nervous system regeneration by the expression of neural-specific genes. Dev. Growth Differ. 44, 135–146. [DOI] [PubMed] [Google Scholar]
- Chen T.-H., Wang Y.-H., Wu Y.-H. (2011). Developmental exposures to ethanol or dimethylsulfoxide at low concentrations alter locomotor activity in larval zebrafish: Implications for behavioral toxicity bioassays. Aquat. Toxicol. 102, 162–166. [DOI] [PubMed] [Google Scholar]
- Chromcova L., Stepanova S., Plhalova L., Praskova E., Svobodova Z. (2012). Effect of four selected carrier solvents on embryonal stages of Danio rerio. Neuro Endocrinol. Lett. 33(Suppl. 3), 60–65. [PubMed] [Google Scholar]
- Collins F. S., Gray G. M., Bucher J. R. (2008). Toxicology. Transforming environmental health protection. Science 319, 906–907. [DOI] [PMC free article] [PubMed] [Google Scholar]
- DeMicco A., Cooper K. R., Richardson J. R., White L. A. (2010). Developmental neurotoxicity of pyrethroid insecticides in zebrafish embryos. Toxicol. Sci. 113, 177–186. [DOI] [PMC free article] [PubMed] [Google Scholar]
- Dhawan R., Dusenbery D. B., Williams P. L. (1999). Comparison of lethality, reproduction, and behavior as toxicological endpoints in the nematode Caenorhabditis elegans. J. Toxicol. Environ. Health. A 58, 451–462. [DOI] [PubMed] [Google Scholar]
- Dong Z., Yuwen Y., Wang Q., Chen G., Liu D. (2012). Eight genes expression patterns during visual system regeneration in Dugesia japonica. Gene Expr. Patterns 12, 1–6. [DOI] [PubMed] [Google Scholar]
- Dunkel J., Talbot J., Schötz E.-M. (2011). Memory and obesity affect the population dynamics of asexual freshwater planarians. Phys. Biol. 8, 026003. [DOI] [PubMed] [Google Scholar]
- Erdfelder E., Faul F., Buchner A. (1996). GPOWER: A general power analysis program. Behav. Res. Methods Instrum. Comput. 28, 1–11. [Google Scholar]
- Fei X.-C., Song C., Gao H.-W. (2010). Transmembrane transports of acrylamide and bisphenol A and effects on development of zebrafish (Danio rerio). J. Hazard. Mater. 184, 81–88. [DOI] [PubMed] [Google Scholar]
- Inoue T., Yamashita T., Agata K. (2014). Thermosensory signaling by TRPM is processed by brain serotonergic neurons to produce planarian thermotaxis. J. Neurosci. 34, 15701–15714. [DOI] [PMC free article] [PubMed] [Google Scholar]
- Judson R. S., Houck K. A., Kavlock R. J., Knudsen T. B., Martin M. T., Mortensen H. M., Reif D. M., Rotroff D. M., Shah I., Richard A. M., et al. (2010). In vitro screening of environmental chemicals for targeted testing prioritization: The ToxCast project. Environ. Health Perspect. 118, 485–492. [DOI] [PMC free article] [PubMed] [Google Scholar]
- Katiki L. M., Ferreira J. F. S., Zajac A. M., Masler C., Lindsay D. S., Chagas A. C. S., Amarante A. F. T. (2011). Caenorhabditis elegans as a model to screen plant extracts and compounds as natural anthelmintics for veterinary use. Vet. Parasitol. 182, 264–268. [DOI] [PubMed] [Google Scholar]
- Knight A. W., Little S., Houck K., Dix D., Judson R., Richard A., McCarroll N., Akerman G., Yang C., Birrell L., et al. (2009). Evaluation of high-throughput genotoxicity assays used in profiling the US EPA ToxCast chemicals. Regul. Toxicol. Pharmacol. 55, 188–199. [DOI] [PubMed] [Google Scholar]
- Li J., Li D., Yang Y., Xu T., Li P., He D. (2015). Acrylamide induces locomotor defects and degeneration of dopamine neurons in Caenorhabditis elegans. J. Appl. Toxicol. doi: 10.1002/jat.3144. [DOI] [PubMed] [Google Scholar]
- Li M.-H. (2008). Effects of nonionic and ionic surfactants on survival, oxidative stress, and cholinesterase activity of planarian. Chemosphere 70, 1796–1803. [DOI] [PubMed] [Google Scholar]
- Li Y., Zhao Y., Huang X., Lin X., Guo Y., Wang D., Li C., Wang D. (2013). Serotonin control of thermotaxis memory behavior in nematode Caenorhabditis elegans. PLoS One 8, e77779. [DOI] [PMC free article] [PubMed] [Google Scholar]
- LoPachin R. M. (2004). The changing view of acrylamide neurotoxicity. Neurotoxicology 25, 617–630. [DOI] [PubMed] [Google Scholar]
- Lowe J. R., Mahool T. D., Staehle M. M. (2015). Ethanol exposure induces a delay in the reacquisition of function during head regeneration in Schmidtea mediterranea. Neurotoxicol. Teratol. 48, 28–32. [DOI] [PubMed] [Google Scholar]
- Maes J., Verlooy L., Buenafe O. E., de Witte P. A. M., Esguerra C. V., Crawford A. D. (2012). Evaluation of 14 organic solvents and carriers for screening applications in zebrafish embryos and larvae. PLoS One 7, e43850. [DOI] [PMC free article] [PubMed] [Google Scholar]
- Mannini L., Rossi L., Deri P., Gremigni V., Salvetti A., Saló E., Batistoni R. (2004). Djeyes absent (Djeya) controls prototypic planarian eye regeneration by cooperating with the transcription factor Djsix-1. Dev. Biol. 269, 346–359. [DOI] [PubMed] [Google Scholar]
- Mineta K., Nakazawa M., Cebria F., Ikeo K., Agata K., Gojobori T. (2003). Origin and evolutionary process of the CNS elucidated by comparative genomics analysis of planarian ESTs. Proc. Natl. Acad. Sci. U. S. A. 100, 7666–7671. [DOI] [PMC free article] [PubMed] [Google Scholar]
- Mondoux M. A., Love D. C., Ghosh S. K., Fukushige T., Bond M., Weerasinghe G. R., Hanover J. A., Krause M. W. (2011). O-linked-N-acetylglucosamine cycling and insulin signaling are required for the glucose stress response in Caenorhabditis elegans. Genetics 188, 369–382. [DOI] [PMC free article] [PubMed] [Google Scholar]
- Pagán O. R., Rowlands A. L., Urban K. R. (2006). Toxicity and behavioral effects of dimethylsulfoxide in planaria. Neurosci. Lett. 407, 274–278. [DOI] [PubMed] [Google Scholar]
- Parng C., Roy N. M., Ton C., Lin Y., McGrath P. (2007). Neurotoxicity assessment using zebrafish. J. Pharmacol. Toxicol. Methods 55, 103–112. [DOI] [PubMed] [Google Scholar]
- Parzefall W. (2008). Minireview on the toxicity of dietary acrylamide. Food Chem. Toxicol. 46, 1360–1364. [DOI] [PubMed] [Google Scholar]
- Peterson R. T., Nass R., Boyd W. A., Freedman J. H., Dong K., Narahashi T. (2008). Use of non-mammalian alternative models for neurotoxicological study. Neurotoxicology 29, 546–555. [DOI] [PMC free article] [PubMed] [Google Scholar]
- Rajini P. S., Melstrom P., Williams P. L. (2008). A comparative study on the relationship between various toxicological endpoints in Caenorhabditis elegans exposed to organophosphorus insecticides. J. Toxicol. Environ. Health. A 71, 1043–1050. [DOI] [PubMed] [Google Scholar]
- Reddien P. W. (2013). Specialized progenitors and regeneration. Development 140, 951–957. [DOI] [PMC free article] [PubMed] [Google Scholar]
- Reddien P. W., Sánchez Alvarado A. (2004). Fundamentals of planarian regeneration. Annu. Rev. Cell Dev. Biol. 20, 725–757. [DOI] [PubMed] [Google Scholar]
- Richendrfer H., Pelkowski S. D., Colwill R. M., Créton R. (2012). Developmental sub-chronic exposure to chlorpyrifos reduces anxiety-related behavior in zebrafish larvae. Neurotoxicol. Teratol. 34, 458–465. [DOI] [PMC free article] [PubMed] [Google Scholar]
- Rink J. C. (2013). Stem cell systems and regeneration in planaria. Dev. Genes Evol. 223, 67–84. [DOI] [PMC free article] [PubMed] [Google Scholar]
- Roh J.-Y., Choi J. (2008). Ecotoxicological evaluation of chlorpyrifos exposure on the nematode Caenorhabditis elegans. Ecotoxicol. Environ. Saf. 71, 483–489. [DOI] [PubMed] [Google Scholar]
- Sakurai T., Lee H., Kashima M., Saito Y., Hayashi T., Kudome-Takamatsu T., Nishimura O., Agata K., Shibata N. (2012). The planarian P2X homolog in the regulation of asexual reproduction. Int. J. Dev. Biol. 56, 173–182. [DOI] [PubMed] [Google Scholar]
- Scimone M. L., Kravarik K. M., Lapan S. W., Reddien P. W. (2014). Neoblast specialization in regeneration of the planarian Schmidtea mediterranea. Stem Cell Reports 3, 339–352. [DOI] [PMC free article] [PubMed] [Google Scholar]
- Selderslaghs I. W. T., Van Rompay A. R., De Coen W., Witters H. E. (2009). Development of a screening assay to identify teratogenic and embryotoxic chemicals using the zebrafish embryo. Reprod. Toxicol. 28, 308–320. [DOI] [PubMed] [Google Scholar]
- Sipes N. S., Padilla S., Knudsen T. B. (2011). Zebrafish—As an integrative model for twenty-first century toxicity testing. Birth Defects Res. Part C Embryo Today Rev. 93, 256–267. [DOI] [PubMed] [Google Scholar]
- Sprando R. L., Olejnik N., Cinar H. N., Ferguson M. (2009). A method to rank order water soluble compounds according to their toxicity using Caenorhabditis elegans, a complex object parametric analyzer and sorter, and axenic liquid media. Food Chem. Toxicol. 47, 722–728. [DOI] [PubMed] [Google Scholar]
- Stevens A. S., Pirotte N., Plusquin M., Willems M., Neyens T., Artois T., Smeets K. (2014). Toxicity profiles and solvent-toxicant interference in the planarian Schmidtea mediterranea after dimethylsulfoxide (DMSO) exposure. J. Appl. Toxicol. 35, 319–326. [DOI] [PubMed] [Google Scholar]
- Talbot J., Schötz E.-M. (2011). Quantitative characterization of planarian wild-type behavior as a platform for screening locomotion phenotypes. J. Exp. Biol. 214, 1063–1067. [DOI] [PubMed] [Google Scholar]
- Tang J., Cao Y., Rose R. L., Brimfield A. A., Dai D., Goldstein J. A., Hodgson E. (2001). Metabolism of chlorpyrifos by human cytochrome P450 isoforms and human, mouse, and rat liver microsomes. Drug Metab. Dispos. 29, 1201–1204. [PubMed] [Google Scholar]
- Truong L., Reif D. M., St Mary L., Geier M. C., Truong H. D., Tanguay R. L. (2014). Multidimensional in vivo hazard assessment using zebrafish. Toxicol. Sci. 137, 212–233. [DOI] [PMC free article] [PubMed] [Google Scholar]
- Umesono Y., Tasaki J., Nishimura Y., Hrouda M., Kawaguchi E., Yazawa S., Nishimura O., Hosoda K., Inoue T., Agata K. (2013). The molecular logic for planarian regeneration along the anterior-posterior axis. Nature 500, 73–76. [DOI] [PubMed] [Google Scholar]
- Vliet E. V. (2011). Current standing and future prospects for the technologies proposed to transform toxicity testing in the 21st century. ALTEX 28, 17–44. [DOI] [PubMed] [Google Scholar]
- Wagner D. E., Wang I. E., Reddien P. W. (2011). Clonogenic neoblasts are pluripotent adult stem cells that underlie planarian regeneration. Science 332, 811–816. [DOI] [PMC free article] [PubMed] [Google Scholar]
- Watson F. L., Schmidt H., Turman Z. K., Hole N., Garcia H., Gregg J., Tilghman J., Fradinger E. A. (2014). Organophosphate pesticides induce morphological abnormalities and decrease locomotor activity and heart rate in Danio rerio and Xenopus laevis. Environ. Toxicol. Chem. 33, 1337–1345. [DOI] [PubMed] [Google Scholar]
- Yu X., Zhao W., Ma J., Fu X., Zhao Z. J. (2011). Beneficial and harmful effects of alcohol exposure on Caenorhabditis elegans worms. Biochem. Biophys. Res. Commun. 412, 757–762. [DOI] [PubMed] [Google Scholar]
- Yuan Z., Zhao B., Zhang Y. (2012). Effects of dimethylsulfoxide on behavior and antioxidant enzymes response of planarian Dugesia japonica. Toxicol. Ind. Health 28, 449–457. [DOI] [PubMed] [Google Scholar]
Associated Data
This section collects any data citations, data availability statements, or supplementary materials included in this article.