

Abstract
Motivation: The position-weight matrix (PWM) is a useful representation of a transcription factor binding site (TFBS) sequence pattern because the PWM can be estimated from a small number of representative TFBS sequences. However, because the PWM probability model assumes independence between individual nucleotide positions, the PWMs for some TFs poorly discriminate binding sites from non-binding-sites that have similar sequence content. Since the local three-dimensional DNA structure (‘shape’) is a determinant of TF binding specificity and since DNA shape has a significant sequence-dependence, we combined DNA shape-derived features into a TF-generalized regulatory score and tested whether the score could improve PWM-based discrimination of TFBS from non-binding-sites.
Results: We compared a traditional PWM model to a model that combines the PWM with a DNA shape feature-based regulatory potential score, for accuracy in detecting binding sites for 75 vertebrate transcription factors. The PWM + shape model was more accurate than the PWM-only model, for 45% of TFs tested, with no significant loss of accuracy for the remaining TFs.
Availability and implementation: The shape-based model is available as an open-source R package at that is archived on the GitHub software repository at https://github.com/ramseylab/regshape/.
Contact: stephen.ramsey@oregonstate.edu
Supplementary information: Supplementary data are available at Bioinformatics online.
1 Introduction
Binding of a transcription factor (TF) to its cognate binding site in DNA is a fundamental mechanism in gene regulation. Computational recognition of TF binding sites (TFBSs) within the noncoding genome is both a powerful source of mechanistic insights from gene expression data (Roth et al., 1998) and a central problem in bioinformatics. Experimentally, the binding sites for a TF can be mapped genome-wide using a ChIP-seq assay (Johnson et al., 2007), but applying ChIP-seq for each of the ∼2000 mammalian TFs or starting from rare cell populations is infeasible due to the need for high-affinity antibodies and/or due to the significant amount of chromatin required (Park, 2009). In comparison, in silico TFBS recognition is unmatched in terms of the breadth of potential TF regulators that can be simultaneously considered.
A cornerstone of computational strategies for TFBS recognition is the encoding of a TF’s binding site sequence pattern (learned from representative TFBS sequences) in a position-weight matrix (PWM) (Stormo et al., 1982; Staden, 1984). Uncharacterized noncoding DNA sequence is then scanned to identify high-scoring matches to the PWM, which are taken as probable TFBSs. The PWM is efficient for scanning, but as a standalone predictor it has high false-positive rates (Wasserman and Sandelin, 2004) because of the cell type- or condition-dependent local epigenetic state (Cuellar-Partida et al., 2012), limited representative binding sites for PWM estimation (Cartharius et al., 2005) and the fact that TF–TFBS affinity can depend on combinations of nucleotides within the site (Bulyk et al., 2002). Frameworks that are used to integrate such correlates include logistic regression (de Hoon et al., 2004), the support vector machine (Holloway et al., 2005), Bayesian networks (Chen et al., 2007), data fusion (Lähdesmäki et al., 2008), linear threshold model (Ramsey et al., 2010), hidden Markov model (Won et al., 2010) and Random Forest (Hooghe et al., 2012).
Extensions of PWM-based methods have been proposed that incorporate features that correlate with the probability that a basepair (bp) position coincides with a regulatory element (Ernst et al., 2010). Such correlates include phylogenetic conservation, (Elnitski et al., 2003), TFBS co-localization (Sinha et al., 2006), nucleosome positioning (Segal et al., 2006), histone acetylation (Vettese-Dadey et al., 1996), motif conservation and TFBS co-localization (Xie et al., 2008) and chromatin signatures (Pique-Regi et al., 2011). Methods that directly incorporate a PWM are valuable because for many TFs, a PWM is available but representative binding site sequences in the genome are not, such as for PWMs obtained from protein-binding arrays (Berger et al., 2006) or from structural modeling of the protein–DNA complex (Contreras-Moreira, 2010).
A new potential correlate, local DNA ‘shape,’ is suggested by the demonstration that TF binding site specificity depends on the sequence-dependent, three-dimensional shape of DNA (Rohs et al., 2009). Improvements in Monte Carlo-based modeling and in molecular dynamics-based modeling of DNA structure have enabled the development of DNAShape, a model that predicts local structural shape parameters for the DNA double helix (in a standardized reference frame and coordinate system; Lavery and Sklenar, 1988) from sliding pentamer DNA subsequences (Zhou et al., 2013).
Here, we report the development of a classifier (‘DNA shape classifier’) for predicting whether a short (8–32 bp) DNA sequence from the noncoding genome is a TFBS for any TF, or whether it is a non-binding-site sequence. This generic classifier is based on a novel procedure—described herein—for extracting sequence length-independent features from bp-level DNA shape parameters within the binding site. We then combined the DNA shape classifier score with the TF-specific PWM log-likelihood score (Claverie and Audic, 1996) into an integrated model for TFBS prediction. Importantly, beyond the dependence of the PWM on representative binding site sequences, the model does not require any TF-specific training or parameter estimation. We compared the accuracy of the PWM+shape model versus a PWM-only model for discriminating TF-specific binding sites within noncoding promoter model sequences, and we found that the shape classifier improved the positive predictive value (PPV) for TFBS recognition, for 34 out of the 75 TFs that we tested; for the remaining TFs, the PPV of the PWM+shape model was not significantly lower than that of the PWM model.
2 Methods
2.1 TFBS and noncoding sequences
Representative binding site sequences St for each vertebrate TF t {1,...,75} (|St| ≥ 45, t, and 11 200) were obtained from the JASPAR (release 5.0) and TFBSShape (Yang et al., 2014) databases. For identifying non-regulatory genomic regions within 5 kb of transcription start sites, PeakSeq-processed (Rozowsky et al., 2009) peak files in UCSC BED format for 457 human ChIP-seq experiments (spanning 119 TFs and 77 cell types) were obtained from the January 2011 data release of the ENCODE Project (Gerstein et al., 2012). A BED feature file of all regions of noncoding DNA in the human genome within ±5 kb of transcription start sites (TSSs) of all RefSeq NM transcripts was constructed from exon, transcript, and UTR features obtained from Ensembl release 74 (GRCh37 assembly). All TFBS peaks were combined (basepair-level union) into a single feature file that was used to mask the noncoding regions to obtain a feature file of all noncoding, TFBS-depleted, TSS-proximal (‘NCTDTP’) regions. DNA sequence was obtained for the NCTDTP feature file (‘NCTDTP sequences’) using the UCSC Genome Browser (GRCh37.p10). Unknown (i.e. ‘N’) basepairs were treated as sequence gaps. For TFBS recognition for a TF with a PWM of length l (which ranged from 8 to 32 bp over the set of 75 TFs), the length l sequences from the core of the multiply aligned set of representative binding sites for the TF was used as the positive set of cases and as negative cases we used length-l subsequences from the NCTDTP sequences (sampled as described in Section 2.3).
2.2 Quantification of local DNA shape of TFBS
Non-gap-spanning pentamer subsequences were obtained for each TFBS or NCTDTP sequence (for the latter, pentamers were sampled, see Section 2.3). Using the DNAShape model, absolute shape parameters were obtained for the central bp of each pentamer (propeller twist = ProT, minor groove width = MGW) and for the shape changes between central basepairs of two pentamer sequences that are shifted by one bp (helix twist = HelT, roll; ‘stepped’ parameters). Because binding site PWMs for different TFs have different bp lengths, bp-level shape parameter values for each TFBS sequence were reduced to length-independent summary statistics. Specifically, from the l – 3 values for a ‘stepped’ shape parameter for a sequence of length l (or l – 4 values for an ‘absolute’ shape parameter), five l-independent features were extracted, as shown in Figure 1A: (‘max value’, ‘min value’, ‘max width’, ‘max height’ and ‘average’). [Features are defined as follows: ‘max value’ indicates the maximum value for the shape parameter over all bp in the sequence, ‘min value’ indicates the minimum value, ‘max width’ is the maximum number of base pairs covered by one peak. ‘max length’ is a feature describing the maximum difference between peak and bottom, ‘average’ is the average parameter value for this sequence.] Thus, each sequence was reduced to 20 shape summary values.
Fig. 1.

Outline of DNA shape-based features, TF-general binding site classifier performance, and structure of PWM+shape model. (A) The five DNA shape parameter-based features. (B) Performance comparison for three classifiers for discriminating TFBS sequences (in general, not specific to a particular TF) from non-binding-site, noncoding sequences (see Section 2.3). SVM, support vector machine (Vapnik et al., 1996); AUC, area under the sensitivity versus False-positive error rate curve (i.e. ‘ROC curve’); ADA, additive logistic regression (Friedman et al., 2000). AUC of an unbiased random classifier would be 0.5. (C) Data integration strategy
2.3 DNA shape-based regulatory sequence classifier
A local DNA shape-based classifier was developed for discriminating short (8–32 bp) TFBS sequences (of any kind) from short non-TFBS, noncoding, TSS-proximal sequences. A set of 10 000 representative binding site sequences across all 75 TFs was used as the universal set of positive cases, and a universal set of 10 000 negative cases was obtained from sequences (non-gapped, and with equal length distribution to the positive cases) that were sampled from random locations and strand orientations from the NCTDTP sequence file. For each case, 20 sequence length-independent, local DNA shape-based feature values were obtained (see Section 2.2). The positive and negative cases were each randomly divided into training (1/2) and test (1/2) sets. An ensemble decision tree classifier [Random Forest (Breiman, 2001), with 500 trees and four features/tree] was trained on the training case features. The ensemble classifier’s voting fraction f(s) was used as a DNA shape-based regulatory score (‘shape score’) for each sequence s. Random Forest was selected because it outperformed (by area under the sensitivity versus false-positive rate curve) the other supervised classifiers (support vector machine with radial basis kernel; additive boosted logistic regression) tested on this dataset (Fig. 1B). For performance evaluation of the TF-specific, integrated (PWM + shape) TFBS recognition model (Section 2.5), the shape-based classifier was trained for each TF while excluding all representative binding site sequences for that TF from the training dataset. The test cases were used for evaluating the TF-specific, PWM-based TFBS recognition models (Section 3), and the twofold cross-validation procedure was repeated 20 times to obtain samples of method performance. The source code for the shape score classifier, including the trained Random Forest decision trees on which it is based, are available as an open-source R software package entitled regshape, that can be downloaded and installed within an interactive R session as shown:
> install.packages(“devtools”)
> library(devtools)
> install_github(“ramseylab/regshape”, local=TRUE, build_vignettes=TRUE)
Complete installation instructions and usage instructions are provided in the online supplementary material.
2.4 PWM scoring and threshold determination
For each TF, the multiple alignment for the positive test cases (representative binding site sequences) corresponding to that TF (Section 2.3) were compiled into a l × 4 position probability matrix (PPM) W (of ‘length’ l), for which each element denotes the probability of observing nucleotide (representing {A,C,G,T}) in position of a binding site for the TF, estimated from positional nucleotide counts with a pseudocount of 0.8. By definition, . ‘Background’ nucleotide frequencies were compiled from the NCTDTP sequences. Following (Claverie and Audic, 1996), the PWM score S(W,s) for a string of length given PPM W is defined by , where is the base of . The 0.9998 quantile value [denoted by θ(W)] of the PWM score distribution on negative-case sequences (each of length l) from the training set, was used as the score threshold. Thus, a threshold-exceeding PWM score would be encountered on average once per 2.5 kb in sliding-window, double-stranded PWM scanning of the NCTDTP sequences.
2.5 Integrated predictions; performance evaluation
For a given TF with PPM W of length l and a given sequence s of length l, two models were used to predict whether s is a binding site for the TF or not: in the ‘PWM-only’ model, the sequence s is predicted to be a binding site if and only if its PWM score S(W,s) exceeds the threshold θ(W) that was estimated from the distribution of PWM scores from a set of sequences of length l from the NCTDTP (Section 2.4). In the ‘PWM+shape’ model, which does not require training, the voting fraction f(s) for the sequence is obtained from the regulatory score classifier (Section 2.3), and the sequence s is predicted to be a binding site if and only if both S(W,s) > θ(W) and f(s) > 0.5 (Fig. 1C). As a negative control, a random model was used in which the DNA shape score was sampled from the uniform distribution on [0,1].
To enable exploration of the models’ TFBS recognition performances on sets of positive and negative cases (l-mer sequences) with varying degrees of overlap of their PWM score distributions, the negative case sequences were composed of two sets—a ‘low’ set of l-mer subsequences selected at random NCTDTP sequence locations, and a ‘high’ set of l-mer subsequences of NCTDTP with high PWM scores (exceeding θ(W)). The ratio r of the size of the ‘low’ set to the size of the ‘high’ set was varied between r = 4 (meaning 20% of negative cases had ‘high’ PWM scores) and r = 10 000 (meaning ∼0.01% of negative cases had ‘high’ PWM scores). The negative case set composition approach is diagrammed in. Figure 2.
Fig. 2.

Procedure for constructing sets of positive and negative cases for performance evaluation in Experiment 1 (see Section 3.1). Here, cases correspond to PWM-length oligonucleotide sequences sampled from representative binding sites and from non-binding-site, noncoding sequence (see Section 2.1)
For the model promoter analysis, 100 bp subsequences of the NCTDTP were sampled at random locations and in random orientations (without replacement), and concatenated to produce Nt sequences, each of length 1 kb. For each TF t, Nt of the 1 kb sequences were selected [where Nt = min(|St|, 450)] and Nt representative TFBS sequences were sampled from the test set (without replacement) and overwritten (one TFBS per sequence) into the Nt one-kilobase sequences at random positions.
3 Results
For each of the TFs, representative binding site sequences were obtained (from databases compiled from high-throughput studies; Section 2.1) and partitioned into equal-sized training and test sets. From the training-set TFBS sequences, a PWM was estimated for each TF (Section 2.4). For each l × 4 PWM W, a score threshold θ(W) was obtained from the distribution of PWM match scores S(W,s) of a training set of 10 000 l-mer subsequences of noncoding, non-TFBS, TSS-proximal DNA (NCTDTP; Section 2.4). For each sequence s, a score f(s) [0, 1] representing the TF-generic, DNA shape-based regulatory score, was obtained using a random forest classifier; the classifier was trained on features extracted from local DNA shape parameters corresponding to test-case DNA sequences (Section 2.2). The PWM + shape model was then compared to the PWM-only model for TFBS recognition (Section 2.5) on both PWM-length sequences (Experiment 1) and on in silico promoter sequences into which test-set representative TFBS sequences were overwritten at random locations (Experiment 2).
3.1 Experiment 1: PWM-length sequences
For each 4 × l PWM, the performance of the PWM + shape model was compared to the PWM-only model using test-set l-mer sequences (i.e. sequences that were not included in the classifier training; Section 2.3). The test-set sequences comprised (1) half the representative binding sites for the TF (positive cases) and (2) 10 000 l-mer subsequences of noncoding, non-TFBS, TSS-proximal DNA (NCTDTP, negative cases) of which 8 000 were sampled at random locations in the NCTDTP sequence, and 2 000 were ‘chance occurrences of PWM matches’ selected from among l-mer subsequences of the NCTDTP that had PWM scores exceeding θ(W). The performance of the two models for discriminating positive and negative test-set cases was assessed using a per-sequence positive predictive value statistic (PPV = TP/(TP + FP); TP = true-positive cases, FPs = false-positive cases). Because the more discriminating model (PWM + shape) is expected to have a lower FP rate than the PWM-only model, the PWM-only model was also compared to a combined model using random scores from the DNA shape classifier (‘PWM + random’; Section 2.5).
For 53 out of 73 (i.e. 72%) of TFs tested, the PWM + shape model had a higher average PPV than the PWM-only model (Fig. 3; Welch’s t-test with α = 0.05), whereas there was negligible difference in PPV between the PWM + random model and the PWM-only model. As expected, the per-sequence PPVs of the PWM + shape model and the PWM-only model were indistinguishable when the negative-case set of test sequences was entirely selected at random from the NCTDTP (i.e. when chance high-scoring matches occurred at their empirical background frequency; Supplementary Fig. S1); for the case of high-scoring matches occurring at their background frequency, a per-promoter PPV is a more useful measure of TFBS recognition performance, as described in Section 3.2.
Fig. 3.

Combined PWM+shape model improves PPV for discriminating TFBS from non-binding-site sequences, over the PWM-only model, for 53 out of 73 TFs. Bars, standard error (SE, N = 20). Asterisk denotes rejection of null hypothesis of equal means, with α = 0.05 (Welch’s t-test)
3.2 Experiment 2: in silico promoter analysis
To assess the relative performance of the PWM + shape and PWM-only models for TFBS recognition on a promoter-wide basis, Nt noncoding sequences, each 1 kb in length, were sampled from NCTDTP sequences (Section 2.5). For each TF t (whose PWM length is denoted by l), 45 ≤ Nt ≤ 450 representative sequences were randomly selected from the test set of TFBS and were overwritten into an equal number of the one-kilobase sequences at random positions and orientations (one TFBS per kb sequence; Section 2.5; Fig. 4A). In this manner, sets of Nt ‘TFBS-containing’ (positive) and Nt NCTDTP (negative) in silico promoter sequences were obtained, each containing 2(1000 – l + 1) subsequences for which PWM scores and DNA shape classifier scores were obtained (Section 2.3, 2.4). For each in silico promoter sequence pj (where j {1,…, 2 Nt} identifies the in silico promoter), the promoter-level PPV, denoted PPV(pj), was computed across all 2(1000 – l + 1) subsequences (including the reverse complement), where each subsequence was treated as an individual classification case.
Fig. 4.
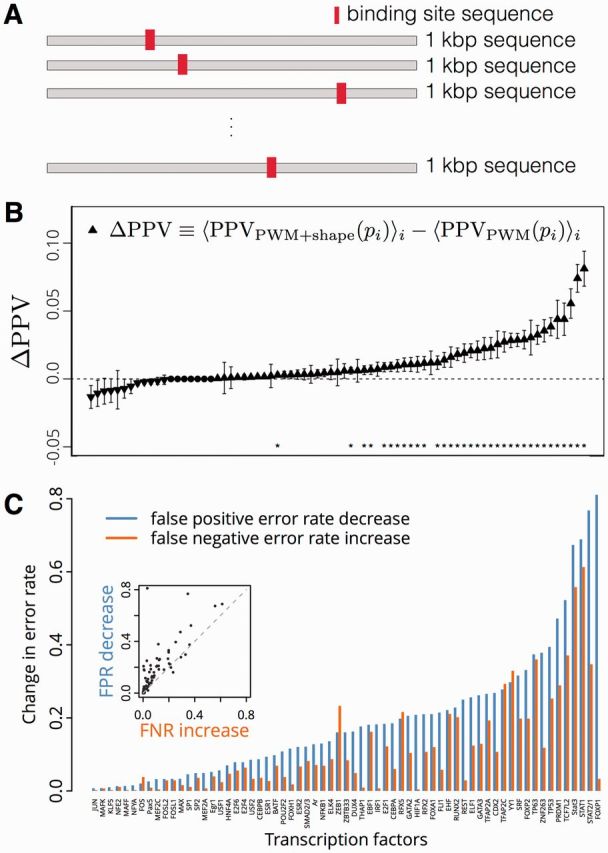
(A) Diagram of the in silico promoter model for TFBS recognition. (B) Combined PWM+shape model improves average PPV for detection of TFBS within 1 kb in silico promoters, versus a PWM-only model, for 34 out of the 75 TFs that were tested. Bars, SE (90 ≤ N ≤ 900 for each). Asterisk denotes rejection of null hypothesis of equal means, with α = 0.05 (Welch’s t-test). (C) The difference in error rates between the PWM+shape model and the PWM-only model shows that filtering by DNA shape decreases type I error more than it increases type II error, for sequence-based recognition of TFBS. (Inset: scatter plot of same data show on the bar-plot)
For each TF, the overall performance of each model (PWM + shape and PWM-only) was computed by averaging across the in silico promoters, i.e. by computing . The PWM + shape model had a higher average PPV than the PWM-only model (at P < 0.05, Welch's t-test), for 34 out of the 75 TFs that were analyzed (Fig. 4B); in no case did the PPV have a statistically significant reduction in the PWM + shape versus PWM-only model. To quantify the trade-off between sensitivity and specificity in the PWM + shape versus PWM-only model, for each TF (PWM length = l), the sensitivity and false-positive error rate for TFBS classification was computed across all l-subsequences of all of the in silico promoters. For the median over all 75 TFs, the false-positive error rate for the PWM + shape method was 12.1% lower than for the PWM-only method, while the sensitivity of the PWM + shape method was only 5.8% less than the PWM-only method (Fig. 4C, Supplementary Fig. S2; Table S1).
3.3 Example of DNA shape association with TFBS
A fundamental limitation of the PWM model is that the nucleotide probabilities at each nucleotide position within the PWM are independent of those in the other nucleotide positions. Thus, the PWM cannot accurately model TF-DNA binding that depends on specific nucleotide combinations at two or more positions within the binding site. In contrast to the PWM, local DNA shape in general depends on combinations of nucleotides at nearby positions. Thus, the DNA shape score can capture multi-base dependencies within a binding site sequence that can affect physical proximity to DNA-contacting residues of a TF. For example, the PWM of TF Znf263 has a purine-rich 3′ region (positions 19–21; Fig. 5A). The frequency at which sequence ‘AAA’ appears in the flanking positions 19–21 within a set of 15 235 representative binding site sequences (compiled from a ChIP-seq experiment; Frietze et al., 2010) is 1.42-fold lower than would be expected based on the PWM constructed from the representative sequences (Fig. 5B), indicating that Znf263 has lower affinity for binding to sites that have flanking ‘AAA,’ than to sites containing other combinations of purines. While the PWM for Znf263 is unable to detect the lower affinity for binding to sequences containing the flanking ‘AAA’ despite being trained on the same set of binding site sequences (Fig. 5C; Supplementary Fig. S3), the TF-general DNA shape classifier assigns lower voting fraction scores (by an average 13%) to sequences containing the flanking ‘AAA’versus representative binding site sequences (P < 10−15, Welch's t-test), despite the fact that it was not trained using representative binding site sequences for Znf263 (Fig. 5D).
Fig. 5.

The DNA shape score is sensitive to multibase dependencies that are not captured by the PWM. (A) TFBS sequence logo for TF Znf263. (B) PWM submatrix from position 19 to 21 for TF ZNF263 (red box in A). (C) PWM scores for Znf263 before and after ‘AAA’ replacement (here, the suffix ‘AAA’ is under-represented among true binding sites). The same PWM model is used for both sets of oligomers. Bar, box and whiskers: median, interquartile range (IQR) and median ± 1.5 IQR. (D) DNA shape score for Znf263 before and after ‘AAA’ replacement. The same model is used for both sets of oligomers
4 Discussion
We report the first implementation of a TF-generalized classifier based on local DNA shape parameters that improves PWM-based TFBS prediction. For both short sequences and in silico promoters, the proposed approach significantly improved the PPV for most TFs versus the traditional PWM method. This improvement was obtained with a simple shape score-based filtering criterion that did not require any training. Overall, filtering on DNA shape score decreased type I error by more than it increased type II error. It seems likely that TFBS recognition performance could be further improved by varying the voting fraction cutoff or by considering more sophisticated methods of combining features. General TFBS recognition performance by the shape-based classifier will likely be further improved as more TF ChIP-seq datasets are added to the training dataset, both by providing a more complete set of positive TFBS cases and by further eliminating false-negative cases from the NCTDTP sequences used in training the classifier. The use of TF-agnostic regulatory correlates, such as the novel shape score reported here, complement approaches that require TF-specific training using representative TFBS sequences (Hooghe et al., 2012), with the two approaches addressing different problem domains—TFBS enrichment screening using the broadest collection of PWMs available, versus TF-specific TFBS recognition using a substantial set of representative training cases.
Supplementary Material
Funding
The work was supported by National Institutes of Health award (HL098807 to S.A.R.), the Oregon State University Center for Genome Research and Biocomputing and the Oregon State University College of Veterinary Medicine.
Conflict of Interest: none declared.
References
- Berger M.F., et al. (2006) Compact, universal DNA microarrays to comprehensively determine transcription-factor binding site specificities. Nat. Biotechnol., 24, 1429–1435. [DOI] [PMC free article] [PubMed] [Google Scholar]
- Breiman L. (2001) Random forests. Machine Learn., 45, 5–32. [Google Scholar]
- Bulyk M.L., et al. (2002) Nucleotides of transcription factor binding sites exert interdependent effects on the binding affinities of transcription factors. Nucleic Acids Res., 30, 1255–1261. [DOI] [PMC free article] [PubMed] [Google Scholar]
- Cartharius K., et al. (2005) MatInspector and beyond: promoter analysis based on transcription factor binding sites. Bioinformatics, 21, 2933–2942. [DOI] [PubMed] [Google Scholar]
- Chen Y., et al. (2007) Integration of genome and chromatin structure with gene expression profiles to predict c-MYC recognition site binding and function. PLoS Comput. Biol., 3, e63. [DOI] [PMC free article] [PubMed] [Google Scholar]
- Claverie J.M., Audic S. (1996) The statistical significance of nucleotide position-weight matrix matches. Comput. Appl. Biosci., 12, 431–439. [DOI] [PubMed] [Google Scholar]
- Contreras-Moreira B. (2010) 3D-footprint: a database for the structural analysis of protein–DNA complexes. Nucleic Acids Res., 38, D91–D97. [DOI] [PMC free article] [PubMed] [Google Scholar]
- Cuellar-Partida G., et al. (2012) Epigenetic priors for identifying active transcription factor binding sites. Bioinformatics, 28, 56–62. [DOI] [PMC free article] [PubMed] [Google Scholar]
- de Hoon M.J.L., et al. (2004) Predicting gene regulation by sigma factors in Bacillus subtilis from genome-wide data. Bioinformatics, 20, i101–i108. [DOI] [PubMed] [Google Scholar]
- Elnitski L., et al. (2003) Distinguishing regulatory DNA from neutral sites. Genome Res., 13, 64–72. [DOI] [PMC free article] [PubMed] [Google Scholar]
- Ernst J., et al. (2010) Integrating multiple evidence sources to predict transcription factor binding in the human genome. Genome Res., 20, 526–536. [DOI] [PMC free article] [PubMed] [Google Scholar]
- Friedman J., et al. (2000) Additive logistic regression: a statistical view of boosting (with discussion and a rejoinder by the authors). Ann. Stat., 28, 337–407. [Google Scholar]
- Frietze S., et al. (2010) Genomic targets of the KRAB and SCAN domain-containing zinc finger protein 263. J. Biol. Chem., 285, 1393–1403. [DOI] [PMC free article] [PubMed] [Google Scholar]
- Gerstein M.B., et al. (2012) Architecture of the human regulatory network derived from ENCODE data. Nature, 489, 91–100. [DOI] [PMC free article] [PubMed] [Google Scholar]
- Holloway D.T., et al. (2005) Integrating genomic data to predict transcription factor binding. Genome Inf., 16, 83–94. [PubMed] [Google Scholar]
- Hooghe B., et al. (2012) A flexible integrative approach based on random forest improves prediction of transcription factor binding sites. Nucleic Acids Res., 40, e106. [DOI] [PMC free article] [PubMed] [Google Scholar]
- Johnson D.S., et al. (2007) Genome-wide mapping of in vivo protein–DNA interactions. Science, 316, 1497–1502. [DOI] [PubMed] [Google Scholar]
- Lavery R., Sklenar H. (1988) The definition of generalized helicoidal parameters and of axis curvature for irregular nucleic acids. J. Biomol. Struct. Dyn., 6, 63–91. [DOI] [PubMed] [Google Scholar]
- Lähdesmäki H., et al. (2008) Probabilistic inference of transcription factor binding from multiple data sources. PLoS ONE, 3, e1820. [DOI] [PMC free article] [PubMed] [Google Scholar]
- Park P.J. (2009) ChIP-seq: advantages and challenges of a maturing technology. Nat. Rev. Genet., 10, 669–680. [DOI] [PMC free article] [PubMed] [Google Scholar]
- Pique-Regi R., et al. (2011) Accurate inference of transcription factor binding from DNA sequence and chromatin data. Genome Res., 21, 447–455. [DOI] [PMC free article] [PubMed] [Google Scholar]
- Ramsey S.A., et al. (2010) Genome-wide histone acetylation data improve prediction of mammalian transcription factor binding sites. Bioinformatics, 26, 2071–2075. [DOI] [PMC free article] [PubMed] [Google Scholar]
- Rohs R., et al. (2009) The role of DNA shape in protein–DNA recognition. Nature, 461, 1248–1253. [DOI] [PMC free article] [PubMed] [Google Scholar]
- Roth F.P., et al. (1998) Finding DNA regulatory motifs within unaligned noncoding sequences clustered by whole-genome mRNA quantitation. Nat. Biotechnol., 16, 939–945. [DOI] [PubMed] [Google Scholar]
- Rozowsky J., et al. (2009) PeakSeq enables systematic scoring of ChIP-seq experiments relative to controls. Nat. Biotechnol., 27, 66–75. [DOI] [PMC free article] [PubMed] [Google Scholar]
- Segal E., et al. (2006) A genomic code for nucleosome positioning. Nature, 442, 772–778. [DOI] [PMC free article] [PubMed] [Google Scholar]
- Sinha S., et al. (2006) Stubb: a program for discovery and analysis of cis-regulatory modules. Nucleic Acids Res., 34, W555–W559. [DOI] [PMC free article] [PubMed] [Google Scholar]
- Staden R. (1984) Computer methods to locate signals in nucleic acid sequences. Nucleic Acids Res., 12, 505–519. [DOI] [PMC free article] [PubMed] [Google Scholar]
- Stormo G.D., et al. (1982) Use of the ‘Perceptron’ algorithm to distinguish translational initiation sites in E . coli. Nucleic Acids Res., 10, 2997–3011. [DOI] [PMC free article] [PubMed] [Google Scholar]
- Vettese-Dadey M., et al. (1996) Acetylation of histone H4 plays a primary role in enhancing transcription factor binding to nucleosomal DNA in vitro. EMBO J., 15, 2508–2518. [PMC free article] [PubMed] [Google Scholar]
- Vapnik V., et al. (1996) Support vector method for function approximation, regression estimation, and signal processing. Adv. Neural Inf. Process. Syst., 9, 281–287. [Google Scholar]
- Wasserman W.W., Sandelin A. (2004) Applied bioinformatics for the identification of regulatory elements. Nat. Rev. Genet., 5, 276–287. [DOI] [PubMed] [Google Scholar]
- Won K.-J., et al. (2010) Genome-wide prediction of transcription factor binding sites using an integrated model. Genome Biol., 11, R7. [DOI] [PMC free article] [PubMed] [Google Scholar]
- Xie D., et al. (2008) Cross-species de novo identification of cis-regulatory modules with GibbsModule: application to gene regulation in embryonic stem cells. Genome Res., 18, 1325–1335. [DOI] [PMC free article] [PubMed] [Google Scholar]
- Yang L., et al. (2014) TFBSshape: a motif database for DNA shape features of transcription factor binding sites. Nucleic Acids Res., 42, D148–D155. [DOI] [PMC free article] [PubMed] [Google Scholar]
- Zhou T., et al. (2013) DNAshape: a method for the high-throughput prediction of DNA structural features on a genomic scale. Nucleic Acids Res., 41, W56–W62. [DOI] [PMC free article] [PubMed] [Google Scholar]
Associated Data
This section collects any data citations, data availability statements, or supplementary materials included in this article.