

Abstract
The structure of the human gastrointestinal microbiota can change during pregnancy, which may influence gestational metabolism; however, a mechanism of action remains unclear. Here we observed that in wild-type (WT) mice the relative abundance of Actinobacteria and Bacteroidetes increased during pregnancy. Along with these changes, short-chain fatty acids (SCFAs), which are mainly produced through gut microbiota fermentation, significantly changed in both the cecum and peripheral blood throughout gestation in these mice. SCFAs are recognized by G protein-coupled receptors (GPCRs) such as free fatty acid receptor-2 (FFA2), and we have previously demonstrated that the fatty acid receptor-2 gene (Ffar2) expression is higher in pancreatic islets during pregnancy. Using female Ffar2−/− mice, we explored the physiological relevance of signaling through this GPCR and found that Ffar2-deficient female mice developed fasting hyperglycemia and impaired glucose tolerance in the setting of impaired insulin secretion compared with WT mice during, but not before, pregnancy. Insulin tolerance tests were similar in Ffar2−/− and WT mice before and during pregnancy. Next, we examined the role of FFA2 in gestational β-cell mass, observing that Ffar2−/− mice had diminished gestational expansion of β-cells during pregnancy. Interestingly, mouse genotype had no significant impact on the composition of the gut microbiome, but did affect the observed SCFA profiles, suggesting a functional difference in the microbiota. Together, these results suggest a potential link between increased Ffar2 expression in islets and the alteration of circulating SCFA levels, possibly explaining how changes in the gut microbiome contribute to gestational glucose homeostasis.
Keywords: free fatty acid receptor-2, islets, gut microbiome
the gut microbiome has recently been identified as a factor contributing to the pathogenesis of metabolic states such as diabetes and obesity (3, 23). Concordantly, the gut microbiome is known to be a factor in metabolic changes during pregnancy (20). Altered metabolism during gestation may result in higher glucose and, potentially, gestational diabetes mellitus, a harbinger of future diabetes in the mother. Maternal hyperglycemia also increases offspring risk of future diabetes (9). Thus, identifying factors important for maternal glucose homeostasis during pregnancy is crucial for improving the health of pregnant mothers and their offspring. A central challenge in the gut microbiome field, however, is identifying the underlying mechanism by which the gut microbiome mediates host metabolic effects.
Insulin resistance and the pancreatic β-cell response to insulin resistance are the hallmarks of the metabolic changes important for glucose homeostasis during pregnancy. Specifically, insulin resistance increases during gestation, which leads to impaired peripheral insulin signaling. β-Cells compensate for the insulin resistance by altering insulin secretion and adjusting β-cell mass (7, 14). A possible mechanism governing the relationship between the gut microbiome and metabolic responses during pregnancy came from a study that examined the alteration of gene expression levels in islets in the face of pregnancy-induced insulin resistance. Specifically, we (22) and others (34), using gene expression arrays, observed that the free fatty acid receptor-2 gene (Ffar2) was upregulated in islets during gestational insulin resistance. The endogenous ligands for the free fatty acid receptor-2 (FFA2) are short-chain fatty acids (SCFAs), which are primarily derived from gut microbial fermentation (21). Thus, we hypothesize that a relationship exists between the gut-microbiome and FFA2 in β-cells during pregnancy. To explore this hypothesis, we investigated the interrelationships of the gut microbiota, SCFAs, and FFA2 during pregnancy using Ffar2 null mice (Ffar2−/−) and examined the gestational impact on gut microbial composition, SCFA levels, and glucose homeostasis.
METHODS
Mouse model.
Ffar2+/− mice (on a C57BL/6J background) were bred and Ffar2−/− and wild-type (WT) mice were generated as previously described (25). In brief, the gene encoding FFA2 has three exons, and these mice contain a targeting construct replacing a portion of exon 1 of Ffar2, which shifts the reading frame of the downstream amino acid sequence. For genotyping, genomic DNA was amplified by PCR using multiplex primer pairs as before (25). Mice were housed under standard temperature and humidity conditions, and all mice including pregnant mice had ad libitum access to standard chow diet (LM-485; Harlan Laboratories, Indianapolis, IN) and water. Female mice studied were between 10 and 14 wk of age. These animal experiments were approved by the Institutional Animal Care and Use Committee at Northwestern University.
Glucose and insulin tolerance tests.
Blood was obtained from tail veins for glucose determination (measured with a One-Touch Ultra Glucometer) and insulin assays (by ELISA; ALPCO). Both oral (OGTT) and intraperitoneal (IPGTT) glucose tolerance tests were done on mice fasted overnight with glucose given either by intraperitoneal injection or oral gavage at a dose of 2 g glucose/kg of body wt. Glucose and/or insulin levels were measured at multiple time points (0–120 min) during the OGTT and IPGTT. For both the IPGTT and OGTT, the area under the curve was calculated using the trapezoidal rule. For measuring glucagon-like peptide 1 (GLP-1) secretion, 2 g glucose/kg of body wt OGTT was performed with blood samples collected at 0 and 30 min as before (28). The ELISA kit for active GLP-1 was from Immuno-Biological Laboratories (Minneapolis, MN). Insulin tolerance tests (ITT) were performed on mice fasted for 6 h, followed by intraperitoneal injections of 1.0 U/kg insulin and glucose levels followed over 120 min. Results are presented as percentage of blood glucose before insulin injection.
Islet morphometry and β-cell proliferation.
Mouse pancreata were immediately removed from dead mice, weighed, and fixed in 4% paraformaldehyde in PBS solution for 1 h, kept in 30% sucrose in PBS overnight, and the next day cryopreserved in optimal-cutting-temperature media and frozen at −80°C until further processing. Three to four sections from different (nonoverlapping) regions of the pancreas were stained for insulin (guinea pig anti-insulin 1:1,000; Invitrogen) followed by secondary antibody, fluorescein goat anti-guinea pig IgG (Vector Laboratories, Burlingame, CA) to determine total islet area. These sections were imaged at both ×4 and ×40, and images were acquired using a Spot camera with the accompanying image analysis software (Diagnostic Instruments, Sterling Heights, MI) attached to a Nikon Eclipse 50i microscope (Nikon, Tokyo, Japan).
For morphometric analysis, three to four nonoverlapping sections from each pancreas (spanning the width of the pancreas) were used for each analysis. All analyses were conducted on at least five animals per age, genotype, and treatment condition. For determination of β-cell mass, sections were immunolabeled with guinea pig anti-insulin and rabbit anti-glucagon primary antibodies and imaged by epifluorescence at ×4 and ×40 magnification. The total pancreatic area and islet area of each section was measured using ImageJ software (http://imagej.nih.gov/ij/). β-Cell mass was estimated as the product of the relative β-cell area and the wet weight of the pancreas. β-Cell proliferation was examined by immunolabeling with guinea pig anti-insulin and rabbit anti-Ki-67 primary antibodies. Islets were imaged at ×40, the number of insulin-positive and both insulin- and Ki-67-positive cells (Ki-67+) was counted, and proliferation was calculated as the percentage of Ki-67+ β-cells.
Islet isolation, culture, and treatment.
Islets were isolated by collagenase digestion. Briefly, 3 ml of 0.8 mg/ml collagenase (Sigma Chemical, St. Louis, MO) in Hanks' buffered saline solution (HBSS) were injected in the pancreas through the pancreatic duct. The inflated pancreas was excised out, incubated for 17 min at 37°C, and passed through a 400-μm wire mesh. Following digestion, pancreas was rinsed with ice-cold HBSS, and islets were separated by density gradient in Histopaque (Sigma). After several washes with HBSS, islets were handpicked under a dissection microscope and were allowed to recover for 1–2 h at 37°C in RPMI 1640 supplemented with 10% FBS, 1% l-glutamine, and 1% penicillin/streptomycin. For hormone treatment experiments, islets isolated from CD1 mice (age 10–12 wk) were treated for 24 h with or without pregnancy hormones, 50 nmol/l progesterone, 10 nmol/l 17β-estradiol, 50 ng/ml prolactin, or 200 nmol/l dexamethasone in the RPMI 1640 media (but with only 1% FBS) in a similar manner as before (15). Each treatment had at least three replicates with islets pooled from four mice per replicate. Islets isolated from Ffar2−/− and WT mice [at gestation day (G) 0 and G15] or from CD1 female mice were used to isolate RNA for gene expression studies.
RNA extraction and quantitative real-time PCR.
Total cellular RNA was extracted from tissues (after homogenization in Trizol; Invitrogen) and islets using an RNeasy Mini kit (QIAGEN). For islet RNA, quantitative real-time PCR was performed using a 1-Step SYBR Green qRT-PCR Kit. For tissue RNA, cDNA was synthesized as described before (22), and qPCR was performed using Taqman primers (Applied Biosystems) and hydrolysis probes (Roche) (22). The relative expression of the target genes was determined by the comparative ΔCt method after normalization to β-actin. The primers used are available upon request.
Organic acids extraction and analysis.
GC-MS was used for measurement of organic acids in mouse plasma from blood collected from inferior vena cava and cecum. For the cecum samples, 100–250 mg of frozen contents were transferred to glass tubes (16 × 125 mm) fitted with a screw cap, and 100 μl of internal standards stock solution (1 M [1-13C]acetate, 1 M [2H6]propionate, 0.2 M [13C4]butyrate, 0.5 M [13C]lactate, and 40 mM [13C4]succinic acid) were added to the tubes. Before extraction, samples were freeze-dried at −50°C for 3h (yield 23–75 mg dry weight). After acidification with 50 μl of 37% HCl, the organic acids were extracted two times in 2 ml diethyl ether, and a 500-μl aliquot of the extracted sample was mixed together with 50 μl of N-tert-butyldimethylsilyl-N-methyltrifluoracetamide (Sigma) at room temperature. For the plasma samples, 10 μl of the internal standards solution were mixed with 50 μl of mouse plasma samples and further processed as described above. An aliquot (1 μl) of the resulting derivatized material was injected in a gas chromatograph (Agilent Technologies 7890 A) coupled to a mass spectrometer detector (Agilent Technologies 5975 C). A linear temperature gradient was used: the initial temperature of 65°C was held for 6 min, increased to 260°C (15°C/min) and then to 280°C for 5 min. The injector and transfer line temperatures were 250°C. Quantitation was completed in selected ion monitoring acquisition mode by comparison with labeled internal standards. The mass-to-charge ratios of monitored ions were as follows: 117 (acetic acid), 131 (propionic acid), 145 (butyric acid), 261 (lactic acid), 289 (succinic acid), 121 ([1-13C]acetate), 136 ([2H5]propionate), 149 ([13C4]butyrate), 264 ([13C]lactate), and 293 ([13C4]succinic acid).
Amplicon library preparation.
DNA was extracted from fecal samples using the PowerSoil kit (MoBIO) according to Earth Microbiome Project (EMP) standard protocols (http://www.earthmicrobiome.org/emp-standard-protocols/dna-extraction-protocol/). Genomic DNA was amplified using the EMP barcoded primer sets (12). The V4 region of the 16S rRNA genes (515F-806R) was amplified. Each 20-μl PCR reaction contained 5 μl of MoBio PCR Water (Certified DNA-Free), 10 μl of Extract-N-Amp Ready Mix, 1 μl of Forward Primer (5 μM concentration, 200 pM final), 1 μl Golay Barcode Tagged Reverse Primer (5 μM concentration, 200 pM final), and 4 μl of DNA template. The conditions for PCR were as follows: 94°C for 3 min to denature the DNA, with 35 cycles at 94°C for 45 s, 50°C for 60 s, and 72°C for 90 s, with a final extension of 10 min at 72°C to ensure complete amplification (http://www.earthmicrobiome.org/emp-standard-protocols/16s/). PCR amplifications were completed in triplicate, and then pooled. Following pooling, amplicons were quantified using PicoGreen (Invitrogen) and a plate reader. Once quantified, equimolar aliquots of products were pooled in a single tube. This pool was then cleaned using the UltraClean PCR Clean-Up Kit (MoBIO) and quantified using Qubit (Invitrogen). After quantification, the molarity of the pool was determined and diluted to 2 nM, denatured, and then diluted to a final concentration of 4 pM with a 30% PhiX spike for loading on the Illumina MiSeq. The Argonne National Laboratory Biosciences Core Sequencing Facility carried out sequencing.
Sequence processing and analysis.
Processing of sequence data was done using the QIIME v1.8.0 software suite (11). Forward reads (151 bp) were screened for quality and demultiplexed using the split_libraries_fastq.py script in QIIME; 20,124,643 high-quality reads (139,000–531,000 sequences/sample) were clustered using the pick_open_reference_otus.py wrapper script in QIIME (33). Reads were first preclustered at 60% identity to the Greengenes database (26), and all reads that failed to cluster in this step were removed. The remaining reads were then clustered against the Greengenes database at 97% identity. All reads that failed to cluster with a reference sequence were then clustered de novo at 97% identity. Singleton clusters were then removed, leaving a total of 150,614 operational taxonomic units (OTUs). A representative sequence from each of these clusters was phylogenetically classified using the QIIME script assign_taxonomy.py (set to the RDP classifier) trained on the Greengenes database (38). Representative sequences were aligned in QIIME using PyNAST (default settings), and a phylogenetic tree was constructed using FastTree 2.0 (10, 30). An OTU table constructed from these clusters was rarefied to a depth of 80,000 sequences/sample, resulting in a table containing 7,360,000 reads and 112,876 OTUs. All sequence data are in the process of being submitted to the EBI database. β-Diversity analysis was carried out by calculating the pairwise weighted UniFrac distance between each pair of samples (24), and the resulting distance matrix was used for all downstream statistical tests of community structure similarity.
Statistical analysis.
The significance of microbial community sample groupings was assessed using ADONIS and MRPP (QIIME's compare_categories.py script). In all cases, statistical significance was calculated by comparing the R statistic with a distribution generated by 10,000 permutations of the randomized dataset. To determine whether or not individual OTUs showed significant differences in relative abundances across categories, the group_significance.py script was employed in QIIME, set to the Kruskal-Wallis test (a nonparametric ANOVA). Values are reported as means ± SE unless otherwise indicated. P values were calculated by Student's t-test (2-tailed, unpaired) with a significance level at P ≤ 0.05 unless otherwise indicated.
RESULTS
Pregnancy contributes to modulation of the mouse gut microbiota.
In human pregnancy, it has been observed that the structure of the gut microbiota changes drastically, resulting in a reduction in species richness, from trimester 1 to 3 (20). Here, we examined the gut microbiota in mice throughout pregnancy, by profiling stool samples from eight female mice. Fresh samples were collected at six time points throughout gestation, as well as during the postpartum period. We did not detect any significant change in the overall microbial community structure (Fig. 1A). Because of the findings in humans (20), we explored these data at the individual phyla level at baseline and during pregnancy (at gestation day 15; G15), where G15 is a time point of heightened insulin resistance and metabolic change in the mouse (18) (Fig. 1B). Although we did not detect significant phyla level remodeling of the gut microbiota during pregnancy at G15, we did observe that the relative abundance of Actinobacteria [5-fold increase in the relative abundance at postpartum day 3 (PP3) compared with before pregnancy, −G0] and Bacteroidetes (65% prepregnancy to 80% by postpartum day 20) was significantly altered (P ≤ 0.05; Fig. 1C). We also saw a marginally significant reduction in the relative abundance of Tenericutes at PP3 (28-fold reduction; P = 0.06). These findings suggest that pregnancy influences the abundance of specific bacterial phyla in the mouse gut.
Fig. 1.
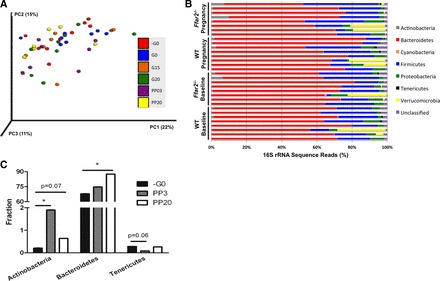
Pregnancy contributes to shifts in gut microbiota phylogenetic diversity. A: principal coordinates analysis (PCoA) plot of weighted UniFrac distances between microbial communities of wild-type (WT) mice before copulation (−G0), the day of copulation (G0), gestation day 15 (G15), gestation day 20 (G20), postpartum day 3 (PP03), and postpartum day 20 (PP20). Each dot represents a fecal community. Nos. in parentheses indicate the %variability explained by each axis. B: abundance plot of the prominent phyla in each mouse [wild type (WT) and Ffar2−/−] at baseline (G0) and during pregnancy (G15). C: relative abundance of Actinobacteria, Bacteroidetes, and Tenericutes in gut microbiota of WT mice at −G0, PP03, and PP20. *P ≤ 0.05.
Pregnancy contributes to modulation of the SCFAs.
SCFAs are principal products of the fermentative activity of the gut microbiota. The greatest concentration of SCFAs is measured in the cecum, where microbial fermentation is especially favored by low pH and high nutrient availability. Thus, we measured the levels of SCFAs (acetate, propionate, and butyrate), and known intermediates in SCFA synthesis (succinate and lactate), in the cecum of WT mice before and during pregnancy (G15). While there was no significant difference in the total concentration of measured cecum metabolites before or during pregnancy, the relative proportions of these metabolites were significantly different (Table 1). Specifically, acetate and propionate increased in their relative proportion during pregnancy, whereas lactate, a precursor of propionate and butyrate, was decreased.
Table 1.
Pregnancy contributes to changes in SCFA levels in the cecum and blood
| Cecum Metabolites |
Plasma SCFAs |
|||
|---|---|---|---|---|
| Baseline | Pregnancy | Baseline | Pregnancy | |
| Total metabolites, μmol/ml | 144.4 ± 30.0 | 98.0 ± 12.6 | 1.25 ± 0.07 | 1.31 ± 0.09 |
| Metabolites, % | ||||
| Acetate | 51.3 ± 2.1 | 65.0 ± 2.9* | 91.1 ± 0.7 | 93.2 ± 0.7 |
| Propionate | 9.0 ± 0.9 | 13.7 ± 0.8* | 7.2 ± 0.6 | 5.2 ± 0.5* |
| Butyrate | 5.1 ± 1.1 | 5.6 ± 0.4 | 1.7 ± 0.1 | 1.7 ± 0.2 |
| Lactate | 29.6 ± 2.9 | 12.5 ± 3.2* | Not measured | Not measured |
| Succinate | 5.2 ± 2.5 | 3.3 ± 0.7 | Not measured | Not measured |
Samples were taken at baseline and during pregnancy (gestational day 15) and are expressed as means ± SE. Data represent the total and individual levels of metabolites and short-chain fatty acids (SCFAs) measured in the cecum and blood plasma of wild-type mice (n = 8), respectively.
P ≤ 0.05 compared with baseline.
SCFAs are rapidly absorbed in the cecum and proximal colon, and are present in blood at reduced concentrations compared with cecum. To evaluate systemic SCFAs, we measured plasma levels of SCFAs before and during pregnancy, at G15 (Table 1). We observed a trend (P = 0.06) toward higher total circulating SCFAs in WT mice at G15 compared with prepregnancy levels. We also observed a trend toward higher levels of acetate during pregnancy compared with prepregnancy levels. The opposite pattern emerged for propionate, where plasma propionate levels decreased during pregnancy despite the increase in cecal levels. Taken together, these data show that pregnancy influences SCFA levels in the cecum, and to a lesser extent extent, in plasma.
The expression of the G protein-coupled receptor, Ffar2, is dynamically regulated during pregnancy.
FFA2 is a recently deorphanized G protein-coupled receptor (GPCR) that is activated by SCFAs and is widely expressed in multiple tissue types, including pancreatic β-cells (4, 19, 22). In view of our previous observations that Ffar2 expression was upregulated in mouse islets on days 13 and 14.5 of gestation compared with age-matched nonpregnant mice, we examined Ffar2 mRNA levels during pregnancy in mouse islets in greater detail. Ffar2 mRNA levels in mouse islets initially decreased at G10 compared with islets from age-matched, nonpregnant mice, and then increased at G15, a time point of heightened insulin resistance (18), and subsequently returned to baseline levels near G20 and in the postpartum period (Fig. 2A). We next examined whether islet Ffar2 expression is directly regulated by pregnancy-related hormones and found Ffar2 to be suppressed by dexamethasone and increased by estradiol, whereas progesterone and prolactin did not alter Ffar2 expression (Fig. 2B). We then tested whether Ffar2 expression during pregnancy was altered in tissues other than islets. We observed that Ffar2 mRNA levels were altered in multiple tissues. Specifically, Ffar2 expression was decreased in the spleen on G15 but returned to prepregnancy levels during the postpartum period. In white fat tissue, Ffar2 expression was lower during both pregnancy and in the postpartum period compared with prepregnancy levels (Fig. 2C). Finally, we measured the level of mRNA encoding the three other FFA receptors in islets from both the Ffar2−/− and WT mice before and during pregnancy, G15 (Fig. 2D). We observed that, before pregnancy, the islets from Ffar2−/− mice express significantly lower levels of Ffar3 mRNA than their WT counterparts and that, during pregnancy, Ffar3 levels in WT mice decrease to levels similar to those present in Ffar2−/− mice. Ffar1 and Ffar4 expression was largely uninfluenced by mouse genotype or pregnancy. Taken together, these data show tissue-specific regulation of Ffar2 mRNA levels during pregnancy and suggest that the hormonal milieu of pregnancy may be important for controlling Ffar2 expression. Moreover, our data suggest that, in addition to Ffar2 expression, pregnancy may influence Ffar3 expression.
Fig. 2.
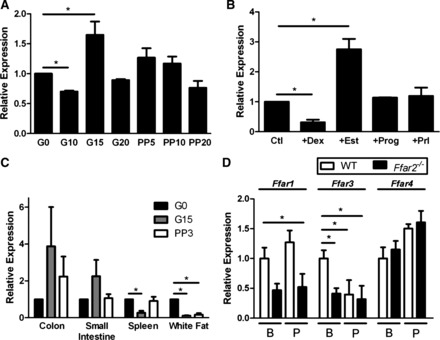
Free fatty acid receptor-2 (FFA2) mRNA expression is differentially regulated during pregnancy. A: Ffar2 expression levels in islets isolated at various time points before (G0), during (G10, -15, -20), and after (PP05, -10, -20) pregnancy. B: Ffar2 expression in islets during treatment with various pregnancy-related hormones. Ctl, control; Dex, dexamethasone; Est, estradiol; Prog, progesterone; Prl, prolactin. C: Ffar2 levels at G0, G15, and PP03 in select tissues. D: transcript levels of free fatty acid receptors (FFA1, FFA3, and FFA4) in islets isolated from mice at G0 (baseline; B) and during pregnancy (P) in WT and Ffar2−/− mice. Transcript levels are represented relative to G0 levels. Data are represented as means ± SE, n ≥ 3. *P ≤ 0.05.
FFA2 contributes to glucose homeostasis during pregnancy.
Based on our findings that pregnancy influences the proportions of different gut microbes, SCFA levels, and Ffar2 expression, we next determined whether FFA2 contributes to glucose homeostasis during pregnancy using mice with a null mutation in Ffar2 (Ffar2−/−). First, we characterized whether Ffar2 expression affected body weight before, during, or after pregnancy, or affected litter size and found that these measures were similar between WT and Ffar2−/− mice (Fig. 3, A and B). To further evaluate the metabolic effect of Ffar2 ablation, we compared fasting glucose in WT and Ffar2−/− littermates before pregnancy and at G15 (Fig. 3C), a time point of increased Ffar2 islet expression. Before pregnancy, fasting glucose was similar between WT and Ffar2−/− mice. WT mice exhibited the typical pregnancy-associated reduction in plasma glucose levels on G15 (2, 16), whereas the pregnancy-associated decrease in fasting glucose levels was not seen in Ffar2−/− mice. These data suggest a role of FFA2 in glucose homeostasis during pregnancy.
Fig. 3.
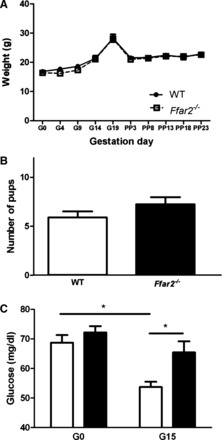
In vivo assessment of glucose homeostasis during pregnancy. A: weight gain of 10-wk-old Ffar2−/− and WT mice throughout pregnancy and into the postpartum period (Ffar2−/−, n = 16; WT, n = 13). B: average no. of pups delivered by WT and Ffar2−/− mice (Ffar2−/−, n = 12; WT, n = 10). C: fasting glucose levels before pregnancy (Ffar2−/−, n = 20; WT mice, n = 26) and during pregnancy, G15 (Ffar2−/−, n = 21; WT, n = 30). Filled bars, Ffar2−/−; open bars, WT. Data are represented as means ± SE. *P ≤ 0.05.
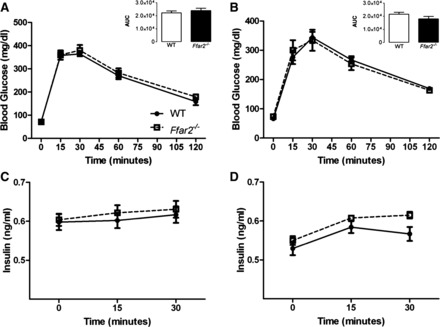
To further examine glycemic control in Ffar2−/− mice, we assessed glucose tolerance using an IPGTT. Before pregnancy, Ffar2−/− and WT mice did not show differences in either fasting glucose or in glucose excursions in response to glucose injection (Fig. 4A). Additionally, no difference in the insulin response to intraperitoneal glucose was observed before pregnancy (Fig. 4C). To test whether the adaptive increase in Ffar2 expression played an important role in controlling gestational glucose metabolism, we performed an IPGTT on days 15-16 of gestation. We observed a higher glucose excursion in response to glucose and reduced insulin levels in the Ffar2−/− mice in the IPGTT compared with WT mice during pregnancy (Fig. 5, A and B). To test if the mode of glucose delivery affected the glucose and insulin responses, OGTTs were performed, which recapitulated the results observed with IPGTT (Fig. 5, C and D) during pregnancy, i.e., a higher glucose excursion and lower insulin levels in Ffar2−/− compared with WT mice. Again there was no difference in the OGTT before pregnancy (Fig. 4, B and D).
Fig. 4.
Glucose tolerance before pregnancy in Ffar2−/− mice compared with WT. A: glucose values during an intraperitoneal glucose tolerance test (IPGTT) before pregnancy (Ffar2−/−, n = 10; WT, n = 9). B: glucose values during an oral glucose tolerance test (OGTT) before pregnancy (Ffar2−/−, n = 16; WT, n = 9). C: insulin values during an IPGTT from Ffar2−/− and WT mice before pregnancy (Ffar2−/−, n = 10; WT, n = 9). D: insulin values during an OGTT of Ffar2−/− and WT mice before pregnancy (Ffar2−/−, n = 16; WT, n = 9). White squares, Ffar2−/−; black circles, WT. Inset depicts the area under the curve (AUC). Open bars, WT; filled bars, Ffar2−/−. Data are represented as means ± SE.
Fig. 5.
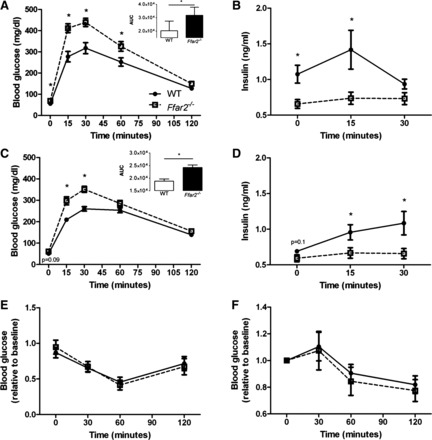
Ffar2−/− mice exhibit impaired glucose tolerance during pregnancy. A: glucose values during an IPGTT on G15 (Ffar2−/−, n = 13; WT, n = 18). B: insulin values during an IPGTT from Ffar2−/− and WT mice on G15 (n = 4–8). C: glucose values during an OGTT on G15 (Ffar2−/−, n = 12; WT, n = 12). D: insulin values during an OGTT of Ffar2−/− and WT mice on G15 (n = 4–8). E and F: glucose values during an insulin tolerance test (ITT) for Ffar2−/− and WT mice before pregnancy (E) and at G15 (F) (n = 8–16). white squares, Ffar2−/−; black circles, WT. Inset depicts the AUC. Open bar, WT; filled bar, Ffar2−/−. Data are represented as means ± SE. *P ≤ 0.05.
To determine whether or not Ffar2 deletion impacts insulin tolerance, we performed an ITT but did not observe any differences in the response to insulin in Ffar2−/− and WT mice before (Fig. 5E) and during (G15) (Fig. 5F) pregnancy. Taken together our data suggest that the higher Ffar2 expression in islets, and the resulting increase in insulin secretion, are required for proper gestational glucose handling.
SCFAs have been shown to stimulate incretin secretion, specifically GLP-1, by activating FFA2 (37). Considering this, we investigated whether the FFA2-dependent GLP-1 secretion contributes to the pregnancy-specific impairment in glucose tolerance observed with Ffar2−/− mice. We found that fasting plasma levels of active GLP-1 (pmol/l) were similar in nonpregnant Ffar2−/− and WT mice (11.6 ± 1.2 vs. 12.4 ± 1.3, mean ± SE, n = 8), and significantly increased (P ≤ 0.05) in response to an oral glucose challenge in the WT mice but not Ffar2−/− mice (15.3 ± 2.5 vs. 11.6 ± 0.5, mean ± SE, n = 8), as observed before (37). During pregnancy, we found that fasting plasma concentrations of active GLP-1 peptides were similar between Ffar2−/− and WT mice (14.2 ± 1.0 vs. 18.7 ± 1.9, mean ± SE, n = 8), and did not significantly increase in response to an oral glucose challenge in the WT or Ffar2−/− mice (17.1 ± 1.3 vs. 18.7 ± 1.9, mean ± SE, n = 8) similar to what has been described in human pregnant women (6). Collectively, these data indicate the impaired glucose tolerance observed during pregnancy with genetic deletion of Ffar2 is likely not a result of impaired GLP-1 secretion.
Ffar2−/− mice have impaired β-cell expansion during pregnancy.
GPCRs are well known to modulate the response of pancreatic β-cells to insulin resistance by a variety of mechanisms, in part through the expansion of β-cell mass (1). Therefore, we explored the role of FFA2 in β-cell mass expansion during pregnancy (1). Surprisingly, under basal conditions, G0 (Fig. 6A), female Ffar2−/− mice exhibited a trend toward decreased β-cell mass compared with the female WT littermate mice. Although this trend did not reach significance, it is important to note that we have observed significantly diminished β-cell mass in male Ffar2−/− mice under nonstressed conditions (unpublished data). During pregnancy, G15, β-cell mass increased in both Ffar2−/− and WT littermate mice, but was still lower in the Ffar2−/− mice (Fig. 6A). We next examined pancreatic β-cell proliferation. Before pregnancy (Fig. 6B), proliferation rates were very low and similar between the Ffar2−/− and WT mice. During pregnancy (G15-16), β-cell proliferation increased in both Ffar2−/− and WT littermate mice compared with nonpregnant mice; however, the percentage of Ki-67+ β-cells was higher in WT compared with Ffar2−/− islets (Fig. 6B). Taken together, these data indicate that the FFA2 contributes to gestational β-cell mass expansion.
Fig. 6.
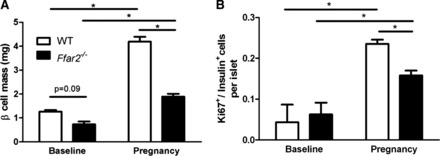
Ffar2−/− mice exhibit impaired β-cell mass during pregnancy. A: β-cell mass in female WT (open bars) and Ffar2−/− (filled bars) mice before pregnancy (baseline) and during pregnancy (G15) (n = 5–9). B: analysis of β-cell proliferation in WT (open bars) and Ffar2−/− mice (filled bars) mice as determined by Ki-67 staining before pregnancy (baseline) and during pregnancy (G15) (n = 4–5). Data are represented as means ± SE. *P ≤ 0.05.
Mouse genotype influences the SCFA levels.
To determine whether mouse genotype contributes to the structure of the gut microbiome, we profiled the fecal gut microbiota of eight Ffar2−/− female mice compared with eight WT (littermate pairs) at two time points before pregnancy (on the initial day of individual housing and 3 wk later when the male was introduced). No significant differences in the overall diversity of the bacterial communities were detected in the Ffar2−/− mice compared with WT mice before pregnancy (Fig. 7A). However, an analysis of the relative abundance of phyla revealed a threefold increase in Actinobacteria in the Ffar2−/− gut microbiome relative to the WT (Fig. 7B). Compared with the WT mice during pregnancy (Fig. 1), there were no differences in phyla level in the Ffar2−/− mice during gestation. These findings suggest that mouse genotype has no major impact (Ffar2−/− vs. WT littermates) on the composition of the gut microbiota and that changes in the phyla level in the gut microbiota do not occur during pregnancy in Ffar2−/− mice.
Fig. 7.
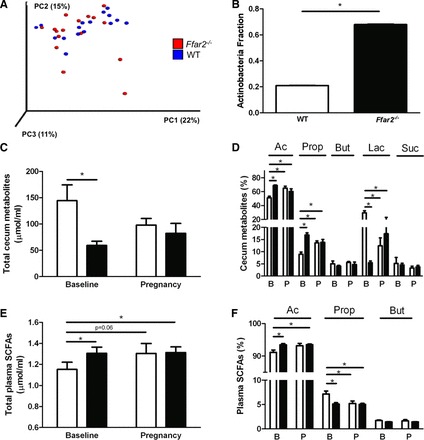
Mouse genotype contributes to shifts in mouse gut microbiota phylogenetic diversity and short-chain fatty acid (SCFA) levels in cecum and blood. A: PCoA plot of weighted UniFrac distances between microbial communities of WT (blue) and Ffar2−/− (red) mice before pregnancy at −G0 and G0. Each dot represents a fecal community. Nos. in parentheses indicate the %variability explained by each axis. B: relative abundance of Actinobacteria in gut microbiota of WT (open bars) and Ffar2−/− (filled bars) mice before pregnancy. C and D: total metabolites (acetate, propionate, butyrate, lactate, and succinate) (C) and individual levels of metabolites (D) in cecum samples of WT (open bars) and Ffar2−/− (filled bars) mice before pregnancy (baseline, B) and at G15 (P). E and F: total SCFA (E) and individual levels of SCFAs (acetate, propionate, butyrate) (F) in plasma from WT (open bars) and Ffar2−/− (filled bars) mice before pregnancy (baseline, B) and at G15 (P). Ac, acetate; Prop, propionate; But, butyrate; Lac, lactate; Suc, succinate. Data are represented as means ± SE, n = 8. *P ≤ 0.05.
As before, we measured the levels of SCFAs (acetate, propionate, and butyrate), along with succinate and lactate, in the cecum of the Ffar2−/− model before and during pregnancy (G15) and compared them with WT mice. Overall, the total abundance of measured cecal metabolites (including SCFAs, lactate, and succinate) was higher in the female WT mice compared with the Ffar2−/− mice before pregnancy. On G15, the levels of cecum metabolites in WT and Ffar2−/− mice were similar (Fig. 7C). The relative abundance of acetate was lower in WT mice before pregnancy compared with Ffar2−/− mice before and during pregnancy. A similar pattern was evident for propionate. In contrast, the relative abundance of lactate was higher in WT mice before pregnancy compared with both Ffar2−/− mice before and during pregnancy. No differences occurred in the lactate levels between WT and Ffar2−/− mice during pregnancy (Fig. 7D).
Ffar2−/− mice had higher levels of SCFAs in their plasma before pregnancy compared with WT mice, but SCFA levels did not change in Ffar2−/− mice during pregnancy (Fig. 7E). The relative level of acetate in blood was higher in Ffar2−/− mice compared with WT mice before pregnancy (Fig. 7F) and did not change in Ffar2−/− mice during pregnancy. The opposite pattern was found for propionate. Specifically, the plasma level of propionate was higher in the WT compared with Ffar2−/− mice before pregnancy and during pregnancy (Fig. 7F). Taken together, these data show that genotype influences SFCA levels in the cecum and blood plasma.
DISCUSSION
Based on our findings reported herein, we propose that Ffar2 expression is higher in pregnancy leading to increased insulin secretion and β-cell mass (Fig. 8). This model is consistent with the observations that 1) Ffar2 mRNA levels are upregulated during pregnancy, 2) deletion of Ffar2 results in impaired glucose tolerance during pregnancy due to diminished insulin secretion and β-cell proliferation, 3) pregnancy influences SCFA levels in the cecum and the blood, and 4) the phyla Actinobacteria and Bacteroidetes change in relative abundance during pregnancy. As seen in Fig. 8, these data suggest an important relationship may exist between the gut microbiota and signaling via FFA2 on β-cells through the ligation of SCFAs.
Fig. 8.
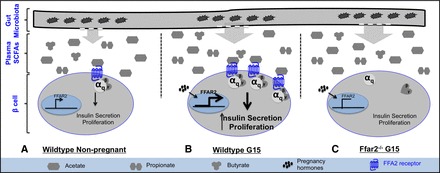
Proposed mechanism by which the gut microbiota, SCFA, and pancreatic β-cells may be collectively contributing to gestational glucose homeostasis. A: in nonpregnant WT mice, a stable gut microbial composition contributes to circulating SCFAs allowing for a basal level of FFA2 activation in response to ligation with acetate. In β-cells this results in insulin secretion and β-cell proliferation. B: during pregnancy, measurable shifts in the composition of the circulating SCFA profile along with increased expression of Ffar2, likely a response to the presence of pregnancy-associated hormones, leads to enhanced FFA2 signaling. This results in greater insulin secretion and β-cell proliferation and allows for the compensation of pregnancy-associated insulin resistance. C: however, in Ffar2-deficient mice, the pregnancy-associated circulating SCFA profile does not promote increased insulin secretion or proliferation.
Multiple pathways contribute to the β-cell response to pregnancy-induced insulin resistance (29). Here, we show that signaling through FFA2 contributes to this process. Our data suggest that pregnancy increases Ffar2 expression in islets during the insulin-resistant phase of pregnancy and that, as β-cells adapt to pregnancy-induced insulin resistance, FFA2 plays an important role through its effect on insulin secretion and β-cell proliferation. One limitation of our findings is the inability to accurately quantify FFA2 expression due to the lack of a reliable antibody, a common problem in the field of GPCR research (17). We also determined that, during pregnancy, the expression of genes encoding the other FFA receptors was either similar between WT and Ffar2−/− mice, or decreased, in the case of Ffar3. These data are interesting, since signaling by FFA3 would have inhibitory effects on insulin secretion (31), so the downregulation of Ffar3 (and upregulation of Ffar2) could be an adaptive response in the WT mice during pregnancy. However, the precise role of FFA2 in β-cell biology has yet to be determined. For example, additional studies are needed to explore if the role of FFA2 in β-cells is specific to gestational insulin resistance, or if it is important in other insulin-resistant states such as diet-induced obesity. To date, studies examining the role of FFA2 in glucose homeostasis in mice with diet-induced obesity have led to conflicting results (5, 32, 36). Regardless, our study suggests, for the first time, a role of FFA2 in adaption of islets to gestational insulin resistance. Future studies exploring how FFA2 is related to well-described pathways in β-cells that are known to be important for the response to gestational insulin resistance (29, 35) as well as the role of FFA2 in β-cells outside pregnancy are needed.
The use of a global Ffar2−/− model is a limitation of this study, since the disruption of FFA2 signaling in other cell types that contribute to glucose homeostasis, such as intestinal L cells or the brain, could confound our results. For example, activation of FFA2 in intestinal L cells has been shown to contribute to incretin secretion (37). Investigation of GLP-1 secretion immediately before and 30 min post an oral glucose load in the WT and Ffar2−/− mice revealed no differences in GLP-1 secretion during pregnancy, indicating that FFA2 does not contribute to GLP-1 secretion during pregnancy and, therefore, does not likely contribute to the impaired glucose tolerance observed in the Ffar2−/− mice. We also have examined the expression of Ffar2 in the brain, since a role in appetite and related functions could impact glucose homeostasis. Consistent with previous findings (8, 19), we were unable to detect Ffar2 in mouse brain (data not shown), which suggests that the impaired gestational glucose tolerance exhibited by the Ffar2−/− mice is likely not a direct effect of the FFA2 signaling in the brain.
In this report, SCFA levels were altered during pregnancy, and mouse genotype influenced these changes at both biological sites investigated. Of importance, it may not only be the change in total SCFA levels but also the changes in individual SCFA levels that are of biological importance. For example, plasma acetate levels were trending higher, and plasma propionate levels were lower, during pregnancy in our study. These reciprocal changes may be important, since FFA2 is selective for acetate over propionate (8), and the proportional increase in acetate could further enhance FFA2 signaling and the β-cell response. Of interest, acetate levels are higher in both plasma and cecal samples during pregnancy, whereas propionate levels are high in cecal samples but not plasma during pregnancy. These data suggest the metabolism of propionate once it leaves the gut may be altered during pregnancy, where this particular SCFA is preferentially metabolized in the liver (21). In summary, these studies demonstrate that SCFA levels are altered during pregnancy in mice. However, it is still unclear whether an increase in both Ffar2 expression levels and SCFA levels is required in this adaptive response to pregnancy in the β-cell. Of interest, McNelis et al. (27) recently reported increased Ffar2 expression in mouse islets and increased plasma acetate in mice in response to high-fat diet, similar to our findings in pregnancy.
As observed before in humans (20), pregnancy can influence the composition of the gut microbiome, with changes in community diversity between trimesters (1st and 3rd). We confirmed some of these findings in mice, but important differences exist. First, compared with the human study, which examined a large group of pregnant women between the first and third trimesters, we examined rodents in a controlled housing and dietary environment. Even in this controlled environment, the mice exhibited changes in the gut microbial community during pregnancy. However, as opposed to the human study, the compositional changes in the gut microbiome became more apparent in the postpartum period. Interestingly, these changes did not occur in Ffar2−/− mice, for unclear reasons. However, mouse genotype does influence the composition of gut microbiota (13) and therefore likely also influences how the gut microbiome is influenced by metabolic states such as pregnancy. Because human microbiome studies are problematic due to the sizable influence of the many confounding variables (including medications, dietary habits, changes in housing environments), future controlled rodent studies may help to dissect the many factors contributing to gestational effects on the gut microbiome.
The model proposed in Fig. 8 raises two important questions: 1) how does altering the gut microbiota-SCFA relationship affect the role of FFA2 in maintaining gestational glucose homeostasis, and 2) what pregnancy-related factors influence the ability of gut microbes to produce SCFAs? The first question, which addresses causality of this relationship, is a major challenge in gut microbiome research. As is the case here, the gut microbiome needs to be definitively established to be the cause of the change in SCFA levels (at both the level of the gut and blood) and then consequently be determined to be the factor affecting physiological responses. To do this, future studies will need to modify the gut microbiome, through either antibiotic knockdown of the microbiome and/or through using germ-free mice to definitively establish these relationships. Another, perhaps, more challenging problem is to establish how pregnancy influences gut microbes and their ability to produce SCFAs. One possibility is that the hormonal environment of the host during pregnancy alters the gut microbiota and this drives SCFA production. Along with these studies, identification of individual bacterial species involved in SCFA generation will also be helpful to understand how pregnancy may influence the gut microbiota at the species level. As indicated, our study has provided new directions that warrant further exploration to establish and understand this relationship between the gut microbiome, SCFAs, and FFA2.
Taken together, these data demonstrate a novel role of FFA2 in maternal adaptation to insulin resistance by contributing to β-cell adaptation to pregnancy. Because FFA2 is a unique receptor that senses metabolites produced by the gut microbiota, we interrogated these variables and found that gestation influences the gut microbiota and SCFA production, whereas signaling through FFA2, a receptor for SCFA, was important for β-cell adaptation to pregnancy, suggesting that the gut microbiota, SCFAs, and FFA2 act in concert during pregnancy to mediate gestational glucose homeostasis.
GRANTS
Support for the project has been from the Office of Research on Women's Health and the Eunice Kennedy Shriver National Institute of Child Health and Human Development Grant No. K12-HD-44405 (to B. T. Layden), the University of Chicago DR&TC (P30 DK-020595), and Department of Veterans Affairs, Veterans Health Administration, Office of Research and Development, Career Development Grant No. 1IK2BX001587-01 (to B. T. Layden). M. Fuller is supported by an American Heart Association predoctoral award (no. 15PRE25750015). M. Priyadarshini is supported by an American Heart Association postdoctoral fellowship (no. 15POST22410016). This work was also supported in part by the United States Department of Energy under Contract DE-AC02-06CH11357. S. M. Gibbons was supported by an Environmental Protection Agency STAR Graduate Fellowship and National Institutes of Health Training Grant 5T-32EB-009412.
DISCLOSURES
No conflicts of interest, financial or otherwise, are declared by the authors.
AUTHOR CONTRIBUTIONS
Author contributions: M.F., S.M.G., and B.T.L. conception and design of research; M.F., M.P., S.M.G., A.R.A., M.B., P.K.-D., and B.T.L. performed experiments; M.F., M.P., S.M.G., A.R.A., M.G.H., P.K.-D., F.B., J.A.G., and B.T.L. analyzed data; M.F., M.P., S.M.G., A.R.A., M.B., M.G.H., F.B., J.A.G., and B.T.L. interpreted results of experiments; M.F. and B.T.L. prepared figures; M.F., W.L.L., and B.T.L. drafted manuscript; M.F., W.L.L., and B.T.L. edited and revised manuscript; B.T.L. approved final version of manuscript.
REFERENCES
- 1.Ahrén B. Islet G protein-coupled receptors as potential targets for treatment of type 2 diabetes. Nat Rev Drug Discov 8: 369–85, 2009. [DOI] [PubMed] [Google Scholar]
- 2.Angueira AR, Ludvik AE, Reddy TE, Wicksteed B, Lowe WL Jr, Layden BT. New insights into glucose metabolism: lessons learned from 21st century approaches. Diabetes 64: 327–34, 2015. [DOI] [PMC free article] [PubMed] [Google Scholar]
- 3.Backhed F, Ding H, Wang T, Hooper LV, Koh GY, Nagy A, Semenkovich CF, Gordon JI. The gut microbiota as an environmental factor that regulates fat storage. Proc Natl Acad Sci USA 101: 15718–15723, 2004. [DOI] [PMC free article] [PubMed] [Google Scholar]
- 4.Bahar Halpern K, Veprik A, Rubins N, Naaman O, Walker MD. GPR41 gene expression is mediated by internal ribosome entry site (IRES)-dependent translation of a bicistronic mRNA encoding GPR40 and GPR41. J Biol Chem 287: 20154–20163, 2012. [DOI] [PMC free article] [PubMed] [Google Scholar]
- 5.Bjursell M, Admyre T, Goransson M, Marley AE, Smith DM, Oscarsson J, Bohlooly YM. Improved glucose control and reduced body fat mass in free fatty acid receptor 2-deficient mice fed a high-fat diet. Am J Physiol Endocrinol Metab 300: E211–E220, 2011. [DOI] [PubMed] [Google Scholar]
- 6.Bonde L, Vilsboll T, Nielsen T, Bagger JI, Svare JA, Holst JJ, Larsen S, Knop FK. Reduced postprandial GLP-1 responses in women with gestational diabetes mellitus. Diabetes Obes Metab 15: 713–720, 2013. [DOI] [PubMed] [Google Scholar]
- 7.Bouwens L, Rooman I. Regulation of pancreatic beta-cell mass. Physiol Rev 85: 1255–1270, 2005. [DOI] [PubMed] [Google Scholar]
- 8.Brown AJ, Goldsworthy SM, Barnes AA, Eilert MM, Tcheang L, Daniels D, Muir AI, Wigglesworth MJ, Kinghorn I, Fraser NJ, et al. The Orphan G protein-coupled receptors GPR41 and GPR43 are activated by propionate and other short chain carboxylic acids. J Biol Chem 278: 11312–11319, 2003. [DOI] [PubMed] [Google Scholar]
- 9.Buchanan TA, Xiang AH. Gestational diabetes mellitus. J Clin Invest 115: 485–491, 2005. [DOI] [PMC free article] [PubMed] [Google Scholar]
- 10.Caporaso JG, Bittinger K, Bushman FD, DeSantis TZ, Andersen GL, Knight R. PyNAST: a flexible tool for aligning sequences to a template alignment. Bioinformatics 26: 266–267, 2010. [DOI] [PMC free article] [PubMed] [Google Scholar]
- 11.Caporaso JG, Kuczynski J, Stombaugh J, Bittinger K, Bushman FD, Costello EK, Fierer N, Pena AG, Goodrich JK, Gordon JI. QIIME allows analysis of high-throughput community sequencing data. Nat Methods 7: 335–336, 2010. [DOI] [PMC free article] [PubMed] [Google Scholar]
- 12.Caporaso JG, Lauber CL, Walters WA, Berg-Lyons D, Huntley J, Fierer N, Owens SM, Betley J, Fraser L, Bauer M, Gormley N, Gilbert JA, Smith G, Knight R. Ultra-high throughput microbial community analysis on the Illumina HiSeq and MiSeq platforms. ISME J 6: 1621–1624, 2012. [DOI] [PMC free article] [PubMed] [Google Scholar]
- 13.Chassaing B, Ley RE, Gewirtz AT. Intestinal epithelial cell toll-like receptor 5 regulates the intestinal microbiota to prevent low-grade inflammation and metabolic syndrome in mice. Gastroenterology 147: 1363–1377, 2014. [DOI] [PMC free article] [PubMed] [Google Scholar]
- 14.de Koning EJ, Bonner-Weir S, Rabelink TJ. Preservation of beta-cell function by targeting beta-cell mass. Trends Pharmacol Sci 29: 218–227, 2008. [DOI] [PubMed] [Google Scholar]
- 15.Demirci C, Ernst S, Alvarez-Perez JC, Rosa T, Valle S, Shridhar V, Casinell GP, Alonso L, Vasavada RC, Garcia-Ocana A. Loss HGF/c-Met signaling in pancreatic β-cells leads to incomplete maternal β-cell adaptation and gestational diabetes mellitus. Diabetes 61: 1143–1152, 2012. [DOI] [PMC free article] [PubMed] [Google Scholar]
- 16.Hadden DR, McLaughlin C. Normal and abnormal maternal metabolism during pregnancy. Semin Fetal Neonatal Med 14: 66–71, 2009. [DOI] [PubMed] [Google Scholar]
- 17.Insel PA, Wilderman A, Zambon AC, Snead AN, Murray F, Aroonsakool N, McDonald DS, Zhou S, McCann T, Zhang L, Sriram K, Chinn AM, Michkov AV, Lynch RM, Overland AC, Corriden R. G protein-coupled receptor (GPCR) expression in native cells: “novel” endogpcrs as physiologic regulators and therapeutic targets. Mol Pharmacol 88: 181–7, 2015. [DOI] [PMC free article] [PubMed] [Google Scholar]
- 18.Karnik SK, Chen H, McLean GW, Heit JJ, Gu X, Zhang AY, Fontaine M, Yen MH, Kim SK. Menin controls growth of pancreatic beta-cells in pregnant mice and promotes gestational diabetes mellitus. Science 318: 806–809, 2007. [DOI] [PubMed] [Google Scholar]
- 19.Kebede MA, Alquier T, Latour MG, Poitout V. Lipid receptors and islet function: therapeutic implications? Diabetes Obes Metab 11, Suppl 4: 10–20, 2009. [DOI] [PMC free article] [PubMed] [Google Scholar]
- 20.Koren O, Goodrich JK, Cullender TC, Spor A, Laitinen K, Backhed HK, Gonzalez A, Werner JJ, Angenent LT, Knight R. Host remodeling of the gut microbiome and metabolic changes during pregnancy. Cell 150: 470–480, 2012. [DOI] [PMC free article] [PubMed] [Google Scholar]
- 21.Layden BT, Angueira AR, Brodsky M, Durai V, Lowe WL Jr. Short chain fatty acids and their receptors: new metabolic targets. Trans Res 161: 131–140, 2013. [DOI] [PubMed] [Google Scholar]
- 22.Layden BT, Durai V, Newman MV, Marinelarena AM, Ahn CW, Feng G, Lin S, Zhang X, Kaufman DB, Jafari N. Regulation of pancreatic islet gene expression in mouse islets by pregnancy. J Endocrinol 207: 265–279, 2010. [DOI] [PubMed] [Google Scholar]
- 23.Ley RE, Turnbaugh PJ, Klein S, Gordon JI. Microbial ecology: human gut microbes associated with obesity. Nature 444: 1022–1023, 2006. [DOI] [PubMed] [Google Scholar]
- 24.Lozupone C, Knight R. UniFrac: a New phylogenetic method for comparing microbial communities. Appl Environ Microbiol 71: 8228–8235, 2005. [DOI] [PMC free article] [PubMed] [Google Scholar]
- 25.Maslowski KM, Vieira AT, Ng A, Kranich J, Sierro F, Yu D, Schilter HC, Rolph MS, Mackay F, Artis D, et al. Regulation of inflammatory responses by gut microbiota and chemoattractant receptor GPR43. Nature 461: 1282–1286, 2009. [DOI] [PMC free article] [PubMed] [Google Scholar]
- 26.McDonald D, Price MN, Goodrich J, Nawrocki EP, DeSantis TZ, Probst A, Andersen GL, Knight R, Hugenholtz P. An improved Greengenes taxonomy with explicit ranks for ecological and evolutionary analyses of bacteria and archaea. ISME J 6: 610–618, 2012. [DOI] [PMC free article] [PubMed] [Google Scholar]
- 27.McNeils JC, Lee YS, Mayoral R, van der Kant R, Johnson AM, Wollam J, Olefsky JM. GPR43 potentiates beta cell function in obesity. Diabetes. In press. [DOI] [PMC free article] [PubMed] [Google Scholar]
- 28.Moffett RC, Vasu S, Thorens B, Drucker DJ, Flatt PR. Incretin receptor null mice reveal key role of GLP-1 but NOT GIP in pancreatic beta cell adaptation to pregnancy. PLOS One 9(6): e96863. [DOI] [PMC free article] [PubMed] [Google Scholar]
- 29.Pasek RC, Gannon M. Advancements and challenges in generating accurate animal models of gestational diabetes mellitus. Am J Physiol Endocrinol Metab 305: E1327–E1338, 2013. [DOI] [PMC free article] [PubMed] [Google Scholar]
- 30.Price MN, Dehal PS, Arkin AP. FastTree 2-approximately maximum-likelihood trees for large alignments. PLoS One 5: e9490, 2010. [DOI] [PMC free article] [PubMed] [Google Scholar]
- 31.Priyadarshini M, Layden BT. FFAR3 modulates insulin secretion and global gene expression in mouse islets. Islets In press. [DOI] [PMC free article] [PubMed] [Google Scholar]
- 32.Priyadarshini M, Villa SR, Fuller M, Wicksteed B, Mackay CR, Alquier T, Poitout V, Mancebo H, Mirmira RG, Gilchrist A, Layden BT. An acetate-specific GPCR, FFAR2, regulates insulin secretion. Mol Endocrinol 29: 1055–1066, 2015. [DOI] [PMC free article] [PubMed] [Google Scholar]
- 33.Rideout JR, He Y, Navas-Molina JA, Walters WA, Ursell LK, Gibbons SM, Chase J, McDonald D, Gonzalez A, Robbins-Pianka A, et al. Subsampled open-reference clustering creates consistent, comprehensive OTU definitions and scales to billions of sequences. Peer J 2: e545, 2014. [DOI] [PMC free article] [PubMed] [Google Scholar]
- 34.Rieck S, White P, Schug J, Fox AJ, Smirnova O, Gao N, Gupta RK, Wang ZV, Scherer PE, Keller MP, et al. The transcriptional response of the islet to pregnancy in mice. Mol Endocrinol 23: 1702–1710, 2009. [DOI] [PMC free article] [PubMed] [Google Scholar]
- 35.Sorenson RL, Brelje TC. Prolactin receptors are critical to the adaptation of islets to pregnancy. Endocrinology 150: 1566–1569, 2009. [DOI] [PubMed] [Google Scholar]
- 36.Tang C, Ahmed K, Gille A, Lu S, Grone HJ, Tunaru S, Offermanns S. Loss of FFA2 and FFA3 increases insulin secretion and improves glucose tolerance in type 2 diabetes. Nat Med 2: 173–137, 2015. [DOI] [PubMed] [Google Scholar]
- 37.Tolhurst G, Heffron H, Lam YS, Parker HE, Habib AM, Diakogiannaki E, Cameron J, Grosse J, Reimann F, Gribble FM. Short-chain fatty acids stimulate glucagon-like peptide-1 secretion via the G-protein-coupled receptor FFAR2. Diabetes 61: 364–371, 2012. [DOI] [PMC free article] [PubMed] [Google Scholar]
- 38.Wang Q, Garrity GM, Tiedje JM, Cole JR. Naïve bayesian classifier for rapid assignment of rRNA sequences into the new bacterial taxonomy. Appl Environ Microbiol 73: 5261–5267, 2007. [DOI] [PMC free article] [PubMed] [Google Scholar]