Abstract
Haematopoietic stresses mobilize haematopoietic stem cells (HSCs) from the bone marrow to the spleen and induce extramedullary haematopoiesis (EMH). However, the cellular nature of the EMH niche is unknown. Here, we assessed the sources of the key niche factors, SCF and CXCL12, in the mouse spleen after EMH induction by myeloablation, blood loss, or pregnancy. In each case, Scf was expressed by endothelial cells and Tcf21+ stromal cells, primarily around sinusoids in the red pulp, while Cxcl12 was expressed by a subset of Tcf21+ stromal cells. EMH induction markedly expanded the Scf-expressing endothelial cells and stromal cells by inducing proliferation. Most splenic HSCs were adjacent to Tcf21+ stromal cells in red pulp. Conditional deletion of Scf from spleen endothelial cells or Scf or Cxcl12 from Tcf21+ stromal cells severely reduced spleen EMH and reduced blood cell counts without affecting bone marrow haematopoiesis. Endothelial cells and Tcf21+ stromal cells thus create a perisinusoidal EMH niche in the spleen, which is necessary for the physiological response to diverse haematopoietic stresses.
The haematopoietic system employs facultative niches that arise in response to injury. Adult haematopoiesis occurs primarily in the bone marrow of mammals. However, a wide range of haematopoietic stresses including myelofibrosis1, anaemia2,3, pregnancy4,5, infection6,7, myeloablation8, and myocardial infarction9 can induce EMH, in which HSCs are mobilized to sites outside the bone marrow to expand haematopoiesis. The splenic red pulp is a prominent site of EMH in mice and humans10-13. During EMH, HSCs are found mainly around sinusoids in the red pulp, raising the possibility of a perisinusoidal niche14. CXCL12 is expressed by sinusoidal endothelial cells in the red pulp of the human spleen15 and macrophage ablation reduces splenic erythropoiesis after irradiation16. However, little else is known about the EMH niche.
Niche factor expression in the spleen
HSCs are rare in normal adult spleen17 but myeloablation with cyclophosphamide followed by daily administration of granulocyte colony-stimulating factor (G-CSF) induces HSC mobilization from the bone marrow to the spleen and induction of EMH8. Cyclophosphamide plus 21 days of G-CSF (Cy+21d G-CSF) increased erythropoiesis and myelopoiesis in the red pulp, profoundly increasing spleen size, spleen cellularity, HSC number, and progenitor numbers relative to control spleens (Extended Data Fig. 1c, 1f-1m).
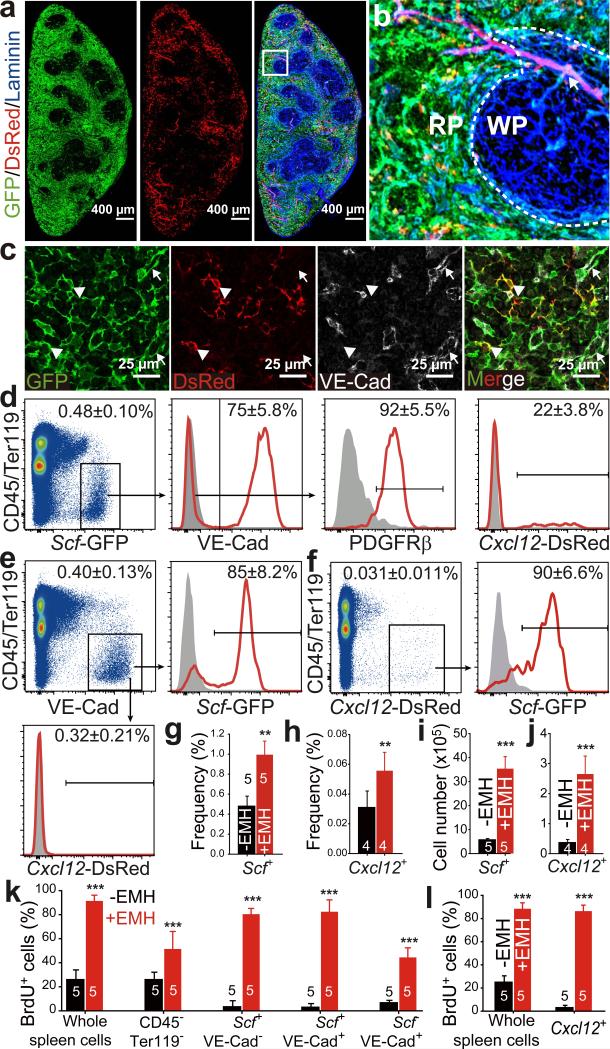
In normal adult spleens from ScfGFP; Cxcl12DsRed mice18,19, and after EMH induction, Scf-GFP and Cxcl12-DsRed were primarily expressed throughout the red pulp (Fig. 1a, 1b and Extended Data Fig 1a-1e). Red pulp endothelial cells and perivascular stromal cells expressed high levels of Scf-GFP, irrespective of EMH induction (Fig. 1a-1c and Extended Data Fig. 1d, 1e). In white pulp, Scf-GFP was expressed by many fewer stromal cells and central arteriolar endothelial cells (Fig. 1b and Extended Data Fig. 1e). Cxcl12-DsRed was not expressed by endothelial cells but was expressed by a subset of Scf-GFP+ perivascular stromal cells, primarily around red pulp sinusoids and to a lesser extent around white pulp central arterioles (Fig. 1a-1c and Extended Data Fig. 1d, 1e).
Figure 1. Endothelial cells and perivascular stromal cells in the red pulp express Scf and Cxcl12 and proliferate upon induction of EMH.
a, b, Scf-GFP and Cxcl12-DsRed were mainly expressed by stromal cells in the red pulp (RP) of normal spleens. (b) High-magnification view of the boxed area in (a). Dashed lines depict the boundary between white pulp (WP) and red pulp (RP). Arrow indicates central arteriole in the WP, around which rare stromal cells expressed Cxcl12-DsRed. c, Splenic RP from ScfGFP; Cxcl12DsRed mice had VE-cadherin+ endothelial cells (arrows) that expressed Scf-GFP and VE-cadherin− stromal cells (arrowheads) that expressed Scf-GFP and sometimes Cxcl12-DsRed. d-f, Flow cytometric analysis of enzymatically dissociated spleen cells from ScfGFP; Cxcl12DsRed mice. Scf-GFP was expressed by VE-cadherin+ endothelial cells and PDGFRβ+VE-cadherin− stromal cells, a subset of which also expressed Cxcl12-DsRed (d). Most VE-cadherin+ endothelial cells were positive for Scf-GFP but negative for Cxcl12-DsRed (e). Most Cxcl12-DsRed+ cells were positive for Scf-GFP (f). Data in a-f represent mean±s.d. from 3 mice from 3 independent experiments. g-l, The frequencies and absolute numbers of Scf-GFP+ cells (g, i) and Cxcl12-DsRed+ cells (h, j) significantly increased upon induction of EMH by Cy+21d G-CSF (+EMH). k, l, BrdU was co-administered to ScfGFP (k) or Cxcl12DsRed mice (l) along with G-CSF for 7 days after cyclophosphamide treatment. Data represent mean±s.d. from 3 independent experiments. The numbers of mice per treatment are shown on the bars in panels g-l. Two-tailed student's t-tests were used to assess statistical significance (**P<0.01, ***P<0.001).
Scf-GFP+ cells were 0.48±0.10% of enzymatically dissociated adult spleen cells (Fig. 1d) and Cxcl12-DsRed+ were 0.031±0.011% (Fig. 1f). Most Scf-GFP+ cells (75±5.8%) were VE-cadherin+CD45−Ter119− endothelial cells (Fig. 1d): 85±8.2% of all VE-cadherin+CD45−Ter119− spleen endothelial cells were Scf-GFP+ and none expressed Cxcl12-DsRed (Fig. 1e). Non-endothelial Scf-GFP+ cells were virtually all PDGFRβ+CD45−Ter119− stromal cells (Fig. 1d). Some Scf-GFP+ stromal cells (22±3.8%) also expressed Cxcl12-DsRed (Fig. 1d). Virtually all Cxcl12-DsRed+ stromal cells expressed Scf-GFP (Fig. 1f). Therefore, Scf was expressed by VE-cadherin+ endothelial cells and PDGFRβ+ stromal cells while Cxcl12 was expressed by a minority of Scf-expressing stromal cells in adult spleen.
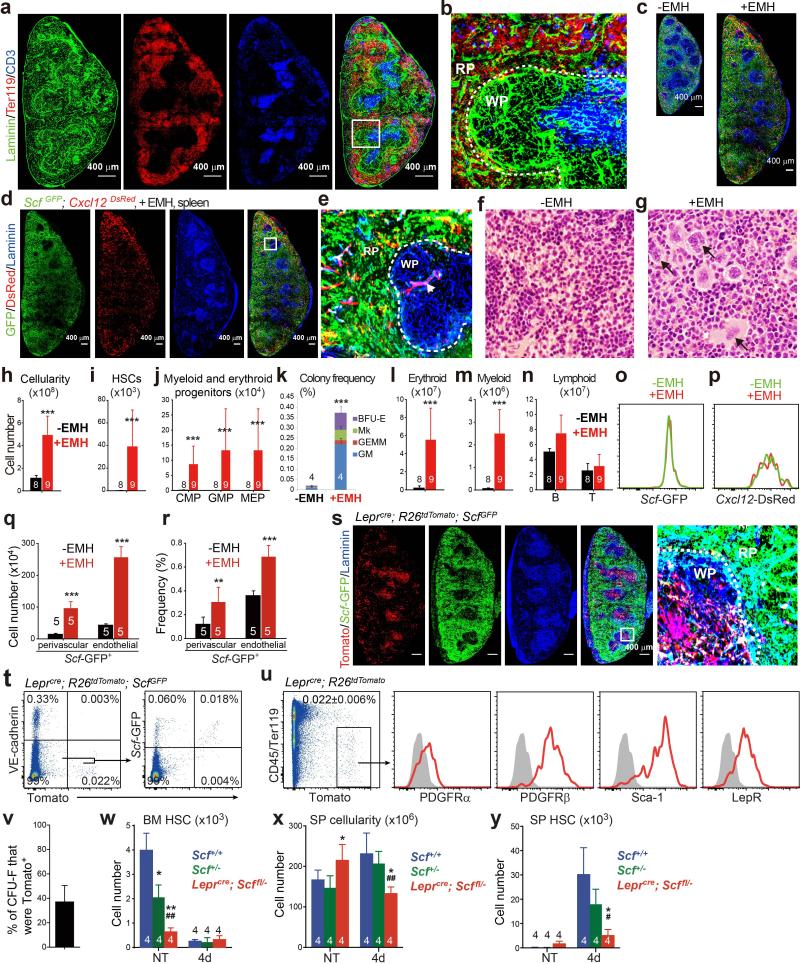
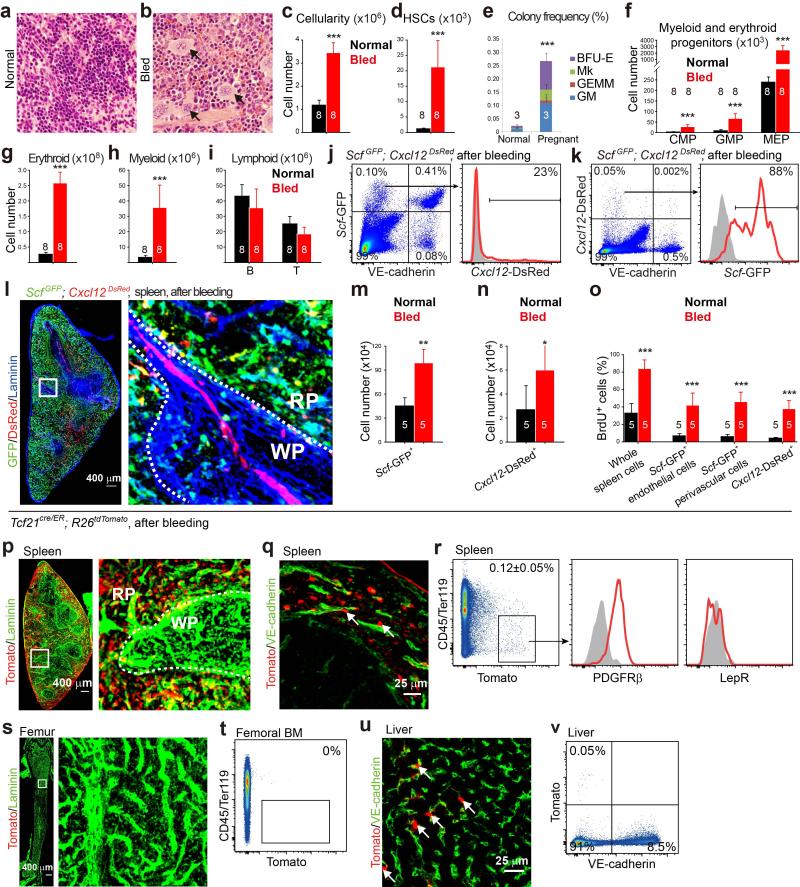
EMH induction did not appear to alter spleen Scf-GFP or Cxcl12-DsRed expression (Fig. 1a versus Extended Data Fig. 1d). Flow cytometric analysis showed no change in the fluorescence intensity of individual Scf-GFP+ or Cxcl12-DsRed+ spleen cells after EMH induction (Extended Data Fig. 1o and 1p). However, the frequencies and absolute numbers of Scf-GFP and Cxcl12-DsRed cells increased significantly upon EMH induction (Fig. 1g-1j, Extended Data Fig. 1q and 1r). These cells rarely divided in normal adult spleen but proliferated upon EMH induction (Fig. 1k and 1j).
LepR+ stromal cells are the main sources of Scf and Cxcl12 for HSC maintenance in the bone marrow18-20. In the spleens of Leprcre; R26tdTomato mice, recombination occurred mainly in the white pulp where HSCs are not observed14 (Extended Data Fig. 1s). Only about 20% of Scf-GFP+ stromal cells expressed LepR (Extended Data Fig. 1t). LepR+ cells were PDGFRβ+VE-cadherin− stromal cells that accounted for 37±13% of CFU-F formed by enzymatically dissociated spleen cells (Extended Data Fig. 1u and 1v).
Consistent with our prior study19, Leprcre; Scffl/− mice had significantly fewer CD150+CD48−LSK HSCs in the bone marrow and significantly increased spleen cellularity relative to Scf+/− and Scf+/+ controls (Extended Data Fig. 1w and 1x). Upon EMH induction by Cy+4d G-CSF, Leprcre; Scffl/− mice exhibited significant declines in spleen cellularity and spleen HSC number relative to controls (Extended Data Fig. 1x and 1y). While LepR+ perivascular stromal cells could contribute to the EMH niche in adult spleen, the impaired EMH in these mice may also reflect bone marrow HSC depletion prior to EMH induction (Extended Data Fig. 1w).
Tcf21+ perisinusoidal stromal cells express Scf
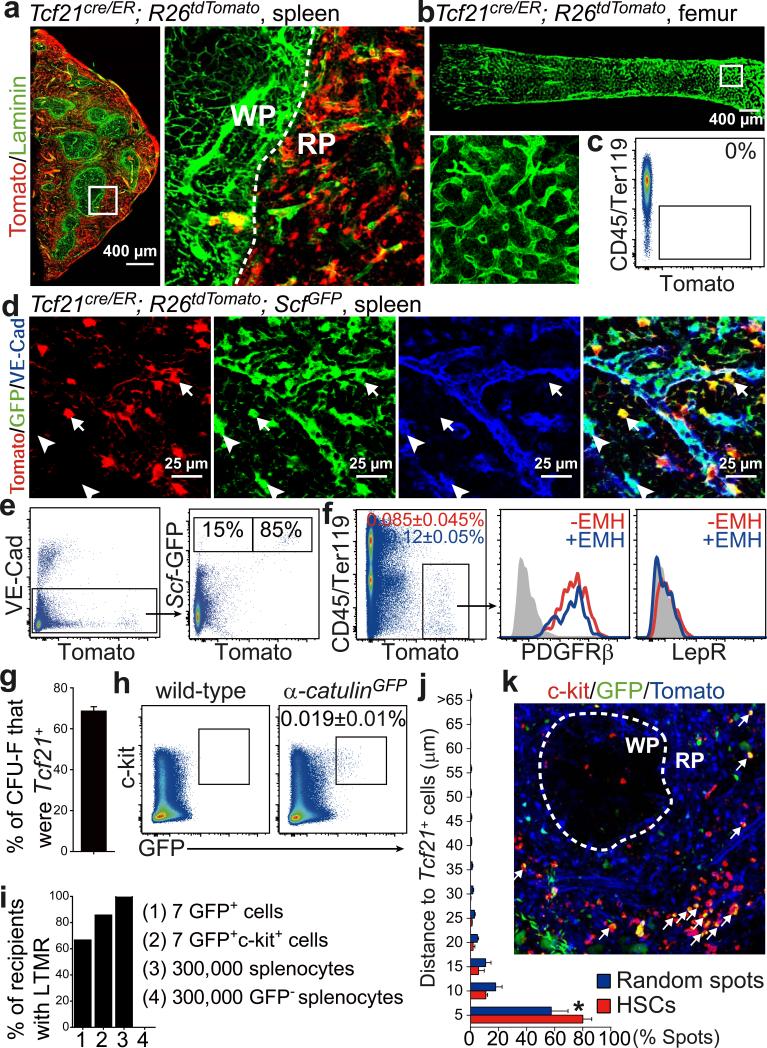
To identify Cre alleles that recombine in spleen, but not bone marrow, stromal cells we assessed the gene expression profile of spleen Scf-GFP+VE-cadherin− stromal cells (Extended Data Table 1). After testing a number of Cre alleles (see Extended Data Fig. 2), we found that Tcf21-Cre/ER21 recombined efficiently in spleen Scf-GFP+ stromal cells (Fig. 2a) but not in bone marrow (Fig. 2b and 2c). Tcf21cre/ER; R26tdTomato mice gavaged with tamoxifen for 12 days at 4-6 weeks of age expressed Tomato in Scf-GFP+ stromal cells throughout red pulp (Fig. 2a and 2d) but only in rare white pulp cells (Fig. 2a) and not in endothelial cells (Fig. 2d and 2e). Tomato+CD45−Ter119− stromal cells from enzymatically dissociated Tcf21cre/ER; R26tdTomato spleens accounted for 0.085±0.045% of spleen cells and 69±2% of spleen CFU-F (Fig. 2f and 2g). These cells were PDGFRβ+ and LepR negative (Fig. 2f).
Figure 2. During EMH most HSCs localize adjacent to Tcf21+ stromal cells in the red pulp.
a, Tamoxifen-treated adult Tcf21cre/ER; R26tdTomato mice exhibited widespread Tomato expression by perivascular stromal cells in the red pulp (RP). b, c, No Tomato expression in bone marrow from tamoxifen-treated Tcf21cre/ER; R26tdTomato mice. d, e, Most Scf-GFP+VE-cadherin− stromal cells were Tomato+ (arrows) whereas Scf-GFP+VE-cadherin+ endothelial cells were Tomato− (arrowhead). f, Tomato+CD45−Ter119− stromal cells from enzymatically dissociated spleen from Tcf21cre/ER; R26tdTomato mice were positive for PDGFRβ but negative for LepR, irrespective of EMH induction by Cy+G-CSF. g, Percentage of all CFU-F colonies formed by enzymatically dissociated Tcf21cre/ER; R26tdTomato spleen cells that were Tomato+. Macrophage colonies were excluded by staining with anti-CD45 antibody. h, α-catulin-GFP+c-kit+ HSCs represented 0.019±0.01% of dissociated spleen cells in α-catulinGFP mice with EMH. i, α-catulin-GFP+c-kit+ splenocytes were highly enriched for long-term multilineage reconstituting (LTMR) HSCs. j, k, Deep imaging of α-catulin-GFP+c-kit+ HSCs (arrows in k) in optically cleared spleen from a Tcf21cre/ER; R26tdTomato; α-catulinGFP mouse with EMH induced by Cy+21d G-CSF. The distance from α-catulin-GFP+c-kit+ HSCs or random spots to Tomato+ stromal cells (j; *p<0.05 by two-tailed student's t-test). α-catulin-GFP+c-kit+ HSCs were exclusively in the RP (k; see Extended Data Fig. 3f for a low magnification view). All data reflect mean±s.d. from 3 mice in 3 independent experiments.
In the liver, Scf-GFP was exclusively expressed by VE-cadherin+ endothelial cells (Extended Data Fig. 2a and 2b). Tcf21-Cre/ER recombined in 0.09% of liver cells, none of which expressed Scf-GFP (Extended Data Fig. 2a and 2c). The Tcf21-Cre/ER recombination pattern did not significantly change in the spleen (Fig. 2f and Extended Data Fig. 2d, 2e), bone marrow (Extended Data Fig. 2f and 2g), or liver (Extended Data Fig.2h and 2i) upon EMH induction by Cy+21d G-CSF.
c-kit+ haematopoietic progenitors were almost exclusively within the red pulp in the normal spleen (Extended Data Fig. 3a and 3b) and after EMH induction (Fig. 2k). To assess HSCs localization we used a new technique that permits deep-imaging of α-catulin-GFP+c-kit+ HSCs in optically cleared haematopoietic tissues22. In the spleens of mice treated with Cy+4d G-CSF, only 0.019±0.01% of splenocytes were α-catulin-GFP+c-kit+ (Fig. 2h). All long-term multilineage reconstituting cells in the spleen were α-catulin-GFP+ and 28% of α-catulin-GFP+c-kit+ spleen cells gave long-term multilineage reconstitution in primary (Fig. 2i) and secondary irradiated recipient mice (data not shown).
After antibody staining of a large segment of Tcf21cre/ER; R26tdTomato; α-catulinGFP spleen, we cleared the tissue (Extended Data Fig. 3c and 3d) then imaged to a depth of 300 μm and digitally reconstructed the tissue (Extended Data Fig. 3e, 3f and Supplementary video 1). α-catulin-GFP+c-kit+ HSCs were found exclusively within the red pulp, where 80% were within 5μm of Tomato+ stromal cells (Fig. 2j).
EMH requires SCF and CXCL12 from Tcf21+ cells
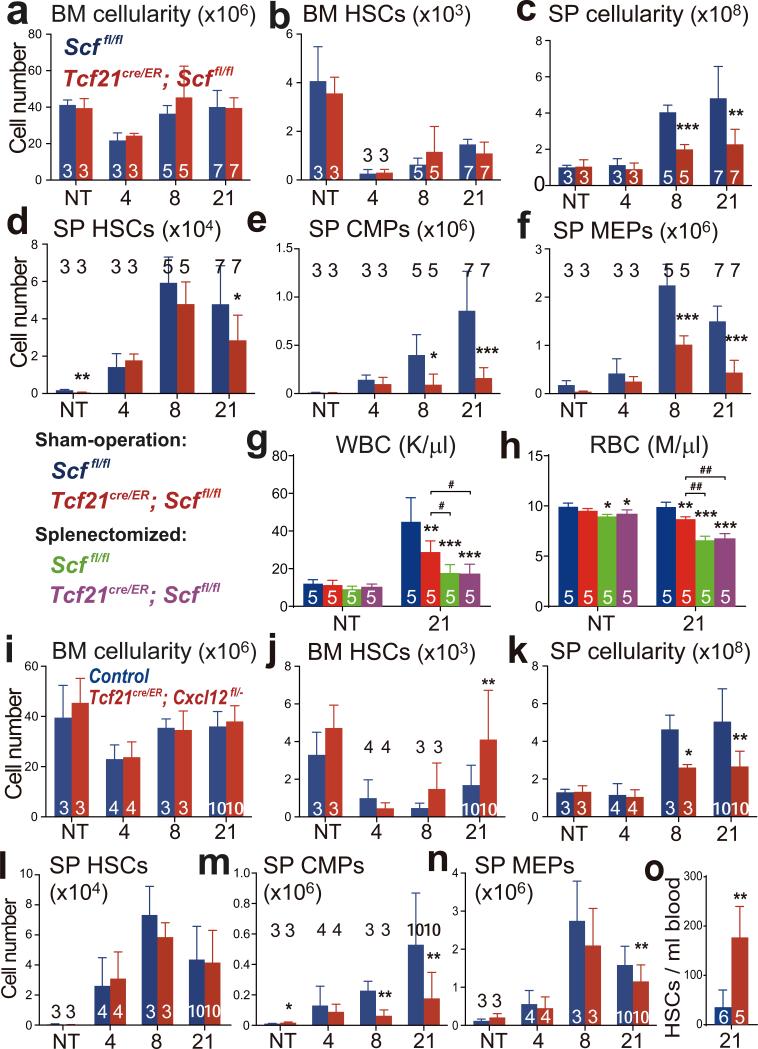
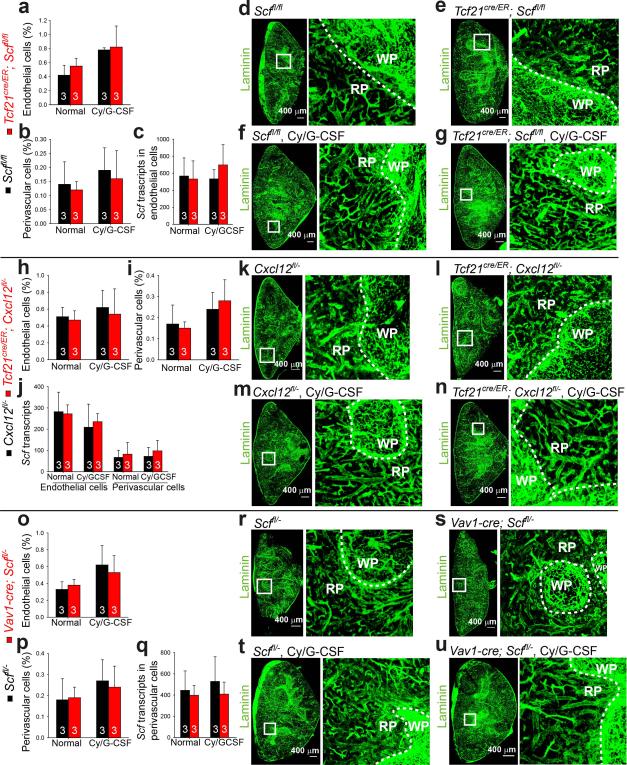
To test if Tcf21-Cre/ER-expressing perivascular cells promote EMH, we treated 4-6-week-old Tcf21cre/ER; Scffl/fl and littermate control mice with tamoxifen for 12 days. A month later, bone marrow and spleen cellularity, blood cell counts, and bone marrow haematopoiesis were similar in Tcf21cre/ER; Scffl/fl mice and littermate controls (Fig. 3a-3f and Extended Data Fig. 3g-3l). Then we treated Tcf21cre/ER; Scffl/fl mice and littermate controls with cyclophosphamide followed by 4, 8, or 21 days of G-CSF. Tcf21cre/ER; Scffl/fl mice did not differ from controls with respect to bone marrow cellularity (Fig. 3a) or the numbers of HSCs (Fig. 3b), common myeloid progenitors (CMPs23), granulocyte-monocyte progenitors (GMPs23), or megakaryocyte-erythroid progenitors (MEPs23) in the bone marrow after Cy+G-CSF treatment (Extended Data Fig. 3j-3l). In contrast, Tcf21cre/ER; Scffl/fl mice had significantly fewer splenocytes (Fig. 3c), spleen HSCs (Fig. 3d), CMPs (Fig. 3e), GMPs (Extended Data Fig. 3m) and MEPs (Fig. 3f) relative to littermate controls after 8 to 21 days of G-CSF treatment. We did not detect any difference between Tcf21cre/ER; Scffl/fl mice and littermate controls in terms of vascular or stromal cell morphology in the spleen, with or without induction of EMH (Extended Data Fig. 4a-4g). Conditional deletion of Scf with Tcf21-Cre/ER thus depletes HSCs and reduces EMH in the spleen without affecting bone marrow haematopoiesis.
Figure 3. Tcf21-expressing stromal cells are an important source of Scf and Cxcl12 for EMH in the spleen.
a-f, Tcf21cre/ER; Scffl/fl and Scffl/fl control mice were treated with tamoxifen then examined a month later either under normal conditions (not treated, NT) or after treatment with cyclophosphamide plus 4, 8, or 21 days of G-CSF to induce EMH. The number of bone marrow cells (a) and bone marrow CD150+CD48−LSK HSCs (b) in one femur plus one tibia as well as spleen cellularity (c), and the numbers of HSCs (d), common myeloid progenitors (CMPs, e) and megakaryocyte/erythroid progenitors (MEPs, f), in the spleen. g, h, Sham-operated and splenectomized mice were treated with Cy+21d G-CSF one month after surgery: white blood cell (WBC; g) and red blood cell (RBC; h) counts. i-o, Tcf21cre/ER; Cxcl12fl/− and Cxcl12+/− or Cxcl12fl/− control mice were treated with tamoxifen then examined a month later either under normal conditions (NT) or after treatment with cyclophosphamide plus 4, 8, or 21 days of G-CSF to induce EMH. The number of bone marrow cells (i) and bone marrow HSCs (j) in one femur plus one tibia as well as spleen cellularity (k), numbers of HSCs (l), CMPs (m) and MEPs (n) in the spleen. o, Number of HSCs per ml of blood in tamoxifen-treated control and Tcf21cre/ER; Cxcl12fl/− mice after Cy+21d G-CSF. The numbers of mice per treatment are shown in each bar in each panel. All panels reflect mean±s.d. from three independent experiments. * indicates statistical significance relative to sham-operated Scffl/fl mice while # indicates statistical significance among other treatments (* or # P<0.05, ** or ## P<0.01, *** P<0.001).
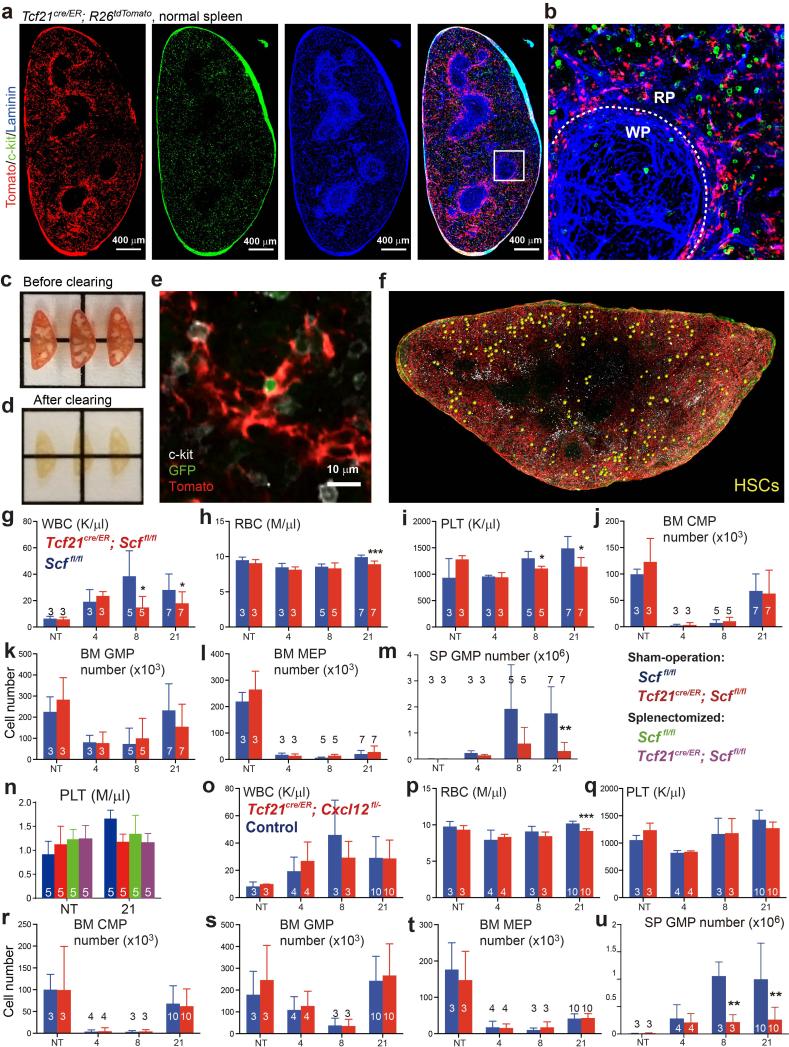
Red (RBC) and white blood cell (WBC) counts were significantly lower in Tcf21cre/ER; Scffl/fl mice as compared to controls after 8 to 21 days of G-CSF treatment (Extended Data Fig. 3g-3i). Splenectomy significantly reduced RBC and WBC counts in mice treated with Cy+G-CSF, demonstrating that splenic EMH is necessary for the recovery of blood cell counts (Fig. 3g, 3h and Extended Data Fig. 3n). However, conditional deletion of Scf by Tcf21-Cre/ER did not further reduce blood cell counts in splenectomized mice (Fig. 3g and 3h). SCF expression by Tcf21+ stromal cells in the spleen is thus necessary for the regeneration of blood cells after Cy+G-CSF treatment.
Bone marrow cellularity and bone marrow haematopoiesis were similar in Tcf21cre/ER; Cxcl12fl/− mice and littermate controls, before and after Cy+G-CSF treatment (Fig. 3i, 3j and Extended Data Fig. 3r-3t). However, Tcf21cre/ER; Cxcl12fl/− mice exhibited significantly reduced spleen cellularity (Fig. 3k) and numbers of spleen CMPs, GMPs, and MEPs (Fig. 3m, 3n and Extended Data Fig. 3u) relative to controls after 8 to 21 days of G-CSF treatment. Although the number of HSCs in the spleens of Tcf21cre/ER; Cxcl12fl/− mice did not significantly differ from littermate controls (Fig. 3l), HSC numbers were significantly elevated in the blood (Fig. 3o) and in the bone marrow (Fig. 3j) of Tcf21cre/ER; Cxcl12fl/− mice after 21 days of G-CSF treatment. This suggests that some HSCs were mobilized from the spleens of Tcf21cre/ER; Cxcl12fl/− mice. Tcf21cre/ER; Cxcl12fl/− mice also had significantly reduced RBC counts after 21 days of G-CSF treatment (Extended Data Fig. 3o-3q). We did not detect any difference between Tcf21cre/ER; Cxcl12fl/− mice and littermate controls in terms of the frequency or morphology of vascular or stromal cells in the spleen, with or without EMH (Extended Data Fig. 4h-4n). Tcf21-Cre/ER-expressing stromal cells are thus an important source of CXCL12 for spleen EMH but not bone marrow haematopoiesis.
EMH requires SCF from endothelial cells
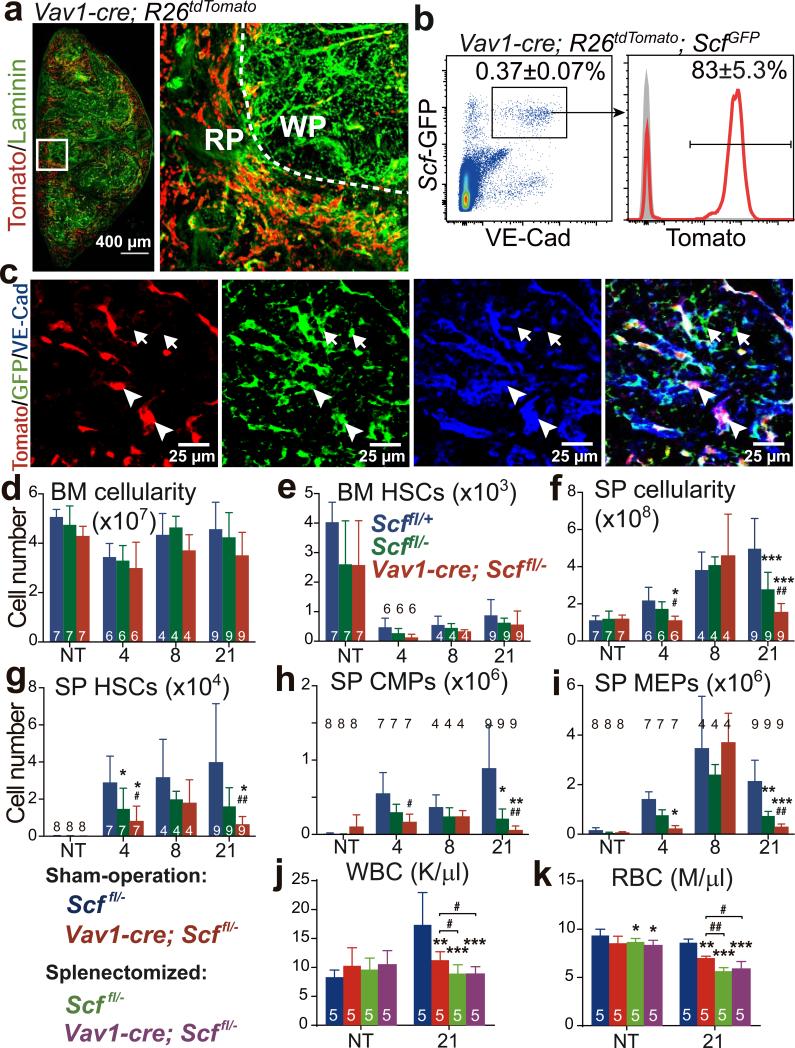
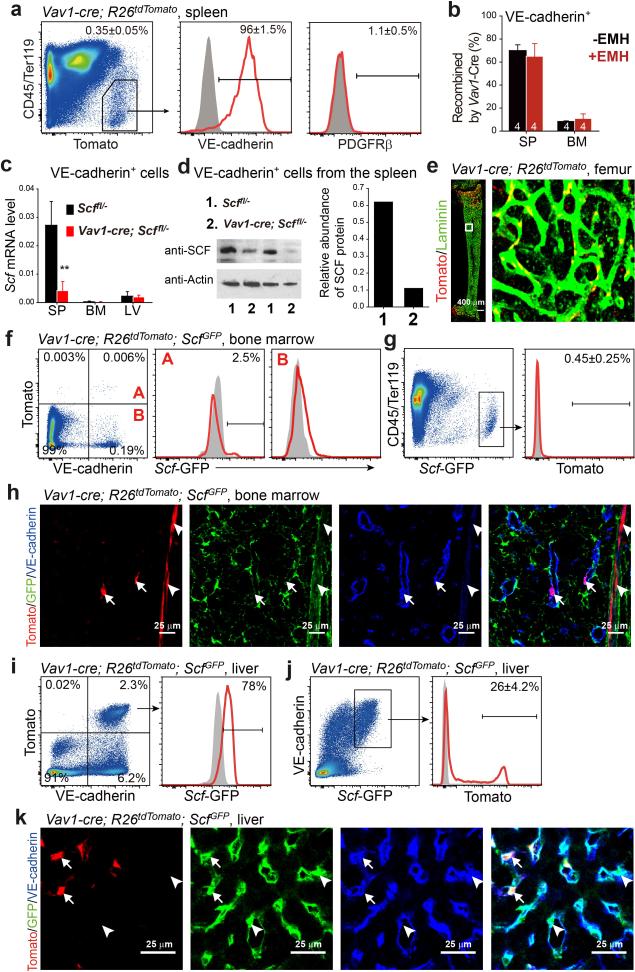
We discovered that Vav1-cre recombines efficiently in spleen, but not bone marrow, endothelial cells. Vav1-cre; R26tdTomato mice recombined throughout the red pulp in VE-cadherin+Scf-GFP+ cells but only in rare white pulp cells (Fig. 4a-4c). VE-cadherin+Scf-GFP+ cells accounted for 0.37±0.07% of enzymatically dissociated spleen cells and 83±5.3% of these cells recombined with Vav1-cre (Fig. 4b). These cells were negative for PDGFRβ (Extended Data Fig. 5a). 70±5% of VE-cadherin+ endothelial cells were Tomato+ in the spleens of Vav1-cre; R26tdTomato mice but only 8.4±0.5% were Tomato+ in bone marrow (Extended Fig. 5b, 5e-5h). Endothelial cells from Vav1-cre; Scffl/− mice exhibited a 6.5-fold reduction in Scf transcript levels (Extended Data Fig. 5c) and a 5.6-fold reduction in SCF protein (Extended Data Fig. 5d) relative to endothelial cells from Scffl/− controls.
Figure 4. Endothelial cells are an important source of Scf for EMH in the spleen.
a, Vav1-cre; R26tdTomato mice exhibited vascular Tomato expression throughout the splenic red pulp (RP). Tomato was also expressed by haematopoietic cells in these mice but levels of Tomato expression in endothelial cells were ~10-100 fold higher than in haematopoietic cells. Therefore short-exposure images showed mainly Tomato fluorescence in endothelial cells. b, c, Vav1-Cre recombined in VE-cadherin+Scf-GFP+ endothelial cells (arrowheads in c) but not in VE-cadherin−Scf-GFP+ perivascular stromal cells (arrows in c). d-i, Vav1-cre; Scffl/− mice and Scffl/+, Scffl/− controls were not treated (NT) or treated with cyclophosphamide plus 4, 8, or 21 days of G-CSF to induce EMH. Data show the number of bone marrow cells (d) and bone marrow HSCs (e) in one femur plus one tibia as well as spleen cellularity (f) and the numbers of HSCs (g), CMPs (h) and MEPs (i) in the spleen. j, k, WBC (j) and RBC (k) counts in splenectomized and sham-operated mice before and after Cy+21day G-CSF treatment. The numbers of mice per treatment are shown in the bars in each panel. All data reflect mean±s.d. from 3 (a-c; j, k) or 6 (d-i) independent experiments. * indicates statistical significance relative to Scffl/+ mice while # indicates statistical significance between Scffl/− and Vav1-cre; Scffl/− mice (d-i); * indicates statistical significance relative to sham-operated Scffl/− mice while # indicates statistical significance between other treatments (j, k) (* or # P<0.05, ** or ## P<0.01, *** P<0.001).
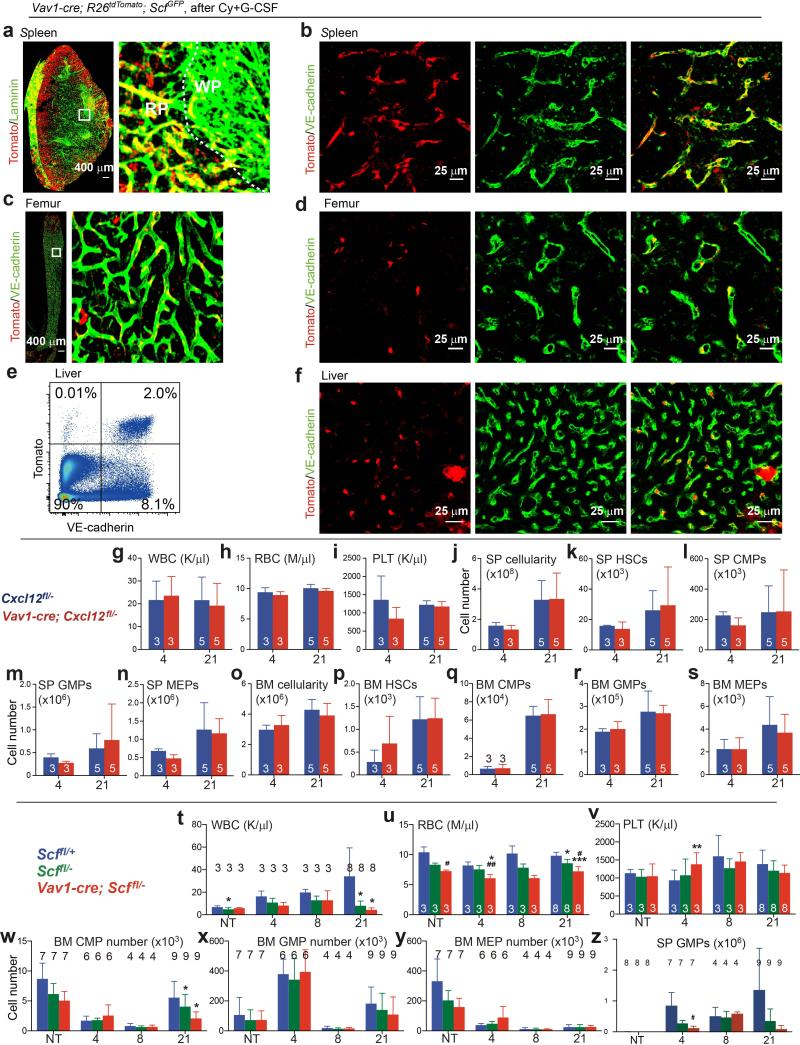
In the livers of Vav1-cre; R26tdTomato; ScfGFP mice recombination occurred in 26±4.2% of VE-cadherin+Scf-GFP+ cells (Extended Data Fig. 5i-5k). Upon induction of EMH by Cy+G-CSF, Vav1-Cre recombination did not significantly change in the spleen (Extended Data Fig. 5b, 6a and 6b), bone marrow (Extended Data Fig. 5b, 6c and 6d), or liver (Extended Data Fig. 6e and 6f).
Cxcl12 was not expressed by spleen endothelial cells (Fig. 1e). Consistent with this, Vav1-cre; Cxcl12fl/− mice had normal blood counts, cellularity, and numbers of HSCs, CMPs, GMPs, and MEPs in bone marrow and spleen after Cy+G-CSF (Extended Data Fig. 6g-6s).
Vav1-Cre also recombines in haematopoietic cells24 but haematopoietic cells do not express Scf and Vav1-cre; Scffl/− mice have normal HSC frequency and haematopoiesis in bone marrow18,19. Prior to EMH induction with Cy+G-CSF, Vav1-cre; Scffl/− mice did not significantly differ from Scffl/− controls with respect to bone marrow or spleen cellularity, or the numbers of HSCs, CMPs, GMPs, or MEPs in the bone marrow or spleen (Fig. 4d-4i and Extended Data Fig. 6w-6z). After Cy+G-CSF treatment, bone marrow cellularity and numbers of bone marrow HSCs, CMPs, GMPs, or MEPs in Vav1-cre; Scffl/− mice were normal (Fig. 4d, 4e and Extended Data Fig. 6w-6y). However, RBC counts, spleen cellularity, and the numbers of spleen HSCs, CMPs, and MEPs declined in Vav1-cre; Scffl/− mice relative to Scffl/− controls (Fig. 4f-4i; Extended Data Fig. 6t-6v).
The decline in blood cell counts in Vav1-cre; Scffl/− mice after EMH induction was caused by reduced spleen EMH because splenectomy significantly reduced RBC and WBC counts but conditional deletion of Scf in splenectomized Vav1-cre; Scffl/− mice had no further effect on blood cell counts (Fig. 4j and 4k). We did not detect any difference between Vav1-cre; Scffl/− mice and controls in terms of the frequency or morphology of vascular or stromal cells in the spleen (Extended Data Fig. 4o-4u). Endothelial Scf expression is thus necessary for splenic EMH and the recovery of blood cell counts after Cy+G-CSF.
The splenic EMH niche during pregnancy
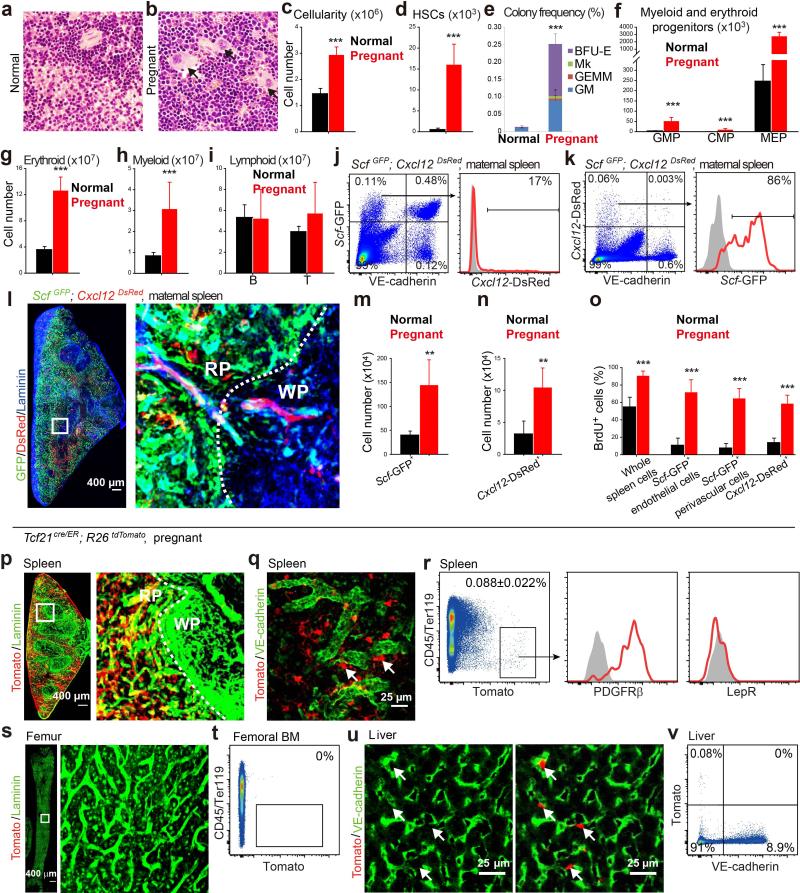
Erythropoiesis and myelopoiesis significantly increased in the red pulp during pregnancy, profoundly increasing spleen cellularity, HSC number, and progenitor numbers relative to non-pregnant mice (Extended Data Fig. 7a-7i). Just as in Cy+G-CSF-treated mice, Scf-GFP was largely expressed by endothelial and perivascular stromal cells in the red pulp and Cxcl12-DsRed was expressed by a subset of the Scf-GFP+ stromal cells (Extended Data Fig. 7j-7l). Pregnancy induced these cells to proliferate, significantly expanding their numbers (Extended Data Fig. 7m-7o). In pregnant mice, Tcf21-Cre/ER recombined in spleen PDGFRβ+LepR− stromal cells but not in bone marrow and rarely in liver (Extended Data Fig. 7p-7v). Vav1-cre, Scffl/fl mice were infertile, preventing us from testing the endothelial contribution to EMH during pregnancy.
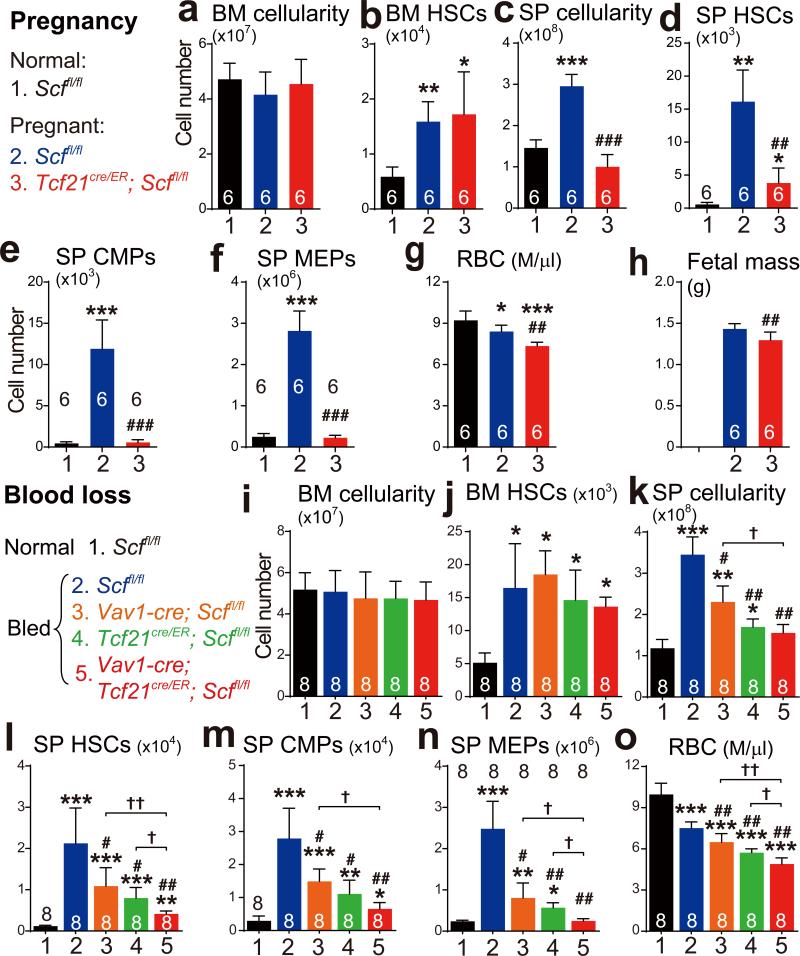
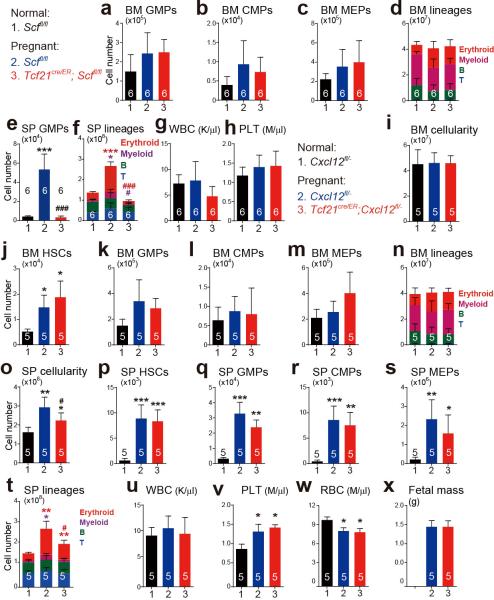
Pregnant Tcf21cre/ER; Scffl/fl females did not differ from Scffl/fl control females in terms of bone marrow cellularity (Fig. 5a), or the numbers of HSCs (Fig. 5b), GMPs, CMPs, or MEPs in the bone marrow (Extended Data Fig. 8a-8d). In contrast, pregnant Tcf21cre/ER; Scffl/fl females exhibited significantly lower spleen cellularity and numbers of HSCs, GMPs, CMPs, MEPs, myeloid and erythroid cells in the spleen as compared to pregnant Scffl/fl females (Fig. 5c-5f and Extended Data Fig. 8e, 8f). Pregnant Tcf21cre/ER; Scffl/fl females had significantly lower RBC counts than pregnant Scffl/fl controls (Fig. 5g), and significantly lower fetal mass (Fig. 5h). SCF from Tcf21+ perivascular cells is thus necessary for splenic EMH and for the expansion of erythropoiesis during pregnancy.
Figure 5. Scf from endothelial cells and Tcf21+ stromal cells is necessary for splenic EMH and adequate erythropoiesis after bleeding or during pregnancy.
a-h, 4-6 month-old female mice that had been treated with tamoxifen at least two months earlier were mated with normal wild-type males. Normal females and pregnant females at gestation day 18.5 were analyzed: the number of bone marrow cells (a) and bone marrow HSCs (b) in one femur plus one tibia as well as spleen cellularity (c), and the numbers of HSCs (d), CMPs (e) and MEPs (f) in the spleen. RBC counts (g) and fetal mass (h). i-o, 4-6 month-old mice with the indicated genetic backgrounds were repeatedly bled over a two week period then analyzed: the number of bone marrow cells (i) and bone marrow HSCs (j in one femur plus one tibia as well as spleen cellularity (k), and the numbers of HSCs (l), CMPs (m) and MEPs (n) in the spleen. RBC counts (o). The numbers of mice per treatment are shown in each bar of each panel. All data reflect mean±s.d. from four (a-h) or three (i-o) independent experiments. * indicates statistical significance relative to normal mice; # indicates statistical significance between Scf mutant mice and control mice after bleeding or pregnancy; † indicate statistical significance between single mutants and compound mutants (*, # or † P<0.05, **, ## or †† P<0.01, ***or ### P<0.001).
Pregnant Tcf21cre/ER; Cxcl12fl/− females also had significantly reduced splenic cellularity and splenic erythropoiesis relative to pregnant Cxcl12fl/− controls, without any changes in bone marrow haematopoiesis (Extended Data Fig. 8i-8x).
The splenic EMH niche after blood loss
Repeated bleeding significantly increased erythropoiesis and myelopoiesis in the red pulp, increasing spleen cellularity, HSC number, and progenitor numbers relative to non-bled controls (Extended Data Fig. 9a-9i). Just as in Cy+G-CSF-treated mice, Scf-GFP was largely expressed by endothelial cells and perivascular stromal cells in the red pulp while Cxcl12-DsRed was expressed by a subset of Scf-GFP+ stromal cells (Extended Data Fig. 9j-9l). Blood loss induced the proliferation of these cells, significantly expanding their numbers (Extended Data Fig. 9m-9o). In bled mice, Tcf21-Cre/ER recombined in red pulp PDGFRβ+LepR− stromal cells, but not in bone marrow and rarely in liver (Extended Data Fig. 9p-9v). Vav1-Cre recombined in 66±4.2% of spleen endothelial cells, mainly in the red pulp, but only in 7.5±4.0% of bone marrow endothelial cells and 25±5.8% of liver endothelial cells (Extended Data Fig. 10a-10h).
Bled Tcf21cre/ER; Scffl/fl mice or Vav1-cre; Scffl/fl mice did not differ from bled Scffl/fl controls in bone marrow cellularity (Fig. 5i), or the numbers of HSCs (Fig. 5j), GMPs, CMPs, or MEPs in the bone marrow (Extended Data Fig. 10i-10l). In contrast, bled Tcf21cre/ER; Scffl/fl mice and Vav1-cre; Scffl/fl mice each had significantly lower RBC counts, spleen cellularity, and numbers of HSCs, GMPs, CMPs, MEPs, myeloid and erythroid cells in the spleen as compared to bled Scffl/fl controls (Fig. 5l-5o and Extended Data Fig. 10m-10p). Tcf21+ stromal cells and endothelial cells are thus necessary for EMH in the spleen and for the expansion of erythropoiesis after bleeding.
Endothelial and Tcf21+ stromal cells had additive effects on splenic EMH and the recovery of RBC counts after bleeding. Bled Vav1-cre; Tcf21cre/ER; Scffl/fl mice had similar bone marrow cellularity and numbers of HSCs in the bone marrow as bled Scffl/fl controls (Fig. 5i and 5j). However, they had significantly reduced RBC counts, spleen cellularity, and numbers of HSCs, MEPs, and erythroid cells in the spleen as compared to bled Scffl/fl mice, bled Vav1-cre; Scffl/fl mice, and bled Tcf21cre/ER; Scffl/fl mice (Fig. 5k-5n and Extended Data Fig. 10p).
Bled Tcf21cre/ER; Cxcl12fl/− mice also had significantly reduced cellularity, MEPs, and erythroid cells in the spleen as well as significantly reduced RBC counts as compared to bled Cxcl12fl/− controls, without any differences in bone marrow haematopoiesis (Extended Data Fig. 10q-10ae).
The EMH niche in mouse spleen is created by endothelial cells and Tcf21-expressing stromal cells associated with red pulp sinusoids and is functionally important for haematopoietic recovery from a range of stresses. A prior study15 detected CXCL12 expression in endothelial cells in human spleens. This suggests that endothelial cells are also a component of the EMH niche in humans but there may be species differences in CXCL12 expression among niche cells. It is not clear whether there is any relationship between the Cxcl12-abundant reticular (CAR) cells that are part of the bone marrow niche25 and the Cxcl12-expressing stromal cells in the splenic EMH niche. While bone marrow CAR cells are LepR+ and Tcf21 negative, spleen CAR cells are Tcf21+ and LepR negative.
METHODS
Mice
All mice were maintained on a C57BL/6 background, including ScfGFP 19, Scffl/+ 19, Cxcl12DsRed 18, Cxcl12fl/+ 18, R26tdTomato 26, Vav1-cre24, Leprcre 27, Tcf21cre/ER 21 and α-catulinGFP. To induce CreER activity in Tcf21cre/ER mice, 4-6-week-old mice were administered 2 mg tamoxifen (Sigma) daily by oral gavage for 12 consecutive days. For induction of EMH, mice were injected at day 0 with a single dose of 4 mg cyclophosphamide followed by daily injections of 5 μg G-CSF for 4 to 21 days. Both male and female mice were used. All mice were housed in the Animal Resource Center at the University of Texas Southwestern Medical Center (UTSW). All procedures were approved by the UTSW Institutional Animal Care and Use Committee.
Flow cytometric analysis of haematopoietic cells
Bone marrow cells were isolated by flushing the femur or tibia with Ca2+ and Mg2+ free HBSS with 2% heat-inactivated bovine serum using a 3 ml syringe fitted with a 25-gauge needle. Spleen cells were obtained by crushing the spleen between two frosted slides. The cells were dissociated to a single cell suspension by gently passing through the needle several times and then filtering through a 40 μm nylon mesh. Blood was collected by cardiac puncture, and white blood cells were isolated by ficoll centrifugation according to the manufacturer's instructions (GE Healthcare). The following antibodies were used to isolate HSCs: anti-CD150 (TC15-12F12.2), anti-CD48 (HM48-1), anti-Sca-1 (E13-161.7), anti-c-kit (2B8) and the following antibodies against lineage markers (anti-Ter119, anti-B220 (6B2), anti-Gr1 (8C5), anti-CD2 (RM2-5), anti-CD3 (17A2), anti-CD5 (53-7.3) and anti-CD8 (53-6.7)). Haematopoietic progenitors were identified by flow cytometry using the following antibodies: anti-Sca-1 (E13-161.7), anti-c-kit (2B8) and the following antibodies against lineage markers (anti-Ter119, anti-B220 (6B2), anti-Gr1 (8C5), anti-CD2 (RM2-5), anti-CD3 (17A2), anti-CD5 (53-7.3) and anti-CD8 (53-6.7)), anti-CD34 (RAM34), anti-CD135 (Flt3) (A2F10), anti-CD16/32 (FcγR) (93), anti-CD127 (IL7Rα) (A7R34), anti-CD24 (M1/69), anti-CD43 (1B11), anti-B220 (6B2), anti-IgM (II/41), anti-CD3 (17A2), anti-Gr-1 (8C5), anti-Mac-1 (M1/70), anti-CD41 (MWReg30), anti-CD71 (C2) and anti-Ter119. DAPI was used to exclude dead cells. Antibodies were obtained from eBioscience or BD Bioscience.
Flow cytometric analysis of stromal cells
To isolate bone marrow stromal cells the marrow was gently flushed out of the bone marrow cavity with a 3-ml syringe fitted with a 23-guage needle and then transferred into 1 ml pre-warmed bone marrow digestion solution (200 U/ml DNase I (Sigma), 250 μg/ml LiberaseDL (Roche) in HBSS plus Ca2+ and Mg2+) and incubated at 37°C for 30 minutes with gentle shaking. To isolate splenic stromal cells, the spleen capsule was cut into ~1 mm3 fragments using scissors and then digested as above in spleen digestion solution (200 U/ml DNase I, 250 μg/ml LiberaseDL, 1 mg/ml Collagenase, type 4 (Roche) and 500 μg/ml Collagenase D (Roche) in HBSS plus Ca2+ and Mg2+). After a brief vortex, the spleen fragments were allowed to sediment for ~3 minutes and the supernatant was transferred to another tube on ice. The sedimented (undigested) spleen fragments were subjected to a second round of digestion. The two fractions of digested cells were pooled and filtered through a 100 μm nylon mesh. Anti-PDGFRα (APA5), anti-PDGFRβ (APB5), anti-LepR (R&D), anti-CD45 (30F-11) and anti-Ter119 antibodies were used to isolate stromal cells. For analysis of endothelial cells, mice were injected intravenously into the retro-orbital venous sinus with 10 μg Alexa Fluor 660 conjugated anti-VE-cadherin antibody (BV13) 10 minutes before sacrifice. Samples were analyzed using a FACSAria or FACSCanto II flow cytometer (BD Biosciences).
5-bromo-2′-deoxyuridine (BrdU) incorporation assay
To assess BrdU incorporation into spleen cells after EMH induction, mice were intraperitoneally injected with a single dose of BrdU (2mg BrdU/per mouse) then maintained on 0.5mg BrdU/ml drinking water for seven days. Endothelial cells were labeled by intravenous injection of an anti-VE-cadherin antibody (eBioscience). Enzymatically dissociated spleen cells were stained with antibodies against surface markers and the target cell populations were sorted then resorted to ensure purity. The sorted cells were then fixed, and stained with an anti-BrdU antibody using the BrdU APC Flow Kit (BD Biosciences) according to the manufacturer's instructions.
Long-term competitive reconstitution assay
Adult recipient mice were irradiated using an XRAD 320 x-ray irradiator (Precision X-Ray Inc.) with two doses of 540 rad (total 1080 rad) delivered at least 2 hours apart. Cells were injected into the retro-orbital venous sinus of anesthetized mice. Sorted doses of splenocytes from donor mice with EMH were transplanted along with 3×10⁵ recipient bone marrow cells. Recipient mice were bled every 4 weeks to assess the level of donor-derived blood cells, including myeloid, B and T cells for at least 16 weeks. Blood was subjected to ammonium chloride/potassium red cell lysis before antibody staining. Antibodies including anti-CD45.2 (104), anti-CD45.1 (A20), anti-Gr1 (8C5), anti-Mac-1 (M1/70), anti-B220 (6B2), and anti-CD3 (KT31.1) were used for flow cytometric analysis.
Tissue sectioning and confocal imaging
For bone marrow sections, freshly dissected bones were fixed in 4% paraformaldehyde overnight followed by 3 days of decalcification in 10% EDTA dissolved in PBS. Bones were sectioned using the CryoJane tape-transfer system (Instrumedics). For spleen sections, freshly dissected spleens were fixed in 4% paraformaldehyde for 1 hour followed by 1 day incubation in 10% Sucrose in PBS. Frozen spleens were sectioned with a cryostat (Leica). For whole mount imaging, spleens were sectioned into ~2 mm pieces. Spleen sections were blocked in PBS with 10% horse serum for 1 hour and then stained overnight with chicken-anti-GFP (Aves), and/or rabbit-anti-Laminin (Abcam) antibodies. Donkey-anti-chicken Alexa Fluor 488 and/or Donkey-anti-rabbit Alexa Fluor 647 were used as secondary antibodies (Invitrogen). Specimens were mounted with anti-fade prolong gold (Invitrogen) and images were acquired with either a Zeiss LSM780 confocal microscope or a Leica SP8 confocal microscope equipped with a resonant scanner. Three dimensional images were achieved using Bitplane Imaris v7.7.1 software.
Deep imaging of spleens
Spleens were harvested and fixed for 4 hours in 4% PFA at 4°C. Since the Spleen capsule is highly autofluorescent, spleens were sectioned perpendicular to the long axis into 300 μm thick sections using a Leica VT100S vibrotome. These 300 μm sections were fixed for an additional 2 hours in 4% PFA and blocked overnight in staining solution (10% DMSO, 0.5% IgePal630 (Sigma), and 5% donkey serum (Jackson Immunoresearch) in PBS). All staining steps were performed in staining solution on a rotator at room temperature. Spleen sections were stained for three days in primary antibodies, washed overnight in several changes of PBS then stained for three days in secondary antibodies. The stained sections were dehydrated in a methanol dehydration series then incubated for 3 hours in 100% methanol with several changes. The methanol was then exchanged with benzyl alcohol:benzyl benzoate 1:2 mix (BABB clearing28). The tissues were incubated in BABB for 3 hours to overnight with several exchanges of fresh BABB. Spleen sections were mounted in BABB between two cover slips and sealed with silicone (Premium waterproof silicone II clear, General Electric). We found it necessary to clean the BABB of peroxides (which can accumulate as a result of exposure to air and light) by adding 10 g of activated aluminum oxide (Sigma) to 40ml of BABB and rotating for at least 1 hour, then centrifuging at 2000×g for 10 minutes to remove the suspended aluminum oxide particles. Images were acquired using a Zeiss LSM780 confocal microscope with a Zeiss LD LCI Plan-Apo 25×/0.8 multi-immersion objective lens, which has a 570 μm working distance. Images were taken at 512×512 pixel resolution with 2 μm Z-steps, pinhole for the internal detector at 47.7 μm. Random spots were inserted into images by generating randomized X, Y, and Z coordinates using the random integer generator at www.random.org.
Splenectomy
After mouse anesthesia by Ketamine/xylazine, a ventral midline incision was made and the peritoneum was breached. The splenic blood vessels was ligated with an absorbable suture (4-0 vicryl). The splenic vessels was cut distal to the suture and the spleen was removed. The vessels was cauterized and the abdomen was sutured with non-absorbable sutures (3-0 Tevdek III). Buprenorphine was administered every 12 hours for 3 days to minimize postoperative pain and mice were maintained with ampicillin-containing water to avoid infection. Complete blood counts were measured one month after the survival surgery.
Induction of EMH by bleeding
EMH was induced by repeated bleeding over a two week period according to a published protocol2. Briefly, 4-6 month-old mice were bled via the tail-vein five times, every three days, removing approximately 250 μl of blood each time, then the mice were sacrificed for analysis two days after the last bleed.
Western blot
Approximately 30,000 CD45−Ter119−VE-cadherin+ splenic endothelial cells were flow cytometrically sorted into 50 μl of 66% Trichoracetic acid (TCA) in water. Extracts were incubated on ice for at least 15 min and centrifuged at 16,100 × g at 4°C for 10 min. Precipitates were washed in acetone twice and the dried pellets were solubilized in 9M urea, 2% TritonX-100, and 1% DTT. Samples were separated on 4-12% Bis-Tris polyacrylamide gels (Invitrogen) and transferred to PVDF membrane (Millipore). The blots were incubated with primary antibodies overnight at 4°C and then with secondary antibodies. Blots were developed with the SuperSignal West Femtochemiluminescence kit (Thermo Scientific). Primary antibodies used: rabbit-anti-SCF (Abcam, 1:1000) and mouse-anti-Actin (Santa Cruz, clone AC-15, 1:20,000).
Quantitative real-time PCR
Cells were sorted directly into Trizol (Life Technologies). Total RNA was extracted according to the manufacturer's instructions. Total RNA was reverse transcribed using SuperScript III Reverse Transcriptase (Life Technologies). Quantitative real-time PCR was performed using SYBR green on a LightCycler 480 (Roche). β-actin was used to normalize the RNA content of samples. Primers used in this study were Scf: 5’- GCCAGAAACTAGATCCTTTACTCCTGA-3’ and 5’- CATAAATGGTTTTGTGACACTGACTCTG-3’; β-actin: 5’- GCTCTTTTCCAGCCTTCCTT-3’ and 5’- CTTCTGCATCCTGTCAGCAA-3’.
Gene expression profiling
Three independent samples of 5,000 spleen Scf-GFP+VE-cadherin− spleen stromal cells and two independent samples of 5,000 unfractionated spleen cells were flow cytometrically sorted into Trizol. Total RNA was extracted, amplified, and sense strand cDNA was generated using the Ovation Pico WTA System V2 (NuGEN) according to the manufacturer's instructions. cDNA was fragmented and biotinylated using the Encore Biotin Module (NuGEN) according to the manufacturer's instructions. Labeled cDNA was hybridized to Affymetrix Mouse Gene ST 1.0 chips according to the manufacturer's instructions. Expression values for all probes were normalized and determined using the robust multi-array average (RMA) method29. Microarray data are available at GEO database: http://www.ncbi.nlm.nih.gov/ (accession number GSE71288).
Statistical methods
Panels in all figures represented multiple independent experiments performed on different days with different mice. Sample sizes were not based on power calculations. No randomization or blinding was performed. No animals were excluded from analysis. Variation is always indicated using standard deviation. For analysis of the statistical significance of differences between two groups we generally performed two-tailed Student's t-tests. For analysis of the statistical significance of differences among more than two groups, we performed Repeated Measures one-way ANOVAs with Greenhouse-Geisser correction (variances between groups were not equal) and Tukey's multiple comparison tests with individual variances computed for each comparison. To assess the statistical significance of differences in fetal mass between paired control and mutant mice (Fig. 5j and Extended Data Fig. 8v), we performed a two-way ANOVA.
Extended Data
Extended Data Figure 1. Cy+21d G-CSF treatment induces EMH in the spleen and deletion of Scf from LepR+ cells significantly reduces the number of HSCs in the bone marrow and the spleen after induction of EMH.
a, b, Staining with anti-Laminin antibody distinguished the vasculature of red pulp (RP) from white pulp (WP). The red pulp and white pulp were marked by clusters of Ter119+ cells (red) and CD3+ cells (blue), respectively30. Dashed line depicts the boundary between red pulp and white pulp. (representative images from 3 mice in 3 independent experiments). c, Spleen sections of the same magnification show the enlargement of the spleen after induction of EMH by Cy+21day G-CSF. These are the same images as in Fig. 1a and Extended Data Fig. 1d, adjusted to reflect the same magnification. d, e, Imaging of thick spleen sections from ScfGFP; Cxcl12DsRed mice after the induction of EMH by Cy+21d G-CSF. e, High-magnification view of the boxed area in (d). Dashed lines depict the boundaries between white pulp and red pulp. Arrow indicates the central arteriole in the white pulp around which stromal cells expressed Cxcl12-DsRed. (representative images from 3 mice from 3 independent experiments). f, g, Hematoxylin and Eosin (H&E) staining showing the increase in haematopoiesis in the spleen after induction of EMH using Cy+G-CSF (+EMH, g) as evidenced by the presence of megakaryocytes (arrows; n=3 mice/condition from 3 independent experiments). h-n, Cy+G-CSF treatment significantly increased spleen cellularity (h), as well as the numbers of HSCs (i), myeloid and erythroid progenitors (j), frequencies of colony-forming progenitors (k), numbers of Ter119+ erythroid cells (l) and Gr-1+Mac-1+ myeloid cells (m) in the spleen but not the number of B220+ or CD3+ lymphoid cells (n). The numbers of mice per treatment are shown in each bar of each panel. Each panel shows mean±s.d. from five independent experiments. o, p, Scf-GFP (o) and Cxcl12-DsRed (p) fluorescence by spleen stromal cells before (−EMH) and after induction of EMH (+EMH) using Cy+G-CSF. q, r, The frequencies (q) and absolute numbers (r) of Scf-GFP+VE-cadherin+ endothelial cells and Scf-GFP+VE-cadherin− stromal cells significantly increased upon induction of EMH by Cy+21d G-CSF (+EMH). s, Spleens from Leprcre; R26tdTomato; ScfGFP mice showed Tomato expression was primarily in the stromal cells of the white pulp. Although most Scf-GFP expression was in endothelial cells and perivascular stromal cells of the red pulp (Fig. 1a-1d), some Scf-GFP+ stromal cells were in the white pulp, most of which appeared to express LepR. Dashed line depicts the boundary between red pulp (RP) and white pulp (WP). (representative images of 6 mice from 4 independent experiments). t, Flow cytrometric analysis of enzymatically dissociated spleen cells from Leprcre; R26tdTomato; ScfGFP mice showed that only a small minority of non-endothelial Scf-GFP+ cells were positive for Tomato (n=3 mice from 3 independent experiments). u, Tomato+CD45−Ter119− stromal cells in the spleens of Lepr-cre; R26tdTomato mice expressed PDGFRα, PDGFRβ, Sca-1, and LepR (n=3 mice from 3 independent experiments). v, Percentage of all CFU-F colonies formed by enzymatically dissociated spleen cells from Leprcre; R26tdTomato mice that expressed Tomato. Macrophage colonies were excluded by staining with anti-CD45 antibody (n=4 mice from 3 independent experiments). w, Leprcre; Scffl/− mice had significantly fewer HSCs in the bone marrow than wild-type and Scffl/− controls before induction of EMH (n=4 mice/genotype/time point mice from 4 independent experiments). x, y, Leprcre; Scffl/− mice displayed significantly lower spleen cellularity (x) and HSC number (y) in the spleen than wild-type and Scffl/− controls after induction of EMH with cyclophosphamide plus 4 days of G-CSF. The numbers of mice per treatement are shown in each bar. Data represent mean±s.d. from 4 independent experiments. The statistical significance of differences (1h-1n, 1q and 1r) was assessed using two-tailed Student's t-tests (*** P<0.001). The statistical significance of differences between genotypes (1w-1y) was assessed using Repeated Measures one-way ANOVAs with Greenhouse-Geisser correction and Tukey's multiple comparison tests with individual variances computed for each comparison. * indicates statistical significance relative to wild-type (Scf+/+). # indicates statistical significance between Scf+/− and Leprcre; Scffl/− (* or # P<0.05, ** or ## P<0.01).
Extended Data Figure 2. Scf is expressed by most endothelial cells but not by Tcf21+ perivascular cells in the liver; Cy+21d G-CSF does not significantly change the recombination pattern of Tcf21-Cre/ER in the spleen, bone marrow or liver.
To identify Cre alleles that recombine in spleen, but not bone marrow, stromal cells we assessed the gene expression profile of spleen Scf-GFP+VE-cadherin− stromal cells (Extended Data Table 1). Nestin, NG2 (Cspg4), and Prx1 were low or undetectable (data not shown). Nestin-Cre31, NG2-Cre32, NG2-Cre/ER33, and Prx1-Cre34 did not recombine widely or specifically in Scf-GFP+ stromal cells in the spleen (data not shown). Pdgfra and Pdgfrb were expressed by spleen Scf-GFP+ stromal cells but neither Pdgfra-Cre/ER35 nor Pdgfrb-Cre36 recombined efficiently (data not shown). Sm22 (Tagln), Myh11, Sma (Acta2), and Tcf21 were significantly more highly expressed by spleen than bone marrow Scf-GFP+ stromal cells (Extended Data Table 1). Sm22-Cre37, Myh11-Cre38, and Sma-Cre/ER39 recombined in few spleen Scf-GFP+ stromal cells (data not shown). However, Tcf21-Cre/ER recombined in perivascular stromal cells in the spleen but not bone marrow (Figure 2). a-c, Under normal conditions, Scf-GFP was expressed by most VE-cadherin+ endothelial cells (arrowheads in a) but not by Tcf21+ stromal cells (arrows in a) in the liver (n=3 mice from 3 independent experiments). d, e, EMH induced by Cy+21day G-CSF did not alter the general distribution (d) or perivascular localization (e) of Tomato+ cells in the spleens of Tcf21cre/ER; R26tdTomato mice as compared to normal mice (Fig. 2a and 2d). f, g, Tomato expression was undetectable in the bone marrow of Tcf21cre/ER; R26tdTomato mice after Cy+G-CSF treatment irrespective of whether the bone marrow was analyzed by whole-mount imaging (f) or flow cytometry (g). h, i, EMH induced by Cy+G-CSF did not significantly change the frequency (h) or perivascular localization (i, arrows) of Tomato+ cells in the livers of Tcf21cre/ER; R26tdTomato mice. (d-i, n=3 mice from 3 independent experiments)
Extended Data Figure 3. Deep imaging of HSCs in the spleen; deletion of Scf or Cxcl12 from Tcf21-expressing stromal cells in the spleen reduced peripheral blood cell counts but did not affect bone marrow haematopoiesis.
a, b, The vast majority of c-kit+ haematopoietic progenitors localized adjacent to Tcf21-expressing stromal cells in the red pulp of the normal spleen (n=3 mice from 3 independent experiments). c, d, 300 μm thick sections of spleen before (c) and after optical clearing (d). e, f, Deep imaging of α-catulin-GFP+c-kit+ HSCs in cleared spleen segments from Tcf21cre/ER; R26tdTomato; α-catulin mice. A representative high magnification image of an α-catulin-GFP+c-kit+ HSC surrounded by Tomato+ stromal cells (e). f, Low magnification view of a digitally reconstructed 300 μm thick spleen fragment with α-Catulin-GFP+c-kit+ HSCs identified by large yellow spheres. Note that actual HSCs would be smaller than the yellow spheres but would not be visible at this magnification (n=3 mice from 3 independent experiments). g-m, Tcf21cre/ER; Scffl/fl and Scffl/fl control mice were treated with tamoxifen then examined a month later without further treatment (not treated, NT) or after treatment with cyclophosphamide plus 4, 8, or 21 days of G-CSF to induce EMH. Data show white blood cell (WBC) (g), red blood cell (RBC) (h), and platelet (PLT) counts (i), numbers of CMPs (j), GMPs (k) and MEPs (l) in the bone marrow and numbers of GMPs in the spleen (m). n, Platelet counts of sham-operated and splenectomized mice that were treated with Cy+21d G-CSF one month after surgery. o-u, Tcf21cre/ER; Cxcl12fl/− mice and littermate controls (Cxcl12fl/− or Cxcl12+/−) were treated with tamoxifen then examined a month later without further treatment (NT) or after treatment with cyclophosphamide plus 4, 8, or 21 days of G-CSF to induce EMH. Data show WBC (o), RBC (p), and PLT counts (q), numbers of CMPs (r), GMPs (s) and MEPs (t) in the bone marrow and numbers of GMPs in the spleen (u). The numbers of mice per treatment are shown in each panel. All data reflect mean±s.d. from 3 independent experiments. Two-tailed student's t-tests were used to assess statistical significance (*P<0.05, ***P<0.001).
Extended Data Figure 4. Conditional deletion of Scf or Cxcl12 with Tcf21-Cre/ER, or Scf with Vav1-Cre, does not significantly affect the frequency or morphology of stromal cells in the spleen, irrespective of EMH induction.
a-g, Irrespective of whether the mice were treated with Cy+G-CSF, conditional deletion of Scf from Tcf21+ cells did not significantly change the frequency of VE-cadherin+ endothelial cells (a) or PDGFRβ+ perivascular stromal cells (b), Scf transcript levels in endothelial cells (c), or the morphology or density of blood vessels in the spleen (d-g). h-n, Irrespective of whether the mice were treated with Cy+G-CSF, conditional deletion of Cxcl12 from Tcf21+ cells did not significantly change the frequency of VE-cadherin+ endothelial cells (h) or PDGFRβ+ perivascular stromal cells (i), Scf transcript levels in endothelial cells or perivascular stromal cells (j), or the morphology or density of blood vessels in the spleen (k-n). o-u, Irrespective of whether the mice were treated with Cy+G-CSF, conditional deletion of Scf from Vav1+ cells did not significantly change the frequency of VE-cadherin+ endothelial cells (o) or PDGFRβ+ perivascular stromal cells (p), Scf transcript levels in perivascular stromal cells (q), or the morphology or density of blood vessels in the spleen (r-u). Scf transcript levels in flow cytometrically isolated cells were normalized to β-actin and then compared to whole spleen cells (c, j and q). The data reflect mean±s.d. from 3 mice/genotype/condition in 3 independent experiments. Two-tailed student's t-tests were used to assess statistical significance.
Extended Data Figure 5. Vav1-Cre recombines efficiently and specifically in spleen endothelial cells but poorly in bone marrow or liver endothelial cells.
a, TomatohighCD45−Ter119− cells in Vav1-cre; tdTomato mice were uniformly positive for VE-cadherin and negative for PDGFRβ (n=3 mice from 3 independent experiments). b, Vav1-Cre recombined in most spleen endothelial cells but in few bone marrow endothelial cells, irrespective of Cy+G-CSF treatment (+EMH). c, Scf transcript levels were significantly reduced in endothelial cells from the spleen but not from bone marrow or liver in Vav1-cre; Scffl/− mice as compared to Scffl/− mice. The Scf transcript level was normalized to β-actin. d, Western-blot showed lower SCF protein levels in splenic endothelial cells from Vav1-cre; Scffl/− mice as compared to Scffl/− mice. SCF abundance was assessed relative to Actin by Image J software (n=3 mice/genotype from 3 independent experiments). e-h, In the bone marrow Vav1-Cre recombined in a minority of endothelial cells, including some sinusoidal (arrows in h) and some arteriolar (arrowheads in h) endothelial cells, that expressed little Scf-GFP by flow cytometry (f, g). The data reflect mean±s.d. from 3 mice/genotype in 3 independent experiments. i-k, Vav1-Cre recombined inefficiently in liver endothelial cells. Most Tomato+ cells in the liver of Vav1-cre; R26tdTomato; ScfGFP mice were VE-cadherin+ and Scf-GFP+ (i, arrows in k) but these cells accounted for only 26±4.2% of Scf-GFP+ cells by flow cytometry (i, j) and confocal microscopy (k, n=3 mice from 3 independent experiments). Two-tailed student's t-tests were used to assess statistical significance.
Extended Data Figure 6. EMH induced by Cy+G-CSF does not significantly change the recombination pattern of Vav1-Cre in the spleen, bone marrow, or liver but deletion of Scf from endothelial cells in spleens with EMH reduces blood cell counts without affecting bone marrow haematopoiesis.
a, b, After EMH induced by Cy+21d G-CSF, Vav1-Cre-recombined cells were predominantly in the red pulp (a) and co-localized with VE-cadherin+ cells (b) in the spleen, c-f, After EMH induced by Cy+21d G-CSF, Vav1-Cre-recombined cells remained rare in the bone marrow (c, d) and liver (e, f, n=3 mice from 3 independent experiments). g-s, Vav1-cre; Cxcl12fl/− mice and Cxcl12fl/− controls were treated with Cy+4-21d G-CSF to induce EMH. Data show WBC (g), RBC (h), and platelet (i) counts, spleen cellularity (j) and numbers of HSCs (k), CMPs (l), GMPs (m) and MEPs (n) in the spleen as well as bone marrow cellularity (o), and numbers of HSCs (p), CMPs (q), GMPs (r) and MEPs (s) in one femur and one tibia. The data represent mean mean±s.d. from 3 (4d) and 5 (21d) independent experiments. The number of mice/treatment is indicated on each bar. Two-tailed student's t-tests were used to assess statistical significance. t-z, Vav1-cre; Scffl/− mice and Scffl/+, Scffl/− controls were treated with Cy+4-21d G-CSF to induce EMH. Data show WBC (t), RBC (u), and platelet (PLT) (v) counts, numbers of CMPs (w), GMPs (x) and MEPs (y) in the bone marrow as well as numbers of GMPs in the spleen (z). Note that after 21 days of G-CSF both Scffl/− and Vav1-cre; Scffl/− mice showed significantly lower CMP numbers relative to Scffl/+ mice but their CMP numbers were not significant different from each other (w), indicating that CMP numbers in the bone marrow were not influenced by Scf deletion from spleen endothelial cells. The data represent mean±s.d. from 3 (NT), 3 (4d), 3 (8d), and 8 (21d) independent experiments. The number of mice/treatment is indicated on each bar. The statistical significance of differences among genotypes was assessed using Repeated Measures one-way ANOVAs with Greenhouse-Geisser correction and Tukey's multiple comparison tests with individual variances computed for each comparison. * indicates statistical significance relative to Scffl/+ controls. # indicates statistical significance between Scffl/− and Vav1-cre; Scffl/− (* or # P<0.05, ** or ## P<0.01).
Extended Data Figure 7. Pregnancy induces EMH and the proliferation of endothelial cells and stromal cells in the spleen without significantly changing the recombination pattern of Tcf21-Cre/ER in the spleen, bone marrow, or liver.
Pregnant female mice were at gestation day 18.5. a, b, H&E staining showed increased haematopoiesis in the spleens of pregnant mice (b) as evidenced by the presence of megakaryocytes (arrows; n=3 mice/condition from 3 independent experiments). c-i, Pregnancy significantly increased spleen cellularity (c), as well as the numbers of HSCs (d), myeloid and erythroid progenitors (e, f), Ter119+ erythroid cells (g) and Gr-1+Mac-1+ myeloid cells (h) in the spleen but not the number of B220+ or CD3+ lymphoid cells (i). j, k, During pregnancy Scf-GFP was expressed by VE-cadherin+ endothelial cells and VE-cadherin− stromal cells (j) while Cxcl12-DsRed was expressed by a subset of the VE-cadherin−Scf-GFP+ stromal cells (j, k). l, Whole-mount imaging of a thick spleen section from a pregnant ScfGFP; Cxcl12DsRed mouse (representative images from 3 mice in 3 independent experiments). m, n, In the spleen, the numbers of Scf-GFP+ cells (m) and Cxcl12-DsRed+ cells (n) significantly increased upon bleeding. o, Endothelial and stromal cells in the spleen proliferated after bleeding. BrdU was administered to ScfGFP mice or Cxcl12DsRed mice for 18 days, beginning in pregnant mice after the plug was observed. The number of mice per treatment is indicated on each bar. Each panel shows mean±s.d. from three independent experiments. Two-tailed student's t-tests were used to assess statistical significance (**P<0.01, ***P<0.001). p-r, Pregnancy did not alter the general distribution (p), perivascular localization (q) or surface marker expression (r, PDGFRβ+ and LepR−) of Tomato+ cells in the spleens of Tcf21cre/ER; R26tdTomato mice. s, t, Tomato expression remained undetectable in the bone marrow of pregnant Tcf21cre/ER; R26tdTomato mice. u, v, During pregnancy Tcf21-Cre/ER recombined in rare perivascular cells in the liver. (p-v, n=3 mice/genotype from 3 independent experiments)
Extended Data Figure 8. Conditional deletion of Cxcl12 from Tcf21+ stromal cells impairs EMH in the spleens of pregnant mice without significantly affecting bone marrow haematopoiesis.
4 to 6 month-old female mice that had been treated with tamoxifen at least two month before were mated with normal wild-type males. Normal females and pregnant females at gestation day 18.5 were analyzed. a-d, Conditional deletion of Scf from Tcf21+ cells did not significantly affect the numbers of GMPs (a), CMPs (b), MEPs (c), Ter119+ (erythroid), Gr-1+Mac-1+ (myeloid), CD3+ (T) and B220+ (B) cells (d) in one femur or one tibia. e, f, Conditional deletion of Scf from Tcf21+ cells significantly reduced GMPs (e), Ter119+ erythrocytes and Gr-1+Mac-1+ myeloid cells (f) in the spleen. g, h, Conditional deletion of Scf from Tcf21+ cells did not significantly affect WBC (g) or platelet counts (h). i-n, Conditional deletion of Cxcl12 from Tcf21+ cells did not significantly affect bone marrow cellularity (i), or the numbers of HSCs (j), GMPs (k) CMPs (l), MEPs (m), Ter119+ (erythroid), Gr-1+Mac-1+ (myeloid), CD3+ (T) and B220+ (B) cells (n) in the bone marrow. o-w, Spleen cellularity (o) and numbers of HSCs (p), GMPs (q), CMPs (r), MEPs (s), Ter119+ (erythroid), Gr-1+Mac-1+ (myeloid), CD3+ (T) and B220+ (B) cells (t) in the spleen and WBC (u), platelet (v) and RBC counts (w) in the blood. x, Conditional deletion of Cxcl12 from Tcf21+ cells in the spleens of pregnant mothers did not significantly affect fetal mass. The numbers of mice per treatment are shown in each bar within each panel. Each panel shows mean±s.d. from 3 independent experiments. The statistical significance of differences among genotypes was assessed using a Repeated Measures one-way ANOVA with Greenhouse-Geisser correction along with Tukey's multiple comparison tests with individual variances (a-w). The statistical significance of differences in panel x was assessed using a two-way ANOVA. * indicates statistical significance relative to normal mice; # indicates statistical significance between Scf mutant mice and control mice after bleeding (* or # P<0.05, ** or ## P<0.01, *** P<0.001).
Extended Data Figure 9. Bleeding induces EMH and the proliferation of endothelial cells and stromal cells in the spleen without significantly changing the recombination pattern of Tcf21-Cre/ER in the spleen, bone marrow, or liver.
a, b, H&E staining showed an increase in haematopoiesis in the spleen after repeated bleeding (b, bled) as evidenced by the presence of megakaryocytes (arrows; n=3 mice/condition from 3 independent experiments). c-i, Bleeding significantly increased spleen cellularity (c), as well as the numbers of HSCs (d), myeloid and erythroid progenitors (e, f), and the numbers of Ter119+ erythroid cells (g) and Gr-1+Mac-1+ myeloid cells (h) in the spleen but not the number of B220+ or CD3+ lymphoid cells (i). j, k, After EMH induced by bleeding, Scf-GFP was expressed by VE-cadherin+ endothelial cells and VE-cadherin− stromal cells (j) while Cxcl12-DsRed was expressed by a subset of the VE-cadherin−Scf-GFP+ stromal cells (j, k). l, Whole-mount imaging a thick spleen section from a ScfGFP; Cxcl12DsRed mouse after bleeding (representative images from 3 mice in 3 independent experiments). m, n, The numbers of Scf-GFP+ cells (m) and Cxcl12-DsRed+ cells (n) significantly increased upon bleeding. o, Endothelial and stromal cells in the spleen proliferated after bleeding. BrdU was administered to ScfGFP mice or Cxcl12DsRed mice for 15 days beginning after the first bleeding. The numbers of mice per treatment are shown in each bar in each panel. Each panel shows mean±s.d. from three independent experiments. Two-tailed student's t-tests were used to assess statistical significance (**P<0.01, ***P<0.001). p-r, Bleeding did not alter the general distribution (p), perivascular localization (q) or surface marker expression (r, PDGFRβ+ and LepR−) of Tomato+ cells in the spleens of Tcf21cre/ER; R26tdTomato mice. s, t, Tomato expression remained undetectable in bone marrow from Tcf21cre/ER; R26tdTomato mice after bleeding. u, v, After bleeding Tcf21-Cre/ER recombined in only rare perivascular cells in the liver (p-v, n=3 mice/genotype from 3 independent experiments).
Extended Data Figure 10. Blood loss does not significantly change the recombination pattern of Vav1-Cre in the spleen, bone marrow, or liver; conditional deletion of Cxcl12 from Tcf21+ spleen stromal cells in bled mice impairs EMH in the spleen without significantly affecting bone marrow haematopoiesis.
4-6 month-old mice with the indicated genetic backgrounds were repeatedly bled over a two week period. a-h, After EMH induced by blood loss, Vav1-Cre recombined efficiently in VE-cadherin+ endothelial cells in the red pulp of the spleen (a-c) but poorly in the bone marrow (d-f) and liver (g, h), similar to what we observed under normal conditions (see Fig. 4a-4c and Extended Data Fig. 5b) (a-h, n=3 mice from 3 independent experiments). i-n, Conditional deletion of Scf from Tcf21+ and/or Vav1+ spleen cells did not significantly affect the numbers of GMPs (i), CMPs (j), MEPs (k), Ter119+ (erythroid), Gr-1+Mac-1+ (myeloid), CD3+ (T) and B220+ (B) cells (l) in the bone marrow or WBC (m) or platelet counts in the blood (n). o, p, Conditional deletion of Scf from Tcf21+ and/or Vav1+ spleen cells significantly reduced GMPs (o), Ter119+ erythrocytes and Gr-1+Mac-1+ myeloid cells (p) in the spleen. (i-p, Data represent mean±s.d. from 3 independent experiments) q-v, Conditional deletion of Cxcl12 from Tcf21+ spleen cells did not significantly affect bone marrow cellularity (q), or the numbers of HSCs (r), GMPs (s) CMPs (t), MEPs (u), Ter119+ (erythroid), Gr-1+Mac-1+ (myeloid), CD3+ (T) and B220+ (B) cells (v) in one femur and one tibia from bled mice. w-ab, Conditional deletion of Cxcl12 from Tcf21+ spleen cells significantly reduced spleen cellularity (w), and the numbers of MEPs (aa) and erythroid cells (ab) in the spleens of bled mice. Conditional deletion of Cxcl12 from Tcf21+ spleen cells did not significantly affect the numbers of HSCs (x), GMPs (y), or CMPs (z) in the spleens of bled mice. ac-ae, Conditional deletion of Cxcl12 from Tcf21+ spleen cells significantly reduced RBC (ac) but not WBC (ad) or platelet counts (ae) in the blood of mice that had been repeatedly bled. The data in q-ae represent mean±s.d. from 3 independent experiments. The numbers of mice per treatment are shown in each bar in each panel. Statistical significance of differences among genotypes was assessed using a Repeated Measures one-way ANOVA with Greenhouse-Geisser correction along with Tukey's multiple comparison tests with individual variances. * indicates statistical significance relative to normal mice; # indicates statistical significance between Scf mutant mice and control mice after bleeding (* or # P<0.05, ** or ## P<0.01, *** P<0.001).
Extended Data Table 1.
Genes that are significantly (>8-fold and P<0.015) more highly expressed by Scf-GFP+ stromal cells in spleen as compared to bone marrow.
| Gene | Gene name | Unigene | Spleen Scf-GFP+ | BM Scf-GFP+ | Fold change |
|---|---|---|---|---|---|
| Coch | Coagulation factor C homolog | Mm.21325 | 12.1±0.3 | 6.6±0.0 | 45.4 |
| Ccl21a | Chemokine (C-C motif) ligand 21A | Mm.458815 | 12.5±0.1 | 7.1±0.4 | 41.1 |
| Acta2 | Actin, alpha 2, smooth muscle, aorta | Mm.213025 | 11.9±0.3 | 6.7±0.1 | 35.2 |
| Cxcl13 | Chemokine (C-X-C motif) ligand 13 | Mm.10116 | 11.8±0.3 | 6.8±0.2 | 30.3 |
| Tcf21 | Transcription factor 21 | Mm.16497 | 11.3±0.6 | 6.6±0.0 | 25.9 |
| Clca1 | Chloride channel calcium activated 1 | Mm.454553 | 11.1±0.3 | 6.6±0.0 | 22.5 |
| Ifi27l2a | Interferon, alpha-inducible protein 27 like 2A | Mm.271275 | 11.3±0.2 | 7.2±0.4 | 16.6 |
| Pln | Phospholamban | Mm.34145 | 10.7±0.1 | 6.6±0.0 | 16.3 |
| Parm1 | Prostate androgen-regulated mucin-like 1 | Mm.5002 | 10.8±0.3 | 6.8±0.1 | 16 |
| Fn1 | Fibronectin 1 | Mm.193099 | 10.7±0.4 | 6.8±0.2 | 14.9 |
| Col14a1 | Collagen, type XIV, alpha 1 | Mm.297859 | 10.4±0.2 | 6.7±0.1 | 12.6 |
| Nr4a1 | Nuclear receptor subfamily 4, group A, 1 | Mm.119 | 10.5±0.6 | 7.0±0.3 | 11.2 |
| Agtr1a | Angiotensin II receptor, type 1a | Mm.35062 | 10.7±0.7 | 7.3±0.6 | 11 |
| Fos | FBJ osteosarcoma oncogene | Mm.246513 | 11.4±0.4 | 8.0±0.4 | 10.7 |
| Atp1b2 | ATPase, Na+/K+ transporter, beta 2 | Mm.235204 | 10.6±0.2 | 7.2±0.2 | 10.6 |
| Tnxb | Tenascin XB | Mm.290527 | 9.9±0.5 | 6.6±0.0 | 9.5 |
| Myh11 | Myosin, heavy polypeptide 11, smooth muscle | Mm.250705 | 10.7±0.7 | 7.5±0.2 | 9.4 |
| Hspb1 | Heat shock protein 1 | Mm. 13849 | 10.8±0.7 | 7.6±0.2 | 9.3 |
| Clca2 | Chloride channel calcium activated 2 | Mm.20897 | 9.8±0.4 | 6.6±0.0 | 8.8 |
| Tagln | Transgelin | Mm.283283 | 10.4±0.5 | 7.3±0.9 | 8.6 |
| Nr2f2 | Nuclear receptor subfamily 2, group F, 2 | Mm.158143 | 10.7±0.3 | 7.6±0.3 | 8.5 |
| Mustn1 | Musculoskeletal, embryonic nuclear protein 1 | Mm.220895 | 10.8±0.5 | 7.7±0.7 | 8.2 |
| Aspn | Asporin | Mm.383216 | 9.7±0.6 | 6.6±0.0 | 8.2 |
| Sparcl1 | SPARC-like 1 | Mm.29027 | 12.1±0.1 | 9.1±0.4 | 8.1 |
Data show mean±s.d. for log2 transformed expression values (n=3 independent samples/cell population). Maximal background expression was considered to be 6.6 (log2(100)); all expression values below this threshold were set to 6.6 for purposes of calculating fold-change. Two-tailed Student's t-tests were used to assess statistical significance. Data for bone marrow Scf-GFP+ stromal cells are from19.
Supplementary Material
Acknowledgements
S.J.M. is a Howard Hughes Medical Institute (HHMI) Investigator, the Mary McDermott Cook Chair in Pediatric Genetics, the director of the Hamon Laboratory for Stem Cells and Cancer, and a Cancer Prevention and Research Institute of Texas Scholar. B.O.Z. was supported by a fellowship from the Leukemia and Lymphoma Society. We thank N. Loof and the Moody Foundation Flow Cytometry Facility, K. Correll and M. Gross for mouse colony management, and E. Olson and J. Mendell for providing Cre lines. This work was supported by the NIH NHLBI (HL097760).
Footnotes
The authors declare no competing financial
Author Contributions C.N.I. identified the cre alleles used in this study and analyzed Scf and Cxcl12 conditional knockout mice after Cy+G-CSF treatment. B.O.Z. characterized the stromal cells in the spleen and analyzed Scf and Cxcl12 conditional knockout mice after blood loss and pregnancy. M.A. generated and characterized the α-catulinGFP mice. M.M.M analyzed HSC localization in the spleen. Z.Z. performed all statistical analyses. J.R. examined spleen histology. C.N.I., B.O.Z., M. A., M.M.M. and S.J.M. designed the experiments and interpreted the results. C.N.I., B.O.Z. and S.J.M. wrote the manuscript.
ACCESSION NUMBERS
Microarray data are available at GEO database: http://www.ncbi.nlm.nih.gov/ (accession number GSE71288).
REFERENCE
- 1.Abdel-Wahab OI, Levine RL. Primary myelofibrosis: update on definition, pathogenesis, and treatment. Annual Review Medicine. 2009;60:233–45. doi: 10.1146/annurev.med.60.041707.160528. [DOI] [PubMed] [Google Scholar]
- 2.Cheshier SH, Prohaska SS, Weissman IL. The effect of bleeding on hematopoietic stem cell cycling and self-renewal. Stem Cells Dev. 2007;16:707–17. doi: 10.1089/scd.2007.0017. [DOI] [PubMed] [Google Scholar]
- 3.Bennett M, Pinkerton PH, Cudkowicz G, Bannerman RM. Hemopoietic progenitor cells in marrow and spleen of mice with hereditary iron deficiency anemia. Blood. 1968;32:908–21. [PubMed] [Google Scholar]
- 4.Nakada D, et al. Oestrogen increases haematopoietic stem-cell self-renewal in females and during pregnancy. Nature. 2014;505:555–8. doi: 10.1038/nature12932. [DOI] [PMC free article] [PubMed] [Google Scholar]
- 5.Fowler JH, Nash DJ. Erythropoiesis in the spleen and bone marrow of the pregnant mouse. Developmental Biology. 1968;18:331–53. doi: 10.1016/0012-1606(68)90045-6. [DOI] [PubMed] [Google Scholar]
- 6.Baldridge MT, King KY, Boles NC, Weksberg DC, Goodell MA. Quiescent haematopoietic stem cells are activated by IFN-gamma in response to chronic infection. Nature. 2010;465:793–7. doi: 10.1038/nature09135. [DOI] [PMC free article] [PubMed] [Google Scholar]
- 7.Burberry A, et al. Infection mobilizes hematopoietic stem cells through cooperative NOD-like receptor and Toll-like receptor signaling. Cell Host Microbe. 2014;15:779–91. doi: 10.1016/j.chom.2014.05.004. [DOI] [PMC free article] [PubMed] [Google Scholar]
- 8.Morrison SJ, Wright DE, Weissman IL. Cyclophosphamide/granulocyte colony- stimulating factor induces hematopoietic stem cells to proliferate prior to mobilization. Proc Natl Acad Sci U S A. 1997;94:1908–13. doi: 10.1073/pnas.94.5.1908. [DOI] [PMC free article] [PubMed] [Google Scholar]
- 9.Dutta P, et al. Myocardial infarction accelerates atherosclerosis. Nature. 2012;487:325–9. doi: 10.1038/nature11260. [DOI] [PMC free article] [PubMed] [Google Scholar]
- 10.Lowell CA, Niwa M, Soriano P, Varmus HE. Deficiency of the Hck and Src tyrosine kinases results in extreme levels of extramedullary hematopoiesis. Blood. 1996;87:1780–92. [PubMed] [Google Scholar]
- 11.Freedman MH, Saunders EF. Hematopoiesis in the human spleen. American Journal of Hematology. 1981;11:271–5. doi: 10.1002/ajh.2830110307. [DOI] [PubMed] [Google Scholar]
- 12.Tavassoli M, Weiss L. An electron microscopic study of spleen in myelofibrosis with myeloid metaplasia. Blood. 1973;42:267–79. [PubMed] [Google Scholar]
- 13.Johns JL, Christopher MM. Extramedullary hematopoiesis: a new look at the underlying stem cell niche, theories of development, and occurrence in animals. Veterinary Pathology. 2012;49:508–23. doi: 10.1177/0300985811432344. [DOI] [PubMed] [Google Scholar]
- 14.Kiel MJ, Yilmaz OH, Iwashita T, Terhorst C, Morrison SJ. SLAM family receptors distinguish hematopoietic stem and progenitor cells and reveal endothelial niches for stem cells. Cell. 2005;121:1109–21. doi: 10.1016/j.cell.2005.05.026. [DOI] [PubMed] [Google Scholar]
- 15.Miwa Y, et al. Up-regulated expression of CXCL12 in human spleens with extramedullary haematopoiesis. Pathology. 2013;45:408–16. doi: 10.1097/PAT.0b013e3283613dbf. [DOI] [PubMed] [Google Scholar]
- 16.Chow A, et al. CD169(+) macrophages provide a niche promoting erythropoiesis under homeostasis and stress. Nature Medicine. 2013;19:429–36. doi: 10.1038/nm.3057. [DOI] [PMC free article] [PubMed] [Google Scholar]
- 17.Morita Y, et al. Functional characterization of hematopoietic stem cells in the spleen. Experimental Hematology. 2011;39:351–359. e3. doi: 10.1016/j.exphem.2010.12.008. [DOI] [PubMed] [Google Scholar]
- 18.Ding L, Morrison SJ. Haematopoietic stem cells and early lymphoid progenitors occupy distinct bone marrow niches. Nature. 2013;495:231–5. doi: 10.1038/nature11885. [DOI] [PMC free article] [PubMed] [Google Scholar]
- 19.Ding L, Saunders TL, Enikolopov G, Morrison SJ. Endothelial and perivascular cells maintain haematopoietic stem cells. Nature. 2012;481:457–62. doi: 10.1038/nature10783. [DOI] [PMC free article] [PubMed] [Google Scholar]
- 20.Zhou BO, Yue R, Murphy MM, Peyer JG, Morrison SJ. Leptin-receptor-expressing mesenchymal stromal cells represent the main source of bone formed by adult bone marrow. Cell Stem Cell. 2014;15:154–68. doi: 10.1016/j.stem.2014.06.008. [DOI] [PMC free article] [PubMed] [Google Scholar]
- 21.Acharya A, Baek ST, Banfi S, Eskiocak B, Tallquist MD. Efficient inducible Cre- mediated recombination in Tcf21 cell lineages in the heart and kidney. Genesis. 2011;49:870–7. doi: 10.1002/dvg.20750. [DOI] [PMC free article] [PubMed] [Google Scholar]
- 22.Acar M, et al. Deep imaging of bone marrow shows non-dividing stem cells are perisinusoidal. Nature. 2015 doi: 10.1038/nature15250. In Press. [DOI] [PMC free article] [PubMed] [Google Scholar]
- 23.Akashi K, Traver D, Miyamoto T, Weissman IL. A clonogenic common myeloid progenitor that gives rise to all myeloid lineages. Nature. 2000;404:193–7. doi: 10.1038/35004599. [DOI] [PubMed] [Google Scholar]
- 24.de Boer J, et al. Transgenic mice with hematopoietic and lymphoid specific expression of Cre. European Journal of Immunology. 2003;33:314–25. doi: 10.1002/immu.200310005. [DOI] [PubMed] [Google Scholar]
- 25.Sugiyama T, Kohara H, Noda M, Nagasawa T. Maintenance of the hematopoietic stem cell pool by CXCL12-CXCR4 chemokine signaling in bone marrow stromal cell niches. Immunity. 2006;25:977–88. doi: 10.1016/j.immuni.2006.10.016. [DOI] [PubMed] [Google Scholar]
- 26.Madisen L, et al. A robust and high-throughput Cre reporting and characterization system for the whole mouse brain. Nature Neuroscience. 2010;13:133–40. doi: 10.1038/nn.2467. [DOI] [PMC free article] [PubMed] [Google Scholar]
- 27.DeFalco J, et al. Virus-assisted mapping of neural inputs to a feeding center in the hypothalamus. Science. 2001;291:2608–13. doi: 10.1126/science.1056602. [DOI] [PubMed] [Google Scholar]
- 28.Becker K, Jahrling N, Saghafi S, Dodt HU. Immunostaining, dehydration, and clearing of mouse embryos for ultramicroscopy. Cold Spring Harbor protocols. 2013;2013:743–4. doi: 10.1101/pdb.prot076521. [DOI] [PubMed] [Google Scholar]
- 29.Irizarry RA, et al. Exploration, normalization, and summaries of high density oligonucleotide array probe level data. Biostatistics. 2003;4:249–64. doi: 10.1093/biostatistics/4.2.249. [DOI] [PubMed] [Google Scholar]
- 30.Cesta MF. Normal structure, function, and histology of the spleen. Toxicol Pathol. 2006;34:455–65. doi: 10.1080/01926230600867743. [DOI] [PubMed] [Google Scholar]
- 31.Tronche F, et al. Disruption of the glucocorticoid receptor gene in the nervous system results in reduced anxiety. Nat Genet. 1999;23:99–103. doi: 10.1038/12703. [DOI] [PubMed] [Google Scholar]
- 32.Zhu X, Bergles DE, Nishiyama A. NG2 cells generate both oligodendrocytes and gray matter astrocytes. Development. 2008;135:145–57. doi: 10.1242/dev.004895. [DOI] [PubMed] [Google Scholar]
- 33.Zhu X, et al. Age-dependent fate and lineage restriction of single NG2 cells. Development. 2011;138:745–53. doi: 10.1242/dev.047951. [DOI] [PMC free article] [PubMed] [Google Scholar]
- 34.Logan M, et al. Expression of Cre Recombinase in the developing mouse limb bud driven by a Prxl enhancer. Genesis. 2002;33:77–80. doi: 10.1002/gene.10092. [DOI] [PubMed] [Google Scholar]
- 35.Rivers LE, et al. PDGFRA/NG2 glia generate myelinating oligodendrocytes and piriform projection neurons in adult mice. Nat Neurosci. 2008;11:1392–401. doi: 10.1038/nn.2220. [DOI] [PMC free article] [PubMed] [Google Scholar]
- 36.Cuttler AS, et al. Characterization of Pdgfrb-Cre transgenic mice reveals reduction of ROSA26 reporter activity in remodeling arteries. Genesis. 2011;49:673–80. doi: 10.1002/dvg.20769. [DOI] [PMC free article] [PubMed] [Google Scholar]
- 37.Holtwick R, et al. Smooth muscle-selective deletion of guanylyl cyclase-A prevents the acute but not chronic effects of ANP on blood pressure. Proc Natl Acad Sci U S A. 2002;99:7142–7. doi: 10.1073/pnas.102650499. [DOI] [PMC free article] [PubMed] [Google Scholar]
- 38.Xin HB, Deng KY, Rishniw M, Ji G, Kotlikoff MI. Smooth muscle expression of Cre recombinase and eGFP in transgenic mice. Physiol Genomics. 2002;10:211–5. doi: 10.1152/physiolgenomics.00054.2002. [DOI] [PubMed] [Google Scholar]
- 39.Wendling O, Bornert JM, Chambon P, Metzger D. Efficient temporally-controlled targeted mutagenesis in smooth muscle cells of the adult mouse. Genesis. 2009;47:14–8. doi: 10.1002/dvg.20448. [DOI] [PubMed] [Google Scholar]
Associated Data
This section collects any data citations, data availability statements, or supplementary materials included in this article.


