


Abstract
Differentially evolved responses to various stress conditions in plants are controlled by complex regulatory circuits of transcriptional activators, and repressors, such as transcription factors (TFs). To understand the general and condition-specific activities of the TFs and their regulatory relationships with the target genes (TGs), we have used a homogeneous stress gene expression dataset generated on ten natural ecotypes of the model plant Arabidopsis thaliana, during five single and six combined stress conditions. Knowledge-based profiles of binding sites for 25 stress-responsive TF families (187 TFs) were generated and tested for their enrichment in the regulatory regions of the associated TGs. Condition-dependent regulatory sub-networks have shed light on the differential utilization of the underlying network topology, by stress-specific regulators and multifunctional regulators. The multifunctional regulators maintain the core stress response processes while the transient regulators confer the specificity to certain conditions. Clustering patterns of transcription factor binding sites (TFBS) have reflected the combinatorial nature of transcriptional regulation, and suggested the putative role of the homotypic clusters of TFBS towards maintaining transcriptional robustness against cis-regulatory mutations to facilitate the preservation of stress response processes. The Gene Ontology enrichment analysis of the TGs reflected sequential regulation of stress response mechanisms in plants.
INTRODUCTION
Plants are sessile organisms and continuously face different harsh environmental conditions as well as biotic invasions in their natural habitat (1). The activation of the plant stress responses is a complex, multidimensional process, acquired through large-scale transcriptional and metabolic re-programming, which needs a sophisticated regulatory system (2–4). Gene expression variation responding to the surrounding environment confers phenotypic diversity within a species that can lead to consecutive adaptation and genome evolution (5–7). However, the underlying differentiations of transcriptional regulatory networks among different ecotypes of a given plant species remains largely unexplored (8,9). During the process of continuous evolution, the greater part of the plant stress regulatory networks is believed to have evolved through rigorous duplication of transcription factors (TFs) and their target genes (TGs) (10,11). Some core part of the regulatory interactions are conserved to variable degrees among genomes (12). A significant amount of research has been conducted (13) to understand plant responses to different single stress conditions by using various plant models (14,15). Plants have stress-specific adaptive responses as well as global responses, which protect the plants from more than one environmental stress. There are multiple stress perception and signalling pathways, some of which are stress-specific, but others may cross-talk at various steps of stress response processes (16). In a natural environment, plants are exposed to multiple stresses simultaneously, and interaction effect of multiple stresses at a time is more severe to plants (17–19). Very few genome-scale experiments have been conducted till date, to study the molecular level responses of plants to a combination of different stresses in multiple ecotypes (17). All of these experimental studies have reported that response of plants to combination stresses were unique and could not be inferred directly from the response of plants to each of the individual stresses.
Arabidopsis thaliana genome has ∼2000 TFs (20,21), however experimentally confirmed regulatory interactions were available for <100 TFs only (22,23). Significant efforts have been made to develop robust computational algorithms to extract regulatory information hidden in gene expression data to infer gene regulatory networks, to identify regulatory modules and condition-specific regulators (23–25). Such computational approaches to identify regulators of plant stress response, to infer gene regulatory networks and regulatory activities from experimental data has been reviewed in (26,27). Network-based algorithms are proven to be successful in dealing with underlying complexities of biological systems (28–30). From networks perspective, the regulatory interactions between TFs and their TGs can be presented as a directed, bipartite graph depicting transcriptional activation or repression (31). In general, such regulatory networks exhibit a scale-free topology, by the presence of few highly connected or highly central regulatory hubs (28). The topology of such transcriptional stress regulatory networks in plants can be used for predicting global and stress-specific transcriptional regulators (11,32). Network Component Analysis (NCA) is an approach, which has been successfully employed in several species including A. thaliana, to determine both activities and regulatory influences for a set of TFs on their TGs in various perspectives (33).
Most of the existing computationally inferred regulatory network models in A. thaliana were based on single stress treatment and from independent experiments (34–36). Integrative analysis of data from independent microarray experiments is challenging in most cases, mainly due to the lack of common standards regarding how to grow plants, conduct expression profile experiments, and finally, how to evaluate the resulting gene expression data (37). As a part of ERA-NET Plant Genomics MultiStress project, 10 different accessions of the model plant A. thaliana were subjected to a set of five individual stresses (Cold, Heat, High-light, Salt and Flagellin—FLG) and six combinations of these stresses (Salt + Heat, Cold + High-light, Cold + FLG, Salt + High-light, Heat + FLG and Heat + High-light) under same experimental and growth conditions. Flagellin (FLG) mimicked biotic stress, and rest of the four single stresses were abiotic stresses. In the present study, a regulatory network in A. thaliana has been constructed based on the assumption that high-dimensional mRNA expression profiles could be decomposed into low-dimensional regulatory signals driven through an interacting bipartite network between the regulating TFs and the regulated TGs (38). NCA was used to analyse this unique homogenous microarray dataset to predict the regulatory relationships between differentially stress-regulated TFs and their corresponding TGs during eleven stress conditions (five single and six combined stress conditions). Condition-dependent regulatory sub-networks were identified, and connectivity among the nodes (genes) were analysed for identifying highly connected hubs. Predicted interactions were compared with interactions derived from independent studies and manually retrieved database information. Hidden Markov Model (HMM) of known TF binding sites were identified and generated for 25 prominent stress-specific TF families from published experimental evidences (14,39). The predicted TF–TG regulatory interactions from gene expression data were tested using STIF algorithm (39) against these knowledge-based HMM profiles of known stress associated cis-regulatory elements (CREs). Clustering patterns of transcription factor binding sites (TFBS) on each of the TGs were analysed to identify clusters of TFBS (24). Gene set enrichment analysis (GSEA) was carried out to uncover functional association of the regulated TGs and overlapping interactions.
MATERIALS AND METHODS
Microarray data
The microarray data for this analysis were obtained from the ERA-NET Plant Genomics, ‘MultiStress’ project (http://www.eracaps.org/joint-calls/era-pg-funded-projects/2006-sub-call/multiple-stress-responses-and-adaptations). The comprehensive description of the ‘MultiStress’ experiments (207 arrays and 59 unique experiments) has been presented in (17). The microarray data were deposited at the Gene Expression Omnibus (GEO) with the record GSE41935. As a part of the MultiStress project, ten natural ecotypes of A. thaliana plants (Col-0, An-1, Cvi, Eri, Kas-1, Kon, Kyo-2, Ler, C24 and Sha) were subjected to the following stress treatments: Salt, Cold, Heat, High-light (HL), FLG, Salt + Heat, Cold + High-light, Cold + FLG, Salt + High-light, Heat + FLG and Heat + High-light. Combinations of high-light (800 μm photons m−2s−1), cold (10°C), heat (38°C), high salinity (100 mM NaCl) and foliar spray application of the bacterial elicitor (20 μM flagellin peptide flg22) were set up in environmentally controlled rooms (17). Arabidopsis NimbleGen 12-plex arrays were used for transcriptome profiling.
Statistical analysis
The published microarray dataset (GEO record GSE41935) was re-processed using the Robust Multi-array Average method implemented in the oligo package (40) in R programming language (41). For the current analysis, data from all of the 10 ecotypes were merged stress wise in an order to increase sample size and to minimize multiple testing errors (42). Stress-specific differentially regulated genes were identified by the Students t-test between control genotype and treatment effect (P < 0.01) using the normalized expression values (43). All the normalized stress gene expression data were compared to their respective controls. The resulting differential expression values were used to generate eleven lists of stress-regulated genes by considering the top 500 significant entries from each of the stress conditions. The unified genelist comprised of 3429 genes were used for further network-based analysis (Supplementary Table S1).
Finding Arabidopsis transcription factors (TFs)
A list of 1926 Arabidopsis TFs was compiled from DATF: a database of Arabidopsis TFs (20), PlantTFDB: the plant TF database (44) and ‘The Arabidopsis Information Resource’ (TAIR) (45). Eleven stress-wise lists of TFs differentially expressed during the stress conditions were generated by comparing the individual list of eleven differentially stress-regulated gene lists from each of the stress conditions against the compiled list of 1926 TFs (Supplementary Table S2). The overlap of the differentially regulated TFs among eleven different stress conditions were determined and visualized using Sungear tool (46).
TF binding motifs and sequence logos
The list of differentially regulated gene-list contained 294 TFs, out of which 187 were grouped into 39 TF families based on manual searches in the DATF database (20). The TFBS motifs for these families were generated from STIFDB2 (47), AGRIS (48) and published literature (49,50). We considered only the experimentally confirmed TFBS motifs. The relevant references have been included with respective PubMed IDs in (Supplementary Table S3). The sequence logos for the consensus TFBS were prepared using WebLogo tool (51) and provided in (Supplementary Figure S1).
Initial bipartite network reconstruction
Top 500 stress-regulated genes were chosen from each of the 11 stress experiments and performed on 10 A. thaliana ecotypes were united to a list of 3429 differentially stress-regulated genes. Among them, 294 were TFs and 3135 were TGs. A bipartite gene network was constructed using Pearson correlation coefficient as a measure (PCC threshold ≥0.70). This network contained 10 534 bipartite relations between 240 TFs and 1638 TGs. The constructed network is bipartite because they consist of two layers of nodes: TFs and TGs, with the links directed from the TFs to the TGs. This network was later fed into the ‘NCA’ algorithm to calculate differential activity profiles of the stress-regulated TFs.
Network component analysis (NCA)
NCA is a computational method for reconstructing the hidden regulatory signals or the transcription factor activities (TFAs) from gene expression data with known connectivity information regarding matrix decomposition (33).
NCA decomposition can be represented as:
 |
(1) |
Where, [E] is an expression matrix, [C] represents connectivity matrix and [T] corresponds to TFA matrix. Based on the formula (1), the decomposition of [E] into [C] and [T] can be achieved by minimizing the following objective function:
 |
(2) |
 |
In order to assure uniqueness of the solution of the Equation (2) up to a scaling factor, NCA criteria must be satisfied which includes:
The connectivity matrix [C] must have full-column rank.
When a node in the regulatory layer is removed along with all of the output nodes connected to it, the resulting network must be characterized by a connectivity matrix that still has full column rank.
T matrix must have full row rank.
The algorithm for NCA analysis is implemented in MATLAB by Liao et al. (33), and available online for download (http://www.seas.ucla.edu/∼liaoj/downloads.html). With NCA as reconstruction method, we predicted significant TFs and their connectivity strength on TGs and TFAs.
Simulated random network as control
The topological properties of the inferred regulatory network was compared with a random network created using Erdös-Rényi (ER) model (52). We used the G (n, M) formulation of ER model, where G was the random network, n was the total number of nodes and M was the number of connection among the nodes. In the simulated random network n and M were kept constant as in our NCA inferred regulatory network. The degree of a node (k) was calculated based on the total number of nearest neighbors. Random network generation and topological calculations were performed using igraph package in R (53).
Cross-validation of the predicted interactions
To evaluate the predicted TF–TG interactions, we have compiled a set of TFs, which had reported regulatory relationships in the protein interactome database (54) and the A. thaliana TF–TG interaction database (AtTFDB) (48). We have performed manual searches for predicted interactions in the AthaMap (55) and AraNet (56) databases. AthaMap provides a genome-wide map of potential TF and small RNA binding sites in A. thaliana. Data in AthaMap is based on published TF binding specificities, available as alignment matrices or experimentally determined single binding sites. AraNet is a probabilistic functional gene network of A. thaliana, constructed by the integration of 24 types of ‘omics’ data from multiple organisms, with each data type weighted according to how well it links genes that are known to function together in A. thaliana. As an independent comparison, we have also used the gene regulatory TF–TG network, reported in Vermeirssen et al., to compare with our predicted network (57).
Identification and cross-validation of transcription factor binding sites using HMM-based profile search using STIF algorithm
TFBSs of consensus nucleotide regions were taken from earlier studies (14,39,47). In addition, we have collected data regarding additional TFBSs, as described in a section above. Detailed methodology regarding searching for TFBS and generating HMM libraries are as described earlier (39). It has been reported in a recent study that overall, 89% of all upstream binding sites in A. thaliana were within 2 kb of the transcription start site (TSS), and highly significant matches of 73% were in 1-kb promoter (58). Therefore, TG sequences for 1-kb upstream from the TSS with their 5′ UTR were extracted by the data mining tool Biomart-Ensembl Plants (59) using TAIR version 10 (45). The STIF algorithm performed a sensitive sequence search that took the TFBS data as an HMM model and searched in both the forward and reverse direction of a target sequence to find potential binding sites. STIF program generated the output data with the start and end of the predicted binding site positions, chromosomal location, the orientation of the strand on forward or reverse, Z-score and normalization score. We have considered predicted TFBS at the Z-score threshold of 1.5 and above for further analysis.
Gene set enrichment analysis (GSEA)
The Biological Networks Gene Ontology (BiNGO) tool (60), an open-source Java based tool was used to determine significantly over-represented Gene Ontology (GO) terms associated with differentially regulated gene lists. The calculated P-values were Bonferroni corrected for minimizing multiple testing errors. Gene annotations were acquired from TAIR database (v10) (45) using biomaRt (59) data mining tool.
RESULTS
Our analytics approach followed the schematic presented in Figure 1. The NCA method requires two inputs: a set of gene expression profiles and an initial network of TFs and TGs. In this study, we utilized a unique A. thaliana gene expression dataset comprising of 207 arrays during eleven different stress conditions performed on ten ecotypes originated from different geographical locations. For maintaining the homogeneity, we have selected top 500 significantly stress-regulated genes from each stress condition and the final united list contained 3429 transcripts from all stress conditions (Supplementary Table S1).
Figure 1.

Methodology flow chart. (A) Top 500 stress-regulated genes were chosen from each of the eleven stress experiments performed on 10 Arabidopsis thaliana natural ecotypes. The united lists of stress-regulated genes contained 3429 genes, out of which 294 were TFs. A gene co-expression network was constructed using Pearson correlation coefficient (PCC ≥ 0.70), which contained 10 534 bipartite relations between 240 TFs and 1638 target genes (TGs). This network was later fed into the Network Component Analysis (NCA) algorithm, which then calculated the activity profiles of 194 stress-regulated TFs. Regulatory signal strength based filtering criteria (│r│≥0.75) was applied, which retained 5380 interactions between 182 TFs and 1199 TGs. Eleven regulatory sub-networks were extracted. Predicted connections were compared with independent interactions obtained from STIF analysis, AGRIS, AthaMap, AraNet and independent literature. (B) Flowchart of STIF algorithm, which was used for predicting transcription factor (TF) binding sites using HMM-based profile search. Total 187 stress-regulated TFs were classified into 39 TF Families and corresponding HMM profiles were generated. STIF algorithm predicted 10 474 interactions between 25 TF families and 1021 TGs at the Z-score threshold of 1.5. (adapted and modified with permission from (39))
Arabidopsis ecotypes have different transcriptome signatures while responding to eleven stress conditions
After the statistical analysis of the microarray data, we have observed significant variation among the 10 ecotypes while responding to 11 different stresses (here we consider the combination of two stresses as an independent stress). For example, cold treatment differentially regulated (P ≤ 0.01) 1950 genes in the southern ecotypes Cvi, while it regulated only 138 transcripts in the Col ecotype, known to be cold tolerant (61). Similar results were obtained for all other single and double stresses (summarized in Table 1). Intraspecific natural variation or within-species phenotypic variation, caused by spontaneously arising favourable mutations facilitate the evolutionary process, which contribute towards the local adaptation of the plant (62,63). Environmental stress is a key factor in determining the genome regulation, adaptive evolution and geographical distribution of any living organism including plants (64). A few speculations have been made elsewhere, regarding the contribution of cis-regulatory evolution in genetic variations during stress-responsive gene expression signatures that facilitate the adaptation to local climate (65–67). We wanted to explore the diverse activities of stress-regulated TFs and their connected TGs in A. thaliana during 11 stress conditions.
Table 1. Number of differentially regulated genes (P-value ≤ 0.01) in 10 ecotypes during 11 different stress conditions.
| ↓Stress/Ecotypes→ | Ler | Col | C24 | Eri | Kyo-2 | Cvi | Sha | An-1 | Kond | Kas-1 |
|---|---|---|---|---|---|---|---|---|---|---|
| Heat | 321 | 95 | 107 | 384 | 469 | 775 | 237 | 659 | 280 | 790 |
| High-light | 648 | 276 | 535 | 243 | 446 | 266 | 636 | 679 | 312 | 854 |
| Salt | 139 | 97 | 523 | 126 | 399 | 486 | 230 | 983 | 828 | 1396 |
| Cold | 470 | 138 | 1332 | 1025 | 702 | 1950 | 510 | 550 | 784 | 901 |
| FLG | 2863 | 586 | ||||||||
| Heat + FLG + Silwet | 558 | 399 | ||||||||
| Salt + Heat | 311 | 205 | 811 | 548 | 461 | 462 | 454 | |||
| Cold + High-light | 412 | 156 | ||||||||
| Salt + High-light | 234 | 233 | ||||||||
| Cold + FLG + Silwet | 249 | 950 | ||||||||
| Cold + Silwet | 186 | 181 | ||||||||
| Heat + High-light | 498 | 194 | ||||||||
| Cold + FLG + Silwet | 249 | 950 |
Number of differentially regulated genes (P ≤ 0.01) in 10 ecotypes during eleven different stress exposures. The transcriptomic profiling was conducted at single time point. Combined stress experiments and flagellin (FLG) experiments were performed only on Col and Ler ecotypes, except for the ‘salt + heat’ combined stress experiments, which were carried out in seven ecotypes. Silwet detergent was used for all the FLG treatments. All stress treatments were compared with their respective controls, except the treatments including FLG ( Heat + FLG and Cold + FLG), which were compared with control and silwet samples.
Stress-regulated transcription factors
The differentially stress-regulated gene lists contained many Arabidopsis TFs. Initially, we have created a list of total 1926 Arabidopsis TFs, as reported in TAIR (45), GO (68), DATF (20) and PlnTFDB (69). By comparing the list of differentially regulated genes in our data and the compiled reference list of Arabidopsis TFs, we identified 294 Arabidopsis TFs to be present among the differentially stress-regulated transcripts in our dataset (see Supplementary Table S2). Most of the TFs were differentially regulated in single conditions while very few TFs were regulated in multiple stress conditions. It was primarily observed from manual biocuration that the multi functional stress-regulated TFs were mostly related to circadian pathways controlling various physiological and developmental processes coupled with environmental stimuli (70,71). For example, At5g57660 (CONSTANS-like 5), known to be a core regulator involved photoperiodic flowering pathway was regulated in seven stress conditions (Figure 2) (72). A recent study has reported that flowering time variation in A. thaliana was associated with cis-regulatory variation in CONSTANS (73). This work establishes a link between regulatory mutations and evolutionary changes in plants at the species level (74). Two other TFs, namely At5g24470 (PSEUDO-RESPONSE REGULATOR, PRR5) and At5g47640 (NUCLEAR FACTOR Y SUBUNIT B2, NF-YB2) (75) were regulated in six stress conditions. Out of them, PRR5 is known to form a negative feedback loop within the Arabidopsis circadian clock (76). Five TFs, namely At1g25440 (B-BOX DOMAIN PROTEIN 15, BBX15), At1g71030 (MYB-LIKE 2, MYBL2) (77), At3g15540 (INDOLE-3-ACETIC ACID INDUCIBLE 19, IAA19) (78), At5g25190 (ETHYLENE AND SALT INDUCIBLE 3, ESE3) and At5g44260 (TANDEM CCCH ZINC FINGER PROTEIN 5, TZF5) were overlapped among five stress conditions. Eight TFs, At1g13260 (RELATED TO ABI3/VP1, RAV1)(79), At2g46790 (TOC1-LIKE PROTEIN 1, TL1)(80), At3g47500 (CYCLING DOF FACTOR 3, CDF3) (81), At3g54810 (GATA TRANSCRIPTION FACTOR 8, GATA8) (82), At3g59060 (PHYTOCHROME-INTERACTING FACTOR, PIL6) (83), At4g01250 (WRKY22) (84), At4g25480 (DEHYDRATION RESPONSE ELEMENT B1A, DREB1A) (85) and At5g02810 (PSEUDO-RESPONSE REGULATOR 7, PRR7) (86) were regulated in four stress conditions. Among other TFs, 19 were overlapped in three stress conditions and 58 were overlapped in two stress conditions. In total, 147 TFs were regulated only in single stress conditions (Figure 2 and Supplementary Table S2). Functional associations of some of these TFs in stress-related processes have been discussed in later sections.
Figure 2.
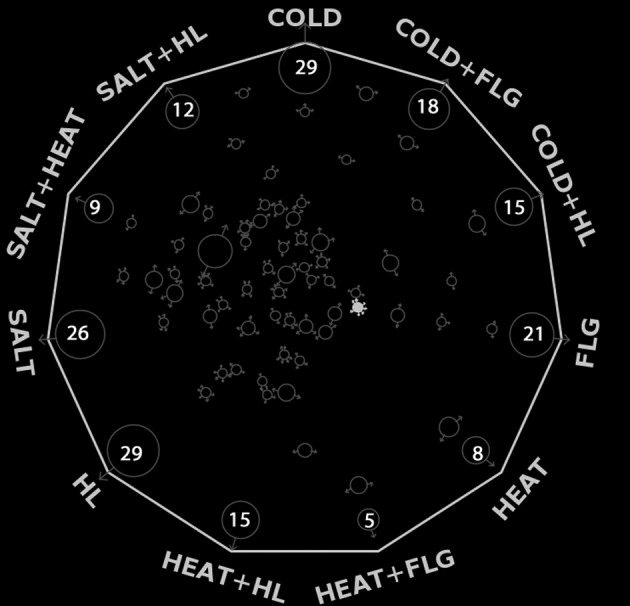
Overlapping statistics of stress-regulated TFs. Number of stress specific differentially regulated TFs are shown inside each circle along the periphery of the hendecagon. The small circles in the diagram represent overlapping TFs among different stress conditions. The arrow marks on the inner circles point towards the stress conditions in which they are significantly regulated. The size of the inner circles represents the number of TFs. The filled inner circle represents CONTSTANS-LIKE 5, which was significantly regulated in seven conditions. (Also see Supplementary Table S2).
Initial co-expression based network
To derive the TF activity profiles from gene expression data, an initial input network had to be constructed. Due to the limited availability of experimentally determined large-scale regulatory interactions in the model plant A. thaliana, we opted for an ab initio method to compile the initial bipartite network using our microarray data (17). In the list of differentially stress-regulated genes, we identified 294 TFs and 3135 TGs. We predicted the correlation between each pair of TF and TGs expression levels and retained an interaction if the correlation coefficient was significant (│r│> 0.7)(36,87–88). The network was represented in matrix form containing the regulatory information of each TF on their TGs. This analysis resulted in a network of 10 534 interactions with 240 TFs and 1638 TGs (Supplementary Table S4 and Figure S3A). There were 8450 positive interactions (activation) and 2084 negative interactions (repression).
Analysis of the connectivity patterns of the nodes in the transcriptional regulatory networks revealed that some TFs are involved in multiple sub-networks, suggesting a hierarchical structure whereby specific TFs might play major synergistic roles in the greater regulatory network, and function as multifunctional hubs. A subset of highly connected TFs in the global network are presented in Table 2. To obtain more information about these genes, we opted for biocuration method (89). Most of these highly connected genes mentioned above were also reported in published literature to be involved in important regulatory functions associated with representative GO categories, such as stress response, defence response, cellular development, regulation of secondary metabolism, etc. Evaluation of the regulatory sub-networks retained several of these regulatory hubs that control many aspects of cellular metabolism associated with plant stress responses. The biological relevance of some of these stress regulators has been described briefly in later sections (stress wise regulatory sub-networks).
Table 2. List of few highly connected stress regulators in the global TF–TG network.
| At-IDs | Alias | Annotations |
|---|---|---|
| At4g01250 | WRKY22 | WRKY FAMILY TRANSCRIPTION FACTOR 22 (84) |
| At3g24500 | MBF1C | MULTIPROTEIN BRIDGING FACTOR 1C (153) |
| At5g66620 | DAR6 | DA1-RELATED PROTEIN 6 |
| At1g72210 | bHLH096 | BASIC HELIX-LOOP-HELIX (BHLH) DNA-BINDING SUPERFAMILY PROTEIN 96 |
| At3g12130 | KH DOMAIN-CONTAINING PROTEIN/ ZINC FINGER (CCCH TYPE) FAMILY PROTEIN | |
| At4g18170 | WRKY28 | WRKY DNA-BINDING PROTEIN 28 (154) |
| At1g17380 | JAZ5 | JASMONATE-ZIM-DOMAIN PROTEIN 5 (155) |
| At1g32640 | ZBF1 | BASIC HELIX-LOOP-HELIX (BHLH) DNA-BINDING FAMILY PROTEIN (156,157) |
| At1g26780 | MYB117 | MYB DOMAIN PROTEIN 117 (158) |
| At1g71030 | MYBL2 | MYB-LIKE 2 (77) |
| At1g52150 | HB-15 | HOMEOBOX-LEUCINE ZIPPER FAMILY PROTEIN (159) |
| At4g17490 | ERF6 | ETHYLENE RESPONSIVE ELEMENT BINDING FACTOR 6 (160) |
| At4g26150 | CGA1 | CYTOKININ-RESPONSIVE GATA FACTOR 1 (161) |
| At4g23550 | WRKY29 | WRKY FAMILY TRANSCRIPTION FACTOR 29 (162) |
| At2g28550 | RAP2.7 | RELATED TO AP2.7 (163) |
| At3g48160 | DEL1 | DP-E2F-LIKE 1 (164) |
| At5g16600 | MYB43 | MYB DOMAIN PROTEIN 43 (165) |
| At1g80840 | WRKY40 | WRKY DNA-BINDING PROTEIN 40 |
| At2g33810 | SPL3 | SQUAMOSA PROMOTER BINDING PROTEIN-LIKE 3 |
| At5g47640 | NF-YB2 | NUCLEAR FACTOR Y, SUBUNIT B2 |
| At1g54160 | NFA5 | NUCLEAR FACTOR Y, SUBUNIT A5 |
| At3g50060 | MYB77 | MYB DOMAIN PROTEIN 77 (166) |
| At3g19360 | ZINC FINGER (CCCH-TYPE) FAMILY PROTEIN | |
| At3g59060 | PIL6 | PHYTOCHROME INTERACTING FACTOR 3-LIKE 6 (83) |
| At3g03750 | SDG20 | SET DOMAIN PROTEIN 20 |
| At5g50820 | NAC097 | NAC DOMAIN CONTAINING PROTEIN 97 |
| At3g07670 | RUBISCO METHYLTRANSFERASE FAMILY PROTEIN | |
| At5g67030 | ABA1/ZEP | ABA DEFICIENT 1/ZEAXANTHIN EPOXIDASE (167) |
| At4g25990 | CIL | CHLOROPLAST IMPORT APPARATUS CIA2-LIK |
| At4g17750 | HSF1 | HEAT SHOCK FACTOR 1 |
| At5g63160 | BT1 | BTB AND TAZ DOMAIN PROTEIN 1 (168) |
Comparison of the inferred co-regulatory network and a random control network
Biological networks are known to be scale-free in nature, which means the very little number of nodes has higher degrees, and maximum nodes have a lower degree (90,91). The inferred TF–TG network has exhibited a power law degree distribution, showing its scale-free nature (Figure 3B). In a random network, the degrees of the nodes follow a Poisson distribution (28), which indicated that most nodes had approximately the similar number of links, roughly equal to the network's average degree (Figure 3C).
Figure 3.

Topology of the predicted bipartite regulatory network visualized using Cytoscape software version 3.2.1 (169). (A) A topological overview of the predicted bipartite regulatory network between each pair of TF and TGs using PCC (│r│> 0.7). TFs are represented as triangles and TGs are represented as ellipses. This network is composed of 10 534 interactions (8450 positive interactions and 2084 negative interactions) between 240 TFs and 1638 TGs. The network topology has been simplified for presentation purpose. Detailed TF–TG interactions are provided in Supplementary Table S4. (B) The degree distribution of the nodes in the predicted regulatory network showed a power-law. (C) The degree distribution of the control network showed a Poisson distribution. (D) The topology of the regulatory sub-network during FLG stress condition. The TFs are represented as triangles and TGs are represented as ellipses. The size of the triangle reflects the number of connecting TGs to the corresponding TF. Previously reported key biotic stress regulators, such as WRKY22, MYB117, GNL, HSFA1A, MYB124, etc. are prominently visible as highly connected hubs in this network topology.
Transcription factor activities under eleven stress conditions
Considering the PCC as control strength for NCA, we constructed a matrix of regulatory relationships between the stress-regulated TFs and their corresponding TGs (92). Based on the assumption defined by NCA algorithm (33), we predicted the differential activity profiles for 194 TFs and their regulation strength to TGs (Supplementary Table S5). All the 194 TFs exhibited differential activity profiles across 11 stress conditions (Figure 4). Global TF activity profiles show differential behaviour across different stresses and ecotypes. NCA algorithm predicted 10 119 connections between 194 TFs and 1410 TGs (data not shown). Based on the calculated correlation values, 4041 positive correlations were considered as positive regulatory signals (activation) and 6078 negative correlations were considered as negative regulatory signals (repression). We have applied filtering criteria based on the strength of the calculated regulatory signals (│r│≥ 0.75). The resulting NCA predicted network contained 5380 pairs of interactions between 182 TFs and 1199 TGs (Supplementary Table S5).
Figure 4.

Predicted activity profiles of 194 stress-regulated TFs as a heat map. Activity profiles of 194 stress-regulated TFs (x-axis) during eleven stress conditions (y-axis), in 10 Arabidopsis ecotypes, predicted using NCA. The activity values were scaled to +1 to −1. Hierarchical clustering of the TFs performed using Pearson correlation with average linkage method. The predicted profiles show the differential activity of the TFs in different stress conditions, as well as in various ecotypes.
Comparision with interactions retrieved from literature, AthaMap and AraNet
Comprehensive experimental data for validating all the predicited TF–TG interactions are still lacking. We have cross-verified some of our TF–TG regulatory predictions with already available interactions from the few available resources. For this purpose, we have downloaded all the TF–TG interaction data from the AthaMap (55) and CCSB plant Interactome Database (AraNet) (54). With this comparison, we found 52 known interactions reported in AthaMap for six TFs and four interactions in AraNet for three TFs overlapped with our results (see Supplementary Table S7). The retrieved overlapping interactions were for the following TFs—EDF4 (ETHYLENE RESPONSE DNA BINDING FACTOR 4: At1g13260), PAP3 (PHYTOCHROME-ASSOCIATED PROTEIN 3: At1g09530), WRKY40 (WRKY DNA-BINDING PROTEIN 40: At1g80840), WRKY18 (WRKY DNA-BINDING PROTEIN 18: At4g31800), ABF1 (ABSCISIC ACID RESPONSIVE ELEMENT-BINDING FACTOR 1: At1g49720), GT2 (At1g76890), EFR11 (ETHYLENE RESPONSE FACTOR 11, At1g28370), NF-YA4 (NUCLEAR FACTOR Y, SUBUNIT A4: At2g34720) and RAV2 (RELATED TO ABI3/VP1 2: At1g68840).
To compare with an independent gene regulatory network, we have downloaded the TF–TG interactions from Vermeirssen et al. (57). The downloaded network contained 200 014 interactions between 1290 TFs and 11 938 TGs, generated from a heterogenous gene expression compendium of 199 abiotic conditions. Our network contained 10 534 TF–TG interactions between 240 TFs and 1638 TGs, generated from a homogeneous gene expression compendium of eleven biotic, abiotic and combined stress conditions. Only three stress conditions were overlapped (cold, heat and salt) between the two gene expression compendia. Despite the differences between both the studies, regarding the conditions, datasets used, number of TFs and TGs; in total, 649 TF–TG interactions were common between the two independent networks, representing 101 common TFs and 340 common TGs (see Supplementary Table S7).
Cross-validation using STIF algorithm
As an another independent cross-validation strategy, we have used a Hidden Markov Model based profile search computer algorithm called STIF (Stress-responsive TF). STIF can identify key TFBS in 1000 bp upstream with its 5′ UTR of a gene of interest (39). Hidden Markov Models of the TFBS were generated from previously published literature (see Supplementary Table S3). It has allowed the identification of predicted sites in 1000 bp upstream with its 5′ UTR of plant stress-responsive genes. STIF algorithm independently predicted 10 474 interactions (Z-score ≥ 1.5) between 25 unique TF families and 1021 individual TGs, based on HMM profile search in 1000 upstream with its 5′ UTR of the TGs for finding enrichment of TF binding sites (see Supplementary Table S8). The Z-score threshold of 1.5 was chosen because it was demonstrated to be appropriate to 90% sensitivity during the validation of STIF algorithm (39). We merged all the redundant TF–TG pairs and created a list of 9311 unique pairs of TF–TGs. A pairwise comparison between STIF predicted unique pairs of TF–TGs versus NCA-predicted 5380 pairs of TF–TG interactions identified 982 common interactions between the NCA predicted regulatory network and STIF based on HMM profile search. This overlap included 20 TF families and 529 TGs (see Supplementary Table S10).
Stress wise regulatory sub-networks
To extract the 11 stress specific sub-networks from the global TF–TG network, we have considered the stress-wise TF lists and extracted all the connections to the associated TGs from the global network. Highly connected regulatory hubs have been identified, and corresponding biological relevance were retrieved from published literature. Detailed information of the sub-networks is provided in Supplementary Table S6 and as network topology diagrams in Supplementary Figures S2–11. Brief descriptions of the eleven stress-wise sub-networks and functional relevance of few of the highly connected regulatory hubs are described below.
Heat stress sub-network
HSFA2 (HEAT SHOCK TRANSCRIPTION FACTOR A2: At2g26150) is one of the key regulatory components of the cytoplasmic protein response during heat shock in Arabidopsis (93). Arabidopsis HSFB1 (HEAT SHOCK TRANSCRIPTION FACTOR B1:At4g11660) and HSFB2b (HEAT SHOCK TRANSCRIPTION FACTOR B2: At3g54660) act as repressors of many heat-inducible HSFs, but positively regulate the acquired thermotolerance (94). All members of the DREB2 (DEHYDRATION-RESPONSIVE ELEMENT BINDING PROTEIN 2) family (DREB2A, DREB2B and DREB2C) are involved in the regulation of heat-responsive genes. Multiprotein bridging factor 1c (MBF1c) protein functions as a transcriptional regulator which binds DNA and controls the expression of 36 different transcripts during heat stress, including the important transcriptional regulator such as DREB2A, HSFs and several zinc finger proteins (95). Phytochrome interacting factors (PIFs) and pseudo response regulators (PRRs) are known to control growth and flowering in Arabidopsis, by regulating hundreds of TGs via temperature-dependant clock-regulated pathways (96). The putative dehydration-responsive element-binding protein At2g40350 contains one AP2 (APETALA 2) domain, is known to be associated with heat acclimation in Arabidopsis (97). (See Supplementary Figure S2).
Salt stress sub-network
The major hub in the salt stress sub-network is TIFY10A (At1g19180), which plays positive regulatory roles during responses to salt-alkaline stress in plants (98). Contrastingly, TIFY 11A (At1g17380), also known as JAZ5 (JASMONATE-ZIM-DOMAIN PROTEIN 5) protein acts as co-repressor, together with the Groucho/Tup1-type TOPLESS (TPL) for the activation of jasmonate signalling pathways during stress (99). PHYTOCLOCK 1 (PCL1: At3g46640) plays a crucial role in modulating circadian clock associated transcriptional circuitry, mediated by light signals in a synergistic manner (100). Several WRKY TFs such as At4g18170, At4g18170 are an important component in Arabidopsis salt stress pathways, as well as in defence-related regulons (101). (See Supplementary Figure S3).
Cold stress sub-network
The CBF (C-repeat binding factor) regulon has a major role in cold stress response in plants. CBF1, CBF2 and CBF3 (also known as DREB1B, DREB1C and DREB1A) genes appear to be present across plant species and are almost always present as a gene family. The CBF TFs regulate a set of about 100 downstream genes (102). There are other CBF-independent pathways and their complex interactions between different components also significantly contribute to cold tolerance. Regulators such as CIL (At4g25990), RAV1 (At1g13260), ZEP (At5g67030), LBD37 (LOB DOMAIN-CONTAINING PROTEIN 37: At5g67420), MYBL2 (At1g71030), IAA29 (At4g32280), OZF2 (OXIDATION-RELATED ZINC FINGER 2: At4g29190) are believed to control cold stress response processes in plants (103). It is also known that light and cold signals integrate and cross talk for cold tolerance, via a CBF and ABA-independent pathways (102). Previous studies have reported that circadian regulators LHY1 (LATE ELONGATED HYPOCOTYL 1: At1g01060), CCA1 (CIRCADIAN CLOCK ASSOCIATED 1: At2g46830), TL1 (At2g46790), COL1 (CONSTANS-LIKE 1: At5g15850) induced different cold stress response pathways in A. thaliana plants (104). Arabidopsis TOE protein (TARGET OF EARLY ACTIVATION TAGGED2: At2g28550) has been reported to regulate flowering time via circadian and micro-RNA mediated pathways during cold stress (105). (See Supplementary Figure S4).
High-light stress sub-network
Ethylene-responsive element binding factor 6 (ERF6: At4g17490) is the top most connected hub in high-light stress sub-network. It has recently been shown that the acclimation response to high-light is initiated within 10 seconds, by the upregulation of ERF6-mediated TF network in A. thaliana (106). The typical domain structure of BTB and TAZ domain proteins (BT1: At5g63160) is only observed in land plants, and they are involved in various stress signalling pathways (107). ZEP/ABA1 (At5g67030) encodes a single copy zeaxanthin epoxidase gene that functions in the first step of the biosynthesis of the key abiotic stress-responsive hormone abscisic acid (ABA). ZEP over-expression led to increased ABA levels and decreased water loss during high-light, heat, drought and salt tolerance. It has been demonstrated that the high-light response in A. thaliana involved ABA signalling between vascular and bundle sheath cells (108). Circadian regulators such as phytochrome interacting factor 3-like 6 (PIL6: At3g59060), CCT motif-containing response regulator protein TOC1 (At5g61380), CONSTANS-like 5 (COL5: At5g57660), plant-specific GATA-type zinc finger TF family protein (GATA8: At3g54810) are important components of light intensity-mediated signalling in A. thaliana, controlling various developmental processes, such as elongation, growth and flowering (96). (See Supplementary Figure S5).
Biotic (FLG) stress sub-network
WRKY22 (At4g01250) is one of the major regulatory hubs in the biotic stress sub-network (See Figure 3D). It acts as an early defence gene, also known to play a crucial role during signal crosstalk between pathogen-associated molecular patterns (PAMPs)-triggered immunity and photosynthesis (109). Another hub in the network is MYB117 (At1g26780), known to regulate alternative splicing events mediated by various stress signals (110). On the other hand, MYB124 (At1g14350) is associated with stomatal development in A. thaliana. Entry of pathogens into the host tissue via natural surface openings, such as stomata is the critical first step in causing infection. Hence, MYB124 may play an active role by regulating stomatal development to limit bacterial invasion as part of the plant innate immune system (111). HSFA1A (At4g17750) is a master regulator of the multiple stress conditions and believed to have played an important role during the cross-talking event of biotic and abiotic stresses (112). Cytokinin-responsive gata factor 1 (At4g26150) is involved in gibberellic acid-mediated signalling pathway, negative regulation of flower development, negative regulation of seed germination, during stress conditions (113).
Heat + FLG stress sub-network
Global warming and associated severity of biotic invasions and abiotic stresses are the major threat to agricultural production globally. The Heat + FLG (biotic) sub-network represents an ideal regulatory network model for studying biotic and abiotic stress combination. Similar to the FLG sub-network, WRKY22 (At4g01250) is again the top most highly connected regulatory hub in heat + FLG sub-network, reflecting its cross-talking role during biotic and abiotic combined stress conditions (109). SPOROCYTELESS (SPL) TFs (eg. SPL9: At2g42200) are master regulators of developmental transitions and known to be associated with microRNA pathway for the integration of multiple stress signals with developmental processes during the event of recurring multiple stresses (114). The NF-YB2 (At5g47640) is an important stress regulator, also known to required for COL5 (At5g57660) mediated photoperiod-dependent flowering (115). (See Supplementary Figure S6).
Cold + FLG stress sub-network
The simultaneous occurrence of cold temperature and pathogen attack results potentially negative impact on plants (18). Additionally, the underlying molecular mechanism of pathogen resistance obtained through cold stress is not understood well (116). WRKY22 (At4g01250) again appeared to be a core regulator in the Cold + FLG sub-network, confirming the strong role in biotic stress mediated defence signalling and crosstalk. Another member of the WRKY family, WRKY29 (109) is a well known transcriptional regulator of the innate immune response to biotic stress. ERF11 (At1g28370) and WRKY40 (At1g80840) are two multifunctional defence regulators in plants, with a broad range of reported evidence of their association with multiple stress signalling pathways such as MAPK cascade, ethylene-activated signalling pathway, jasmonic acid-mediated signalling pathway, salicylic acid-mediated signalling pathway, response to abscisic acid, response to auxin etc. (117). A recently published study has shown that the MYB96 or MYBCOV1 (At5g62470) integrated discrete responses of cold and abscisic acid signalling to activate the CBF-COR pathway in A. thaliana, ensuring plant adaptation to a diverse set of biotic and abiotic stresses (118). (See Supplementary Figure S7).
Cold + high-light stress sub-network
It has been hypothesized that putative light signalling pathways involved in low-temperature regulation of gene expression (119). TL1 (At2g46790) in the, also known as the pseudo-response regulator (PRR9) is an essential components of a temperature-sensitive circadian system (120). BTB and TAZ domain protein4 (BT4: At5g67480) regulates the expression of various abiotic stress-responsive gene expression by binding to different cis-acting elements in response to various stress signals (121). ZEP (At5g67030) is also a prominent hub in cold and high-light single stress regulatory network. (See Supplementary Figure S8).
Heat + high-light stress sub-network
Heat stress is a naturally co-occurring stress with high-light conditions, and both lead to dehydration or osmotic stresses in plants. NFYA5 (NUCLEAR FACTOR Y, SUBUNIT A5: At1g54160) is an important TF for drought resistance in Arabidopsis. Drought stress upregulates NFYA5 gene expression not only at the transcriptional level but also at the post-transcriptional level by down-regulating the expression of miR169a that targets NFYA5 transcript for cleavage (122). MYB70 (At2g23290) is one of the putative candidates of ‘Arabidopsis repressome’, reported to play key roles in diverse biological functions by negatively regulating genes involved in developmental, hormonal and stress signalling pathways (123). Under unfavourable environmental conditions such as an onset of heat, high-light, drought, salt, etc., the demand of the cell for protein folding can exceed its folding capacity and lead to the endoplasmic reticulum stress (ER-stress) by the accumulation of unfolded or misfolded proteins. The membrane-associated TF NAC089 (At5g22290) controls ER-stress induced programmed cell death in plants (124). Modulation of DNA methylation in response to environmental stress represents a potentially robust mechanism to regulate gene expression networks in plants. SDG20 (SET DOMAIN PROTEIN 20: At3g03750) is believed to be involved in the regulation of the Arabidopsis methylome through H3K9 methylation (125). (See Supplementary Figure S9).
Salt + heat stress sub-network
Salt stress and heat shock are two of the commonly co-occurring environmental conditions particularly for the plants in arid and semi-arid regions (126). The combination of heat and salt stress also generates drought and osmotic stress in the effected plants. The top most highly connected regulatory gene in the salt + heat sub-network is At2g40350, which encodes a member of the DREB subfamily A-2 of ERF/AP2 TF family protein involved in the response to drought (127). Similarly, MYB60 (At1g08810) controls the stomatal aperture, which helps to limit water loss during drought (128). The important regulatory role of WRKY22 (At4g01250) in stress signalling and crosstalk events during multiple conditions was mentioned above. PHYTOCHROME INTERACTING FACTOR 3 (PIF3/POC3) was shown to control transcriptional network in response to initial light exposure, and later, to develop sensitivity to other stress signals like drought and, reactive oxygen species (ROS) upon prolonged exposure (129). ROS-mediated homeostasis and signalling events implicated during drought and salinity stresses has been well demonstrated in earlier studies (130). (See Supplementary Figure S10).
Salt + high-light stress sub-network
ERF6 (At4g17490) is a member of the ERF TF family protein involve in response to ROS and light induced stress in plants (131). It has also been reported that modulation of ethylene responses affected plant salt-stress responses (132). Another hub in the salt + high-light network is At5g44260, which encodes a tandem zinc finger C-x8-C-x5-C-x3-H type family protein, involves in early stage response to ethylene in Arabidopsis. SOC1 (SUPPRESSOR OF OVEREXPRESSION OF CO 1 : At2g45660) is a key component of Arabidopsis flowering time gene regulatory network and was shown to act as a negative regulator of the salinity stress-response via CYCLIN-DEPENDENT KINASE G2 (CDKG2) (133). The important role of plant-specific GATA-type zinc finger TF family protein (GATA8: At3g54810) in light intensity mediated signalling in A. thaliana was mentioned in the high-light stress sub-network section above (96). (See Supplementary Figure S11).
Clustering of transcription factor binding sites (TFBS)
Regulation of gene expression is executed through the combinatorial action of many CREs, including core promoters, promoter-proximal elements, as well as a various cis-regulatory modules (CRMs) that are situated distally from the TSSs, such as enhancers, silencers, insulators and tethering elements (134–136). We have analysed the clustering patterns of the TFBSs in the regulatory regions of each of the stress-regulated TGs. As many as 852 TF–TG pairs had multiple binding sites for the same TF, also known as homotypic clusters of TFBS (HCTs) (137). In total, 28 TF–TG pairs had five HCTs, 164 pairs had four HCTs, 266 pairs had three HCTs and 394 pairs had two HCTs. Remaining 8359 pairs of TF–TG interactions were singletons and occurred in heterotypic clusters of TFBSs (see Supplementary Table S9). Heterotypic clusters of TFBSs are CRMs consisting of unique classes of TFs in different combinatorial patterns. The homotypic clusters of multiple TFBSs were prominently enriched for MYB, bHLH (BASIC HELIX-LOOP-HELIX) and bZIP (BASIC LEUCINE-ZIPPER) TF families, which were previously reported as ‘versatile master regulators’ controlling diverse stress signalling events in plants (138).
Gene set enrichment analysis (GSEA) of the overlapping interactions suggests their involvement in stress response processes
To obtain an overview of the functional categories enriched among the overlapping TGs (529 genes), GSEA was performed using BiNGO tool (60). The network-based visualization of statistically significant over-represented functional categories identified four distinct clusters (Figure 5 and Supplementary Table S11).
Cluster 1: primary processes (photosynthesis, carbohydrate metabolism, lipid metabolism, growth, anatomical development, reproduction, DNA replication, etc.).
Cluster 2: secondary processes (processes related to secondary metabolism, small molecule metabolic processes, production of defence-related secondary metabolite, etc.).
Cluster 3: stress response (response to heat, salt, cold, wounding, radiation, water deprivation, other organisms, etc.).
Cluster 4: regulation of biological processes.
Figure 5.

GSEA of the overlapping TGs. Network based visualization of GSEA results identified four clusters of statistically significant over-represented functional categories. Parental GO terms are shown in the centre. The differentially regulated primary processes were present in cluster 1, and secondary processes in cluster 2. The various stress response processes were distinctly clustered together in cluster 3. Processes that regulate the series of complex stress—response events were grouped together in cluster 4. These categories reflect the sequential modulation of stress-response processes. Upon exposure to stressed conditions, plants compromise with primary processes such as primary metabolism, photosynthesis, reproduction, to allocate extra resources to the activation of various defence and stress-response processes and secondary metabolic processes. Nodes were coloured according to their corrected P-values. Node sizes reflected the total number of genes in that category.
DISCUSSION
Reconstruction of gene regulatory networks using gene expression data from multiple ecotypes, and under multiple conditions is an ideal strategy for identifying important regulators that control the dynamic behaviour of cellular processes related to stress responses in plants. Using a homogenous dataset from a uniform experiment has the advantage of minimizing the potential influence generated by experimental heterogeneity. To explore the transcriptional regulation in plants during multiple stress conditions, we have constructed an in-silico transcriptional regulatory network model in cellular responses to 11 stresses (five single and six combined) in A. thaliana, using a homogenous gene expression dataset from ten natural ecotypes. Considering the number of differentially regulated genes as a measure, signatures of transcriptomic response variations were observed among the ten Arabidopsis ecotypes while responding to the eleven stress conditions. There were variations within an ecotype while responding to different stresses, as well as variations among different ecotypes while responding to a particular stress condition. There were observable differences between responses to single stress versus response to the combination of stresses (Table 1). Regulation of gene expression is a critical component in development and evolution of living beings along with genome composition, structure and function. Responding to the changing environmental conditions, a functional cell of any living organism would alter the expression of particular genes through transcriptional regulation to make it possible to preserve the robustness of cellular processes (139).
In this paper, we focused mostly on inferring a global stress regulatory network and 11 conditions dependent regulatory sub-networks in the model plant A. thaliana by uniting the dataset from 10 ecotypes and 11 stress conditions. The united lists of stress-regulated genes from all the stress conditions and 10 ecotypes contained 3429 differentially expressed genes, out of which 294 were Arabidopsis TFs. The initial bi-partite network contained 10 534 interactions between 240 stress regulated TFs and 1638 TGs. NCA algorithm was able to predict activity profiles of 194 TFs. Applying the regulatory signal strength based filtering criteria, 5380 connections were retained between 182 TFs and 1199 TGs. The stress-wise lists of differentially expressed TFs were used to generate eleven condition-dependent regulation regulatory sub-networks. Very few TFs were differentially expressed in more than one stress conditions, and most of the multifunctional regulators were directly or indirectly related to circadian pathways, controlling various physiological and developmental processes coupled with environmental stimuli. Circadian clocks consist of positive and negative elements that comprise a transcriptional feedback loop (140). There have been several reports about circadian clock genes that are not essential for oscillator control under diurnal cycles of light and dark (141). Many such circadian clocks of higher plants were believed to act as the master regulator by orchestrating the various layers of metabolic and physiological processes that coordinate growth and performance under a changing environment (142,143). Our analysis identified few highly connected clock-related genes in multiple stress conditions. Stress-specific lists of TFs were identified for five single and six combined stress treatments. Many of the single stress-regulated TFs were already reported in benchmarked literature elsewhere (14,17,19,144). However, results for combined stress-regulated TFs were not available in multiple ecotypes of A. thaliana. We have created six lists of TFs for each of the combined stress conditions used in our analysis, and extracted their corresponding interactions with TGs. Information regarding regulation of combined stress gene expression is of great interest to study signalling cross-talk events during combined stress conditions (145). It is a well-known fact that TFs alter their interactions to varying degrees in response to diverse stimuli, thereby rewiring the whole network topology. By analysing the stress regulatory sub-networks, we have observed that a few TFs serve as multifunctional regulatory hubs, but most act transiently only responding to certain conditions (146). Finding functional association of the condition-specific regulators in combined stress conditions is difficult due to the non-availability of published information in this direction. The multifunctional regulators maintain the core stress response processes while the transient regulators confer the specificity to certain conditions by regulating a diverse range of downstream TGs. The relationship between network topology and TF activity dynamics allow differential utilization of the same underlying network topology by different regulators under different conditions (3). Our dataset contained of gene expression data from single time point only (17). Together with the utilization of multiple ecotypes, and multiple stress conditions (both single and combined), a high-resolution time series analysis of gene expression profiles would be an ideal experiment to conduct in future, for capturing the dynamic behaviour of the TF–TG interactions during multiple stress conditions.
As an independent cross-validation strategy to verify co-expression based regulatory network, STIF algorithm was employed to find enrichment of TFBSs in the 1000 bp upstream with its 5′ UTR of the TGs. Comparison between the predicted regulatory network and STIF-based predictions had identified 982 common interactions between 20 different TF families and 529 unique TGs. The STIF algorithm has identified 852 pairs of homotypic clusters of TFBSs (HCTs). Comprehensive models of gene expression consider how each TF contributes independently to gene expression. However, researchers have now demonstrated the complex regulation of gene expression by combinatorial promoters (147). Identified HCTs in the predicted stress regulatory TF–TG network were mainly comprised of MYB, bHLH and bZIP TF families. The stress-regulated lists of TFs contained 17 MYBs, 16 bHLHs and 7 bZIPs members of TFs respectively (see Supplementary Table S3). Literature survey confirmed the role of MYB, bHLH and bZIP TFs as conserved ‘versatile master regulators’ in signalling pathways in responses to multiple stress conditions in plants (138,148–149). Our results suggest that the homotypic clusters of TFBSs may play important evolutionary role for preserving the transcriptional robustness of the key stress regulators by avoiding any mutational effect in the cis-regulatory regions. Clustering of multiple TFBSs for the same TF is a common feature of CRMs in lower organisms (137). Several reports have indicated the potential role of cis-regulatory evolution on natural variations in stress-responsive gene expression in plants (61,66,73,150). However, the occurrence of such CRMs in the plant genome has remained largely unknown (58). Large scale experimental screening of cis-regulatory regions of stress associated genes in multiple ecotypes, together with sequence polymorphism data would be able to confirm the evolutionary significance of the HCTs in stress response, acclimation and successive evolution. Generating large-scale phenotypic and physiological data and combining predictive models with downstream experimental charecterization would also be an added advantage in this regard.
Network-based GO analysis of the overlapping TGs has shown the significant over-representations of sequentially activated defence response processes. The complex orchestration of plant biotic and abiotic defence responses require an adequate supply of energy (149,151). While modulating the multitude of defence response processes during a physiologically stressed condition, plants have to re-organize some of the resources of central metabolism by allocating resources for the activation of defence-related processes (152). Along with secondary metabolism, primary metabolism of the plant is also differentially regulated during a stressful event and finally lead to smoothly orchestrated defence responses. The resulting GO-network (Figure 5) reflects this observation.
Experimental evidences regarding TF–TG interactions in plant systems are very limited (58). Again, within the available information, condition-specific regulatory interactions in plants are almost rare. It poses a significant challenge in benchmarking computational predictions. By cross-comparing of our predicted network with the limited information retrieved from AraNet and AthaMap, we were able to identify few known interactions. Considering the differences in used data, conditions and methods, the overlap of 649 TF–TG interactions (out of 10 534) with an independently predicted network was relatively good (57). Our study has suggested many novel interactions between key TFs and differently expressed TGs during the stress response during 11 conditions. This information will help to identify and experimentally validate molecular markers or relevant stress regulators by forward genetics experiments to develop single and multi-stress tolerant crop varieties. In addition, similar integrative approaches could be employed to study networks regulating any biological process in any biological system.
Supplementary Material
Acknowledgments
P.B., N.D.J. and A.M.B. acknowledge infrastructure support from the Norwegian University of Science and Technology. M.N.B.N., K.S. and R.S. would like to acknowledge National Centre for Biological Sciences, Tata Institute of Fundamental Research, Bangalore, India for infrastructure support.
Footnotes
Present addresses:
Pankaj Barah, Computational Oncology Group, Division Theoretical Bioinformatics, German Cancer Research Center (DKFZ), Im Neuenheimer Feld 280, Heidelberg 69120, Germany.
Mahantesha Naika B. N., Department of Biotechnology and Crop Improvement, University of Horticultural Sciences, Bagalkot, Karnataka 587104, India.
Khader Shameer, Icahn Institute and Dept. of Genetics and Genomic Sciences, Icahn School of Medicine at Mount Sinai 1425 Madison Avenue NY 10029, USA.
SUPPLEMENTARY DATA
Supplementary Data are available at NAR Online.
FUNDING
The Multi-Stress transcriptomic experiments were funded by the European Research Area Network Plant Genomics (ERA-NET PG) (http://www.erapg.org/) project; Biotechnology and Functional Genomics (FUGE) and FRIMEDBIO programs of the Norwegian Research Council [RCN184146 and 214329 to A.M.B]; Department of Biotechnology, India for the development of STIF algorithm (to K.S., R.S.); NCBS-Bridge Postdoctoral Fellowship of the National Centre for Biological Sciences, TIFR, Bangalore, India (to M.N.B.N.). Funding for open access charge: Norwegian Research Council.
Conflict of interest statement. None declared.
REFERENCES
- 1.Barah P., Bones A.M. Multidimensional approaches for studying plant defense against insects: from ecology to omics and synthetic biology. J. Exp. Bot. 2015;66:479–493. doi: 10.1093/jxb/eru489. [DOI] [PubMed] [Google Scholar]
- 2.Rushton P.J., Reinstadler A., Lipka V., Lippok B., Somssich I.E. Synthetic plant promoters containing defined regulatory elements provide novel insights into pathogen- and wound-induced signaling. Plant Cell. 2002;14:749–762. doi: 10.1105/tpc.010412. [DOI] [PMC free article] [PubMed] [Google Scholar]
- 3.Jothi R., Balaji S., Wuster A., Grochow J.A., Gsponer J., Przytycka T.M., Aravind L., Babu M.M. Genomic analysis reveals a tight link between transcription factor dynamics and regulatory network architecture. Mol. Syst. Biol. 2009;5:294. doi: 10.1038/msb.2009.52. [DOI] [PMC free article] [PubMed] [Google Scholar]
- 4.Chae L., Lee I., Shin J., Rhee S.Y. Towards understanding how molecular networks evolve in plants. Curr. Opin. Plant Biol. 2012;15:177–184. doi: 10.1016/j.pbi.2012.01.006. [DOI] [PubMed] [Google Scholar]
- 5.Carroll S.P., Jorgensen P.S., Kinnison M.T., Bergstrom C.T., Denison R.F., Gluckman P., Smith T.B., Strauss S.Y., Tabashnik B.E. Applying evolutionary biology to address global challenges. Science. 2014;346:1245993. doi: 10.1126/science.1245993. [DOI] [PMC free article] [PubMed] [Google Scholar]
- 6.Yamaguchi-Shinozaki K., Shinozaki K. Transcriptional regulatory networks in cellular responses and tolerance to dehydration and cold stresses. Annu. Rev. Plant Biol. 2006;57:781–803. doi: 10.1146/annurev.arplant.57.032905.105444. [DOI] [PubMed] [Google Scholar]
- 7.Garfield D.A., Runcie D.E., Babbitt C.C., Haygood R., Nielsen W.J., Wray G.A. The impact of gene expression variation on the robustness and evolvability of a developmental gene regulatory network. PLoS Biol. 2013;11:e1001696. doi: 10.1371/journal.pbio.1001696. [DOI] [PMC free article] [PubMed] [Google Scholar]
- 8.Chen W.J., Chang S.H., Hudson M.E., Kwan W.K., Li J., Estes B., Knoll D., Shi L., Zhu T. Contribution of transcriptional regulation to natural variations in Arabidopsis. Genome Biol. 2005;6:R32. doi: 10.1186/gb-2005-6-4-r32. [DOI] [PMC free article] [PubMed] [Google Scholar]
- 9.Delker C., Poschl Y., Raschke A., Ullrich K., Ettingshausen S., Hauptmann V., Grosse I., Quint M. Natural variation of transcriptional auxin response networks in Arabidopsis thaliana. Plant Cell. 2010;22:2184–2200. doi: 10.1105/tpc.110.073957. [DOI] [PMC free article] [PubMed] [Google Scholar]
- 10.Kaufmann K., Pajoro A., Angenent G.C. Regulation of transcription in plants: mechanisms controlling developmental switches. Nat. Rev. Genet. 2010;11:830–842. doi: 10.1038/nrg2885. [DOI] [PubMed] [Google Scholar]
- 11.Chen W.J., Zhu T. Networks of transcription factors with roles in environmental stress response. Trends Plant Sci. 2004;9:591–596. doi: 10.1016/j.tplants.2004.10.007. [DOI] [PubMed] [Google Scholar]
- 12.Babu M.M., Luscombe N.M., Aravind L., Gerstein M., Teichmann S.A. Structure and evolution of transcriptional regulatory networks. Curr. Opin. Struct. Biol. 2004;14:283–291. doi: 10.1016/j.sbi.2004.05.004. [DOI] [PubMed] [Google Scholar]
- 13.Hirt H. Plant stress biology: From genomics to systems biology. Weinheim: Wiley-VCH Verlag GmbH & Co. KGaA; 2009. [Google Scholar]
- 14.Naika M., Shameer K., Mathew O.K., Gowda R., Sowdhamini R. STIFDB2: an updated version of plant stress-responsive transcription factor database with additional stress signals, stress-responsive transcription factor binding sites and stress-responsive genes in Arabidopsis and rice. Plant Cell Physiol. 2013;54:e8. doi: 10.1093/pcp/pcs185. [DOI] [PMC free article] [PubMed] [Google Scholar]
- 15.Ahuja I., de Vos R.C., Bones A.M., Hall R.D. Plant molecular stress responses face climate change. Trends Plant Sci. 2010;15:664–674. doi: 10.1016/j.tplants.2010.08.002. [DOI] [PubMed] [Google Scholar]
- 16.Lopez-Maury L., Marguerat S., Bahler J. Tuning gene expression to changing environments: from rapid responses to evolutionary adaptation. Nat. Rev. Genet. 2008;9:583–593. doi: 10.1038/nrg2398. [DOI] [PubMed] [Google Scholar]
- 17.Rasmussen S., Barah P., Suarez-Rodriguez M.C., Bressendorff S., Friis P., Costantino P., Bones A.M., Nielsen H.B., Mundy J. Transcriptome responses to combinations of stresses in Arabidopsis. Plant Physiol. 2013;161:1783–1794. doi: 10.1104/pp.112.210773. [DOI] [PMC free article] [PubMed] [Google Scholar]
- 18.Mittler R. Abiotic stress, the field environment and stress combination. Trends Plant Sci. 2006;11:15–19. doi: 10.1016/j.tplants.2005.11.002. [DOI] [PubMed] [Google Scholar]
- 19.Suzuki N., Rivero R.M., Shulaev V., Blumwald E., Mittler R. Abiotic and biotic stress combinations. New Phytol. 2014;203:32–43. doi: 10.1111/nph.12797. [DOI] [PubMed] [Google Scholar]
- 20.Guo A., He K., Liu D., Bai S., Gu X., Wei L., Luo J. DATF: a database of Arabidopsis transcription factors. Bioinformatics. 2005;21:2568–2569. doi: 10.1093/bioinformatics/bti334. [DOI] [PubMed] [Google Scholar]
- 21.Weirauch M.T., Yang A., Albu M., Cote A.G., Montenegro-Montero A., Drewe P., Najafabadi H.S., Lambert S.A., Mann I., Cook K., et al. Determination and inference of eukaryotic transcription factor sequence specificity. Cell. 2014;158:1431–1443. doi: 10.1016/j.cell.2014.08.009. [DOI] [PMC free article] [PubMed] [Google Scholar]
- 22.Davuluri R.V., Sun H., Palaniswamy S.K., Matthews N., Molina C., Kurtz M., Grotewold E. AGRIS: Arabidopsis gene regulatory information server, an information resource of Arabidopsis cis-regulatory elements and transcription factors. BMC Bioinformatics. 2003;4:25. doi: 10.1186/1471-2105-4-25. [DOI] [PMC free article] [PubMed] [Google Scholar]
- 23.Van de Velde J., Heyndrickx K.S., Vandepoele K. Inference of transcriptional networks in Arabidopsis through conserved noncoding sequence analysis. Plant Cell. 2014;23:2729–2745. doi: 10.1105/tpc.114.127001. [DOI] [PMC free article] [PubMed] [Google Scholar]
- 24.Segal E., Shapira M., Regev A., Pe'er D., Botstein D., Koller D., Friedman N. Module networks: identifying regulatory modules and their condition-specific regulators from gene expression data. Nat. Genet. 2003;34:166–176. doi: 10.1038/ng1165. [DOI] [PubMed] [Google Scholar]
- 25.Babu M.M., Lang B., Aravind L. Methods to reconstruct and compare transcriptional regulatory networks. Methods Mol. Biol. 2009;541:163–180. doi: 10.1007/978-1-59745-243-4_8. [DOI] [PubMed] [Google Scholar]
- 26.Koryachko A., Matthiadis A., Ducoste J.J., Tuck J., Long T.A., Williams C. Computational approaches to identify regulators of plant stress response using high-throughput gene expression data. Curr. Plant Biol. 2015;3–4:20–29. [Google Scholar]
- 27.Wang R.S., Zhang X.S., Chen L. Inferring transcriptional interactions and regulator activities from experimental data. Mol. Cells. 2007;24:307–315. [PubMed] [Google Scholar]
- 28.Barabasi A.L., Oltvai Z.N. Network biology: understanding the cell's functional organization. Nat. Rev. Genet. 2004;5:101–113. doi: 10.1038/nrg1272. [DOI] [PubMed] [Google Scholar]
- 29.Bassel G.W., Gaudinier A., Brady S.M., Hennig L., Rhee S.Y., De Smet I. Systems analysis of plant functional, transcriptional, physical interaction, and metabolic networks. Plant Cell. 2012;24:3859–3875. doi: 10.1105/tpc.112.100776. [DOI] [PMC free article] [PubMed] [Google Scholar]
- 30.Chawla K., Barah P., Kuiper M., Bones A. In: Omics and Plant Abiotic Stress Tolerance. Tuteja N, Gill S, Tuteja R, editors. Oak Park, IL: Bentham Publishers; 2011. pp. 163–172. [Google Scholar]
- 31.Alvarez A., Woolf P.J. Partially observed bipartite network analysis to identify predictive connections in transcriptional regulatory networks. BMC Syst. Biol. 2011;5:86. doi: 10.1186/1752-0509-5-86. [DOI] [PMC free article] [PubMed] [Google Scholar]
- 32.Long T.A., Brady S.M., Benfey P.N. Systems approaches to identifying gene regulatory networks in plants. Annu. Rev. Cell Dev. Biol. 2008;24:81–103. doi: 10.1146/annurev.cellbio.24.110707.175408. [DOI] [PMC free article] [PubMed] [Google Scholar]
- 33.Liao J.C., Boscolo R., Yang Y.L., Tran L.M., Sabatti C., Roychowdhury V.P. Network component analysis: reconstruction of regulatory signals in biological systems. Proc. Natl. Acad. Sci. U.S.A. 2003;100:15522–15527. doi: 10.1073/pnas.2136632100. [DOI] [PMC free article] [PubMed] [Google Scholar]
- 34.Carrera J., Rodrigo G., Jaramillo A., Elena S.F. Reverse-engineering the Arabidopsis thaliana transcriptional network under changing environmental conditions. Genome Biol. 2009;10:R96. doi: 10.1186/gb-2009-10-9-r96. [DOI] [PMC free article] [PubMed] [Google Scholar]
- 35.Mao L., Hemert J.L., Dash S., Dickerson J.A. Arabidopsis gene co-expression network and its functional modules. BMC Bioinformatics. 2009;10:346. doi: 10.1186/1471-2105-10-346. [DOI] [PMC free article] [PubMed] [Google Scholar]
- 36.Aluru M., Zola J., Nettleton D., Aluru S. Reverse engineering and analysis of large genome-scale gene networks. Nucleic Acids Res. 2012;41:e24. doi: 10.1093/nar/gks904. [DOI] [PMC free article] [PubMed] [Google Scholar]
- 37.Moreau Y., Aerts S., De Moor B., De Strooper B., Dabrowski M. Comparison and meta-analysis of microarray data: from the bench to the computer desk. Trends Genet. 2003;19:570–577. doi: 10.1016/j.tig.2003.08.006. [DOI] [PubMed] [Google Scholar]
- 38.Holter N.S., Mitra M., Maritan A., Cieplak M., Banavar J.R., Fedoroff N.V. Fundamental patterns underlying gene expression profiles: simplicity from complexity. Proc. Natl. Acad. Sci. U.S.A. 2000;97:8409–8414. doi: 10.1073/pnas.150242097. [DOI] [PMC free article] [PubMed] [Google Scholar]
- 39.Sundar A.S., Varghese S.M., Shameer K., Karaba N., Udayakumar M., Sowdhamini R. STIF: identification of stress-upregulated transcription factor binding sites in Arabidopsis thaliana. Bioinformation. 2008;2:431–437. doi: 10.6026/97320630002431. [DOI] [PMC free article] [PubMed] [Google Scholar]
- 40.Irizarry R.A., Bolstad B.M., Collin F., Cope L.M., Hobbs B., Speed T.P. Summaries of Affymetrix GeneChip probe level data. Nucleic Acids Res. 2003;31:e15. doi: 10.1093/nar/gng015. [DOI] [PMC free article] [PubMed] [Google Scholar]
- 41.R Core Team. R Foundation for Statistical Computing. Vienna: R Foundation; 2012. [Google Scholar]
- 42.Jorstad T.S., Langaas M., Bones A.M. Understanding sample size: what determines the required number of microarrays for an experiment? Trends Plant Sci. 2007;12:46–50. doi: 10.1016/j.tplants.2007.01.001. [DOI] [PubMed] [Google Scholar]
- 43.Kerr M.K., Martin M., Churchill G.A. Analysis of variance for gene expression microarray data. J. Comput. Biol. 2000;7:819–837. doi: 10.1089/10665270050514954. [DOI] [PubMed] [Google Scholar]
- 44.Jin J., Zhang H., Kong L., Gao G., Luo J. PlantTFDB 3.0: a portal for the functional and evolutionary study of plant transcription factors. Nucleic Acids Res. 2014;42:D1182–D1187. doi: 10.1093/nar/gkt1016. [DOI] [PMC free article] [PubMed] [Google Scholar]
- 45.Rhee S.Y., Beavis W., Berardini T.Z., Chen G., Dixon D., Doyle A., Garcia-Hernandez M., Huala E., Lander G., Montoya M., et al. The Arabidopsis Information Resource (TAIR): a model organism database providing a centralized, curated gateway to Arabidopsis biology, research materials and community. Nucleic Acids Res. 2003;31:224–228. doi: 10.1093/nar/gkg076. [DOI] [PMC free article] [PubMed] [Google Scholar]
- 46.Poultney C.S., Gutierrez R.A., Katari M.S., Gifford M.L., Paley W.B., Coruzzi G.M., Shasha D.E. Sungear: interactive visualization and functional analysis of genomic datasets. Bioinformatics. 2007;23:259–261. doi: 10.1093/bioinformatics/btl496. [DOI] [PubMed] [Google Scholar]
- 47.Shameer K., Ambika S., Varghese S.M., Karaba N., Udayakumar M., Sowdhamini R. STIFDB-Arabidopsis stress responsive transcription factor dataBase. Int. J. Plant Genomics. 2009;2009:583429. doi: 10.1155/2009/583429. [DOI] [PMC free article] [PubMed] [Google Scholar]
- 48.Yilmaz A., Mejia-Guerra M.K., Kurz K., Liang X.Y., Welch L., Grotewold E. AGRIS: the Arabidopsis Gene Regulatory Information Server, an update. Nucleic Acids Res. 2011;39:D1118–D1122. doi: 10.1093/nar/gkq1120. [DOI] [PMC free article] [PubMed] [Google Scholar]
- 49.Shoji T., Mishima M., Hashimoto T. Divergent DNA-binding specificities of a group of ETHYLENE RESPONSE FACTOR transcription factors involved in plant defense. Plant Physiol. 2013;162:977–990. doi: 10.1104/pp.113.217455. [DOI] [PMC free article] [PubMed] [Google Scholar]
- 50.Franco-Zorrilla J.M., Lopez-Vidriero I., Carrasco J.L., Godoy M., Vera P., Solano R. DNA-binding specificities of plant transcription factors and their potential to define target genes. Proc. Natl. Acad. Sci. U.S.A. 2014;111:2367–2372. doi: 10.1073/pnas.1316278111. [DOI] [PMC free article] [PubMed] [Google Scholar]
- 51.Crooks G.E., Hon G., Chandonia J.M., Brenner S.E. WebLogo: a sequence logo generator. Genome Res. 2004;14:1188–1190. doi: 10.1101/gr.849004. [DOI] [PMC free article] [PubMed] [Google Scholar]
- 52.Erdos P., Renyi A. On the evolution of random graphs. B Int. Statist. Inst. 1960;38:343–347. [Google Scholar]
- 53.Csardi G., Nepusz T. The igraph software package for complex network research. http://www.necsi.edu/events/iccs6/papers/c1602a3c126ba822d0bc4293371c.pdf Int. Complex Syst. 2006;1695 [Google Scholar]
- 54.Braun P., Carvunis A.R., Charloteaux B., Dreze M., Ecker J.R., Hill D.E., Roth F.P., Vidal M., Galli M., Balumuri P., et al. Evidence for network evolution in an Arabidopsis interactome map. Science. 2011;333:601–607. doi: 10.1126/science.1203877. [DOI] [PMC free article] [PubMed] [Google Scholar]
- 55.Galuschka C., Schindler M., Bulow L., Hehl R. AthaMap web tools for the analysis and identification of co-regulated genes. Nucleic Acids Res. 2007;35:D857–D862. doi: 10.1093/nar/gkl1006. [DOI] [PMC free article] [PubMed] [Google Scholar]
- 56.Lee I., Ambaru B., Thakkar P., Marcotte E.M., Rhee S.Y. Rational association of genes with traits using a genome-scale gene network for Arabidopsis thaliana. Nat. Biotechnol. 2010;28:U149–U114. doi: 10.1038/nbt.1603. [DOI] [PMC free article] [PubMed] [Google Scholar]
- 57.Vermeirssen V., De Clercq I., Van Parys T., Van Breusegem F., Van de Peer Y. Arabidopsis ensemble reverse-engineered gene regulatory network discloses interconnected transcription factors in oxidative stress. Plant Cell. 2014;26:4656–4679. doi: 10.1105/tpc.114.131417. [DOI] [PMC free article] [PubMed] [Google Scholar]
- 58.Heyndrickx K.S., de Velde J.V., Wang C., Weigel D., Vandepoele K. A functional and evolutionary perspective on transcription factor binding in Arabidopsis thaliana. Plant Cell. 2014;26:3894–3910. doi: 10.1105/tpc.114.130591. [DOI] [PMC free article] [PubMed] [Google Scholar]
- 59.Guberman J.M., Ai J., Arnaiz O., Baran J., Blake A., Baldock R., Chelala C., Croft D., Cros A., Cutts R.J., et al. BioMart Central Portal: an open database network for the biological community. Database (Oxford) 2011;2011:bar041. doi: 10.1093/database/bar041. [DOI] [PMC free article] [PubMed] [Google Scholar]
- 60.Maere S., Heymans K., Kuiper M. BiNGO: a Cytoscape plugin to assess overrepresentation of gene ontology categories in biological networks. Bioinformatics. 2005;21:3448–3449. doi: 10.1093/bioinformatics/bti551. [DOI] [PubMed] [Google Scholar]
- 61.Barah P., Jayavelu N.D., Rasmussen S., Nielsen H.B., Mundy J., Bones A.M. Genome-scale cold stress response regulatory networks in ten Arabidopsis thaliana ecotypes. BMC Genomics. 2013;14:722. doi: 10.1186/1471-2164-14-722. [DOI] [PMC free article] [PubMed] [Google Scholar]
- 62.Alonso-Blanco C., Aarts M.G.M., Bentsink L., Keurentjes J.J.B., Reymond M., Vreugdenhil D., Koornneef M. What has natural variation taught us about plant development, physiology, and adaptation? Plant Cell. 2009;21:1877–1896. doi: 10.1105/tpc.109.068114. [DOI] [PMC free article] [PubMed] [Google Scholar]
- 63.Cao J., Schneeberger K., Ossowski S., Gunther T., Bender S., Fitz J., Koenig D., Lanz C., Stegle O., Lippert C., et al. Whole-genome sequencing of multiple Arabidopsis thaliana populations. Nat. Genet. 2011;43:U956–U960. doi: 10.1038/ng.911. [DOI] [PubMed] [Google Scholar]
- 64.Mitchell-Olds T., Schmitt J. Genetic mechanisms and evolutionary significance of natural variation in Arabidopsis. Nature. 2006;441:947–952. doi: 10.1038/nature04878. [DOI] [PubMed] [Google Scholar]
- 65.Zou C., Lehti-Shiu M.D., Thomashow M., Shiu S.H. Evolution of stress-regulated gene expression in duplicate genes of Arabidopsis thaliana. PLoS Genet. 2009;5:e1000581. doi: 10.1371/journal.pgen.1000581. [DOI] [PMC free article] [PubMed] [Google Scholar]
- 66.Lasky J.R., Des Marais D.L., Lowry D.B., Povolotskaya I., McKay J.K., Richards J.H., Keitt T.H., Juenger T.E. Natural variation in abiotic stress responsive gene expression and local adaptation to climate in Arabidopsis thaliana. Mol. Biol. Evol. 2014;31:2283–2296. doi: 10.1093/molbev/msu170. [DOI] [PMC free article] [PubMed] [Google Scholar]
- 67.Zou C., Sun K., Mackaluso J.D., Seddon A.E., Jin R., Thomashow M.F., Shiu S.H. Cis-regulatory code of stress-responsive transcription in Arabidopsis thaliana. Proc. Natl. Acad. Sci. U.S.A. 2011;108:14992–14997. doi: 10.1073/pnas.1103202108. [DOI] [PMC free article] [PubMed] [Google Scholar]
- 68.Ashburner M., Ball C.A., Blake J.A., Botstein D., Butler H., Cherry J.M., Davis A.P., Dolinski K., Dwight S.S., Eppig J.T., et al. Gene ontology: tool for the unification of biology. The Gene Ontology Consortium. Nat. Genet. 2000;25:25–29. doi: 10.1038/75556. [DOI] [PMC free article] [PubMed] [Google Scholar]
- 69.Riano-Pachon D.M., Ruzicic S., Dreyer I., Mueller-Roeber B. PlnTFDB: an integrative plant transcription factor database. BMC Bioinformatics. 2007;8:42. doi: 10.1186/1471-2105-8-42. [DOI] [PMC free article] [PubMed] [Google Scholar]
- 70.Pruneda-Paz J.L., Breton G., Para A., Kay S.A. A functional genomics approach reveals CHE as a component of the Arabidopsis circadian clock. Science. 2009;323:1481–1485. doi: 10.1126/science.1167206. [DOI] [PMC free article] [PubMed] [Google Scholar]
- 71.Huang W., Perez-Garcia P., Pokhilko A., Millar A.J., Antoshechkin I., Riechmann J.L., Mas P. Mapping the core of the Arabidopsis circadian clock defines the network structure of the oscillator. Science. 2012;336:75–79. doi: 10.1126/science.1219075. [DOI] [PubMed] [Google Scholar]
- 72.Hassidim M., Harir Y., Yakir E., Kron I., Green R.M. Over-expression of CONSTANS-LIKE 5 can induce flowering in short-day grown Arabidopsis. Planta. 2009;230:481–491. doi: 10.1007/s00425-009-0958-7. [DOI] [PubMed] [Google Scholar]
- 73.Rosas U., Mei Y., Xie Q., Banta J.A., Zhou R.W., Seufferheld G., Gerard S., Chou L., Bhambhra N., Parks J.D., et al. Variation in Arabidopsis flowering time associated with cis-regulatory variation in CONSTANS. Nat. Commun. 2014;5:3651. doi: 10.1038/ncomms4651. [DOI] [PMC free article] [PubMed] [Google Scholar]
- 74.Wang L., Fujiwara S., Somers D.E. PRR5 regulates phosphorylation, nuclear import and subnuclear localization of TOC1 in the Arabidopsis circadian clock (vol 29, pg 1903, 2010) EMBO J. 2010;29:3033–3033. doi: 10.1038/emboj.2010.76. [DOI] [PMC free article] [PubMed] [Google Scholar]
- 75.Cai X.N., Ballif J., Endo S., Davis E., Liang M.X., Chen D., DeWald D., Kreps J., Zhu T., Wu Y.J. A putative CCAAT-binding transcription factor is a regulator of flowering timing in Arabidopsis. Plant Physiology. 2007;145:98–105. doi: 10.1104/pp.107.102079. [DOI] [PMC free article] [PubMed] [Google Scholar]
- 76.Nakamichi N., Kiba T., Henriques R., Mizuno T., Chua N.H., Sakakibara H. PSEUDO-RESPONSE REGULATORS 9, 7, and 5 are transcriptional repressors in the Arabidopsis circadian clock. Plant Cell. 2010;22:594–605. doi: 10.1105/tpc.109.072892. [DOI] [PMC free article] [PubMed] [Google Scholar]
- 77.Dubos C., Le Gourrierec J., Baudry A., Huep G., Lanet E., Debeaujon I., Routaboul J.M., Alboresi A., Weisshaar B., Lepiniec L. MYBL2 is a new regulator of flavonoid biosynthesis in Arabidopsis thaliana. Plant J. 2008;55:940–953. doi: 10.1111/j.1365-313X.2008.03564.x. [DOI] [PubMed] [Google Scholar]
- 78.Muto H., Watahiki M.K., Nakamoto D., Kinjo M., Yamamoto K.T. Specificity and similarity of functions of the Aux/IAA genes in auxin signaling of arabidopsis revealed by promoter-exchange experiments among MSG2 IAA19, AXR2/IAA7, and SLR/IAA141. Plant Physiol. 2007;144:187–196. doi: 10.1104/pp.107.096628. [DOI] [PMC free article] [PubMed] [Google Scholar]
- 79.Yamasaki K., Kigawa T., Inoue M., Tateno M., Yamasaki T., Yabuki T., Aoki M., Seki E., Matsuda T., Tomo Y., et al. Solution structure of the B3 DNA binding domain of the Arabidopsis cold-responsive transcription factor RAV1. Plant Cell. 2004;16:3448–3459. doi: 10.1105/tpc.104.026112. [DOI] [PMC free article] [PubMed] [Google Scholar]
- 80.Salome P.A., McClung C.R. PSEUDO-RESPONSE REGULATOR 7 and 9 are partially redundant genes essential for the temperature responsiveness of the Arabidopsis circadian clock. Plant Cell. 2005;17:791–803. doi: 10.1105/tpc.104.029504. [DOI] [PMC free article] [PubMed] [Google Scholar]
- 81.Imaizumi T., Schultz T.F., Harmon F.G., Ho L.A., Kay S.A. FKF1 F-box protein mediates cyclic degradation of a repressor of CONSTANS in Arabidopsis. Science. 2005;309:293–297. doi: 10.1126/science.1110586. [DOI] [PubMed] [Google Scholar]
- 82.Liu P.P., Koizuka N., Martin R.C., Nonogaki H. The BME3 (Blue Micropylar End 3) GATA zinc finger transcription factor is a positive regulator of Arabidopsis seed germination. Plant J. 2005;44:960–971. doi: 10.1111/j.1365-313X.2005.02588.x. [DOI] [PubMed] [Google Scholar]
- 83.Fujimori T., Yamashino T., Kato T., Mizuno T. Circadian-controlled basic/helix-loop-helix factor, PIL6, implicated in light-signal transduction in Arabidopsis thaliana. Plant Cell Physiol. 2004;45:1078–1086. doi: 10.1093/pcp/pch124. [DOI] [PubMed] [Google Scholar]
- 84.Zhou X., Jiang Y.J., Yu D.Q. WRKY22 transcription factor mediates dark-induced leaf senescence in Arabidopsis. Mol. Cells. 2011;31:303–313. doi: 10.1007/s10059-011-0047-1. [DOI] [PMC free article] [PubMed] [Google Scholar]
- 85.Seo E., Lee H., Jeon J., Park H., Kim J., Noh Y.S., Lee I. Crosstalk between Cold Response and Flowering in Arabidopsis Is Mediated through the Flowering-Time Gene SOC1 and Its Upstream Negative Regulator FLC. Plant Cell. 2009;21:3185–3197. doi: 10.1105/tpc.108.063883. [DOI] [PMC free article] [PubMed] [Google Scholar]
- 86.Nakamichi N., Kita M., Ito S., Sato E., Yamashino T., Mizuno T. The Arabidopsis pseudo-response regulators, PRR5 and PRR7, coordinately play essential roles for circadian clock function. Plant Cell Physiol. 2005;46:609–619. doi: 10.1093/pcp/pci061. [DOI] [PubMed] [Google Scholar]
- 87.Wang J.G., Qiu X.J., Li Y.H., Deng Y.P., Shi T.L. A transcriptional dynamic network during Arabidopsis thaliana pollen development. BMC Syst. Biol. 2011;5(Suppl. 3):58. doi: 10.1186/1752-0509-5-S3-S8. [DOI] [PMC free article] [PubMed] [Google Scholar]
- 88.Sharan R., Ulitsky I., Shamir R. Network-based prediction of protein function. Mol. Syst. Biol. 2007;3:88. doi: 10.1038/msb4100129. [DOI] [PMC free article] [PubMed] [Google Scholar]
- 89.Howe D., Costanzo M., Fey P., Gojobori T., Hannick L., Hide W., Hill D.P., Kania R., Schaeffer M., St Pierre S., et al. Big data: the future of biocuration. Nature. 2008;455:47–50. doi: 10.1038/455047a. [DOI] [PMC free article] [PubMed] [Google Scholar]
- 90.Albert R. Scale-free networks in cell biology. J. Cell Sci. 2005;118:4947–4957. doi: 10.1242/jcs.02714. [DOI] [PubMed] [Google Scholar]
- 91.Barabasi A.L., Albert R. Emergence of scaling in random networks. Science. 1999;286:509–512. doi: 10.1126/science.286.5439.509. [DOI] [PubMed] [Google Scholar]
- 92.Boorsma A., Lu X.J., Zakrzewska A., Klis F.M., Bussemaker H.J. Inferring condition-specific modulation of transcription factor activity in yeast through regulon-based analysis of genomewide expression. PLoS One. 2008;3:e3112. doi: 10.1371/journal.pone.0003112. [DOI] [PMC free article] [PubMed] [Google Scholar]
- 93.Sugio A., Dreos R., Aparicio F., Maule A.J. The cytosolic protein response as a subcomponent of the wider heat shock response in Arabidopsis. Plant Cell. 2009;21:642–654. doi: 10.1105/tpc.108.062596. [DOI] [PMC free article] [PubMed] [Google Scholar]
- 94.Nishizawa-Yokoi A., Nosaka R., Hayashi H., Tainaka H., Maruta T., Tamoi M., Ikeda M., Ohme-Takagi M., Yoshimura K., Yabuta Y., et al. HsfA1d and HsfA1e involved in the transcriptional regulation of HsfA2 function as key regulators for the Hsf signaling network in response to environmental stress. Plant Cell Physiol. 2011;52:933–945. doi: 10.1093/pcp/pcr045. [DOI] [PubMed] [Google Scholar]
- 95.Suzuki N., Sejima H., Tam R., Schlauch K., Mittler R. Identification of the MBF1 heat-response regulon of Arabidopsis thaliana. Plant J. 2011;66:844–851. doi: 10.1111/j.1365-313X.2011.04550.x. [DOI] [PMC free article] [PubMed] [Google Scholar]
- 96.Seaton D.D., Smith R.W., Song Y.H., MacGregor D.R., Stewart K., Steel G., Foreman J., Penfield S., Imaizumi T., Millar A.J., et al. Linked circadian outputs control elongation growth and flowering in response to photoperiod and temperature. Mol. Syst. Biol. 2015;11:776. doi: 10.15252/msb.20145766. [DOI] [PMC free article] [PubMed] [Google Scholar]
- 97.Lim C.J., Yang K.A., Hong J.K., Choi A.S., Yun D.J., Hong J.C., Chung W.S., Lee S.Y., Cho M.J., Lim C.O. Gene expression profiles during heat acclimation in Arabidopsis thaliana suspension-culture cells. J. Plant Res. 2006;119:373–383. doi: 10.1007/s10265-006-0285-z. [DOI] [PubMed] [Google Scholar]
- 98.Zhu D., Li R.T., Liu X., Sun M.Z., Wu J., Zhang N., Zhu Y.M. The positive regulatory roles of the TIFY10 proteins in plant responses to alkaline stress. Plos One. 2014;9:e111984. doi: 10.1371/journal.pone.0111984. [DOI] [PMC free article] [PubMed] [Google Scholar]
- 99.Pauwels L., Barbero G.F., Geerinck J., Tilleman S., Grunewald W., Perez A.C., Chico J.M., Vanden Bossche R., Sewell J., Gil E., et al. NINJA connects the co-repressor TOPLESS to jasmonate signalling. Nature. 2010;464:788–791. doi: 10.1038/nature08854. [DOI] [PMC free article] [PubMed] [Google Scholar]
- 100.Mizuno T., Kitayama M., Oka H., Tsubouchi M., Takayama C., Nomoto Y., Yamashino T. The EC Night-time repressor plays a crucial role in modulating circadian clock transcriptional circuitry by conservatively double-checking both warm-night and night-time-light signals in a synergistic manner in Arabidopsis thaliana. Plant Cell Physiol. 2014;55:2139–2151. doi: 10.1093/pcp/pcu144. [DOI] [PubMed] [Google Scholar]
- 101.Ma S.S., Gong Q.Q., Bohnert H.J. Dissecting salt stress pathways. J. Exp. Bot. 2006;57:1097–1107. doi: 10.1093/jxb/erj098. [DOI] [PubMed] [Google Scholar]
- 102.Jaglo-Ottosen K.R., Gilmour S.J., Zarka D.G., Schabenberger O., Thomashow M.F. Arabidopsis CBF1 overexpression induces COR genes and enhances freezing tolerance. Science. 1998;280:104–106. doi: 10.1126/science.280.5360.104. [DOI] [PubMed] [Google Scholar]
- 103.Fowler S., Thomashow M.F. Arabidopsis transcriptome profiling indicates that multiple regulatory pathways are activated during cold acclimation in addition to the CBF cold response pathway. Plant Cell. 2002;14:1675–1690. doi: 10.1105/tpc.003483. [DOI] [PMC free article] [PubMed] [Google Scholar]
- 104.Mikkelsen M.D., Thomashow M.F. A role for circadian evening elements in cold-regulated gene expression in Arabidopsis. Plant J. 2009;60:328–339. doi: 10.1111/j.1365-313X.2009.03957.x. [DOI] [PubMed] [Google Scholar]
- 105.Zhang B.L., Wang L., Zeng L.P., Zhang C., Ma H. Arabidopsis TOE proteins convey a photoperiodic signal to antagonize CONSTANS and regulate flowering time. Gene Dev. 2015;29:975–987. doi: 10.1101/gad.251520.114. [DOI] [PMC free article] [PubMed] [Google Scholar]
- 106.Vogel M.O., Moore M., Konig K., Pecher P., Alsharafa K., Lee J., Dietz K.J. Fast retrograde signaling in response to high light involves metabolite export, MITOGEN-ACTIVATED PROTEIN KINASE6, and AP2/ERF transcription factors in Arabidopsis. Plant Cell. 2014;26:1151–1165. doi: 10.1105/tpc.113.121061. [DOI] [PMC free article] [PubMed] [Google Scholar]
- 107.Robert H.S., Quint A., Brand D., Vivian-Smith A., Offringa R. BTB and TAZ domain scaffold proteins perform a crucial function in Arabidopsis development. Plant J. 2009;58:109–121. doi: 10.1111/j.1365-313X.2008.03764.x. [DOI] [PubMed] [Google Scholar]
- 108.Galvez-Valdivieso G., Fryer M.J., Lawson T., Slattery K., Truman W., Smirnoff N., Asami T., Davies W.J., Jones A.M., Baker N.R., et al. The high light response in arabidopsis involves ABA signaling between vascular and bundle sheath cells. Plant Cell. 2009;21:2143–2162. doi: 10.1105/tpc.108.061507. [DOI] [PMC free article] [PubMed] [Google Scholar]
- 109.Gohre V., Jones A.M.E., Sklenar J., Robatzek S., Weber A.P.M. Molecular crosstalk between PAMP-triggered immunity and photosynthesis. Mol. Plant Microbe. Interact. 2012;25:1083–1092. doi: 10.1094/MPMI-11-11-0301. [DOI] [PubMed] [Google Scholar]
- 110.Stracke R., Werber M., Weisshaar B. The R2R3-MYB gene family in Arabidopsis thaliana. Curr. Opin. Plant Biol. 2001;4:447–456. doi: 10.1016/s1369-5266(00)00199-0. [DOI] [PubMed] [Google Scholar]
- 111.Melotto M., Underwood W., He S.Y. Role of stomata in plant innate immunity and foliar bacterial diseases. Annu. Rev. Phytopathol. 2008;46:101–122. doi: 10.1146/annurev.phyto.121107.104959. [DOI] [PMC free article] [PubMed] [Google Scholar]
- 112.Atkinson N.J., Urwin P.E. The interaction of plant biotic and abiotic stresses: from genes to the field. J. Exp. Bot. 2012;63:3523–3543. doi: 10.1093/jxb/ers100. [DOI] [PubMed] [Google Scholar]
- 113.Richter R., Bastakis E., Schwechheimer C. Cross-repressive interactions between SOC1 and the GATAs GNC and GNL/CGA1 in the control of greening, cold tolerance, and flowering time in Arabidopsis. Plant Physiol. 2013;162:1992–2004. doi: 10.1104/pp.113.219238. [DOI] [PMC free article] [PubMed] [Google Scholar]
- 114.Stief A., Altmann S., Hoffmann K., Pant B.D., Scheible W.R., Baurle I. Arabidopsis miR156 regulates tolerance to recurring environmental stress through SPL transcription factors. Plant Cell. 2014;26:1792–1807. doi: 10.1105/tpc.114.123851. [DOI] [PMC free article] [PubMed] [Google Scholar]
- 115.Kumimoto R.W., Zhang Y., Siefers N., Holt B.F. NF-YC3, NF-YC4 and NF-YC9 are required for CONSTANS-mediated, photoperiod-dependent flowering in Arabidopsis thaliana. Plant J. 2010;63:379–391. doi: 10.1111/j.1365-313X.2010.04247.x. [DOI] [PubMed] [Google Scholar]
- 116.Kuwabara C., Imai R. Molecular basis of disease resistance acquired through cold acclimation in overwintering plants. J. Plant Biol. 2009;52:19–26. [Google Scholar]
- 117.Li Z.F., Zhang L.X., Yu Y.W., Quan R.D., Zhang Z.J., Zhang H.W., Huang R.F. The ethylene response factor AtERF11 that is transcriptionally modulated by the bZIP transcription factor HY5 is a crucial repressor for ethylene biosynthesis in Arabidopsis. Plant J. 2011;68:88–99. doi: 10.1111/j.1365-313X.2011.04670.x. [DOI] [PubMed] [Google Scholar]
- 118.Lee H.G., Seo P.J. The MYB96-HHP module integrates cold and abscisic acid signaling to activate the CBF-COR pathway in Arabidopsis. Plant J. 2015;82:962–977. doi: 10.1111/tpj.12866. [DOI] [PubMed] [Google Scholar]
- 119.Catala R., Medina J., Salinas J. Integration of low temperature and light signaling during cold acclimation response in Arabidopsis. Proc. Natl. Acad. Sci. U.S.A. 2011;108:16475–16480. doi: 10.1073/pnas.1107161108. [DOI] [PMC free article] [PubMed] [Google Scholar]
- 120.Soitamo A.J., Piippo M., Allahverdiyeva Y., Battchikova N., Aro E.M. Light has a specific role in modulating Arabidopsis gene expression at low temperature. BMC Plant Biol. 2008;8:13. doi: 10.1186/1471-2229-8-13. [DOI] [PMC free article] [PubMed] [Google Scholar]
- 121.Cheng M.C., Liao P.M., Kuo W.W., Lin T.P. The Arabidopsis ETHYLENE RESPONSE FACTOR1 regulates abiotic stress-responsive gene expression by binding to different cis-acting elements in response to different stress signals. Plant Physiol. 2013;162:1566–1582. doi: 10.1104/pp.113.221911. [DOI] [PMC free article] [PubMed] [Google Scholar]
- 122.Li W.X., Oono Y., Zhu J.H., He X.J., Wu J.M., Iida K., Lu X.Y., Cui X.P., Jin H.L., Zhu J.K. The Arabidopsis NFYA5 transcription factor is regulated transcriptionally and posttranscriptionally to promote drought resistance. Plant Cell. 2008;20:2238–2251. doi: 10.1105/tpc.108.059444. [DOI] [PMC free article] [PubMed] [Google Scholar]
- 123.Kagale S., Links M.G., Rozwadowski K. Genome-wide analysis of ethylene-responsive element binding factor-associated amphiphilic repression motif-containing transcriptional regulators in Arabidopsis. Plant Physiol. 2010;152:1109–1134. doi: 10.1104/pp.109.151704. [DOI] [PMC free article] [PubMed] [Google Scholar]
- 124.Yang Z.T., Wang M.J., Sun L., Lu S.J., Bi D.L., Sun L., Song Z.T., Zhang S.S., Zhou S.F., Liu J.X. The membrane-associated transcription factor NAC089 controls ER-stress-induced programmed cell death in plants. PLoS Genet. 2014;10:e1004243. doi: 10.1371/journal.pgen.1004243. [DOI] [PMC free article] [PubMed] [Google Scholar]
- 125.Stroud H., Greenberg M.V.C., Feng S.H., Bernatavichute Y.V., Jacobsen S.E. Comprehensive analysis of silencing mutants reveals complex regulation of the Arabidopsis methylome. Cell. 2013;152:352–364. doi: 10.1016/j.cell.2012.10.054. [DOI] [PMC free article] [PubMed] [Google Scholar]
- 126.Colmenero-Flores J.M., Rosales M.A. Interaction between salt and heat stress: when two wrongs make a right. Plant Cell Environ. 2014;37:1042–1045. doi: 10.1111/pce.12229. [DOI] [PubMed] [Google Scholar]
- 127.Rizhsky L., Liang H.J., Shuman J., Shulaev V., Davletova S., Mittler R. When defense pathways collide. The response of Arabidopsis to a combination of drought and heat stress. Plant Physiol. 2004;134:1683–1696. doi: 10.1104/pp.103.033431. [DOI] [PMC free article] [PubMed] [Google Scholar]
- 128.Rusconi F., Simeoni F., Francia P., Cominelli E., Conti L., Riboni M., Simoni L., Martin C.R., Tonelli C., Galbiati M. The Arabidopsis thaliana MYB60 promoter provides a tool for the spatio-temporal control of gene expression in stomatal guard cells. J. Exp. Bot. 2013;64:3361–3371. doi: 10.1093/jxb/ert180. [DOI] [PMC free article] [PubMed] [Google Scholar]
- 129.Ni W.M., Xu S.L., Chalkley R.J., Pham T.N.D., Guan S.H., Maltby D.A., Burlingame A.L., Wang Z.Y., Quail P.H. Multisite light-induced phosphorylation of the transcription factor PIF3 is necessary for both its rapid degradation and concomitant negative feedback modulation of photoreceptor phyB levels in Arabidopsis. Plant Cell. 2013;25:2679–2698. doi: 10.1105/tpc.113.112342. [DOI] [PMC free article] [PubMed] [Google Scholar]
- 130.Miller G., Suzuki N., Ciftci-Yilmaz S., Mittler R. Reactive oxygen species homeostasis and signalling during drought and salinity stresses. Plant Cell Environ. 2010;33:453–467. doi: 10.1111/j.1365-3040.2009.02041.x. [DOI] [PubMed] [Google Scholar]
- 131.Moore M., Vogel M., Dietz K. The acclimation response to high light is initiated within seconds as indicated by upregulation of AP2/ERF transcription factor network in Arabidopsis thaliana. Plant Signal. Behav. 2014;9:976479. doi: 10.4161/15592324.2014.976479. [DOI] [PMC free article] [PubMed] [Google Scholar]
- 132.Cao W.H., Liu J., He X.J., Mu R.L., Zhou H.L., Chen S.Y., Zhang J.S. Modulation of ethylene responses affects plant salt-stress responses. Plant Physiol. 2007;143:707–719. doi: 10.1104/pp.106.094292. [DOI] [PMC free article] [PubMed] [Google Scholar]
- 133.Ma X., Qiao Z., Chen D., Yang W., Zhou R., Zhang W., Wang M. CYCLIN-DEPENDENT KINASE G2 regulates salinity stress response and salt mediated flowering in Arabidopsis thaliana. Plant Mol. Biol. 2015;88:287–299. doi: 10.1007/s11103-015-0324-z. [DOI] [PubMed] [Google Scholar]
- 134.Vandepoele K., Quimbaya M., Casneuf T., De Veylder L., Van de Peer Y. Unraveling transcriptional control in Arabidopsis using cis-regulatory elements and coexpression networks. Plant Physiol. 2009;150:535–546. doi: 10.1104/pp.109.136028. [DOI] [PMC free article] [PubMed] [Google Scholar]
- 135.Sullivan A.M., Arsovski A.A., Lempe J., Bubb K.L., Weirauch M.T., Sabo P.J., Sandstrom R., Thurman R.E., Neph S., Reynolds A.P., et al. Mapping and dynamics of regulatory DNA and transcription factor networks in A. thaliana. Cell Rep. 2014;8:2015–2030. doi: 10.1016/j.celrep.2014.08.019. [DOI] [PubMed] [Google Scholar]
- 136.Singh K.B. Transcriptional regulation in plants: the importance of combinatorial control. Plant Physiol. 1998;118:1111–1120. doi: 10.1104/pp.118.4.1111. [DOI] [PMC free article] [PubMed] [Google Scholar]
- 137.He X., Duque T.S., Sinha S. Evolutionary origins of transcription factor binding site clusters. Mol. Biol. Evol. 2012;29:1059–1070. doi: 10.1093/molbev/msr277. [DOI] [PMC free article] [PubMed] [Google Scholar]
- 138.Balderas-Hernandez V.E., Alvarado-Rodriguez M., Fraire-Velazquez S. Conserved versatile master regulators in signalling pathways in response to stress in plants. AoB Plants. 2013;5:plt033. doi: 10.1093/aobpla/plt033. [DOI] [PMC free article] [PubMed] [Google Scholar]
- 139.Hodgins-Davis A., Townsend J.P. Evolving gene expression: from G to E to GxE. Trends Ecol. Evol. 2009;24:649–658. doi: 10.1016/j.tree.2009.06.011. [DOI] [PMC free article] [PubMed] [Google Scholar]
- 140.Bell-Pedersen D., Cassone V.M., Earnest D.J., Golden S.S., Hardin P.E., Thomas T.L., Zoran M.J. Circadian rhythms from multiple oscillators: lessons from diverse organisms. Nat. Rev. Genet. 2005;6:544–556. doi: 10.1038/nrg1633. [DOI] [PMC free article] [PubMed] [Google Scholar]
- 141.Sanchez A., Shin J., Davis S.J. Abiotic stress and the plant circadian clock. Plant Signal. Behav. 2011;6:223–231. doi: 10.4161/psb.6.2.14893. [DOI] [PMC free article] [PubMed] [Google Scholar]
- 142.Liu T., Carlsson J., Takeuchi T., Newton L., Farre E.M. Direct regulation of abiotic responses by the Arabidopsis circadian clock component PRR7. Plant J. 2013;76:101–114. doi: 10.1111/tpj.12276. [DOI] [PubMed] [Google Scholar]
- 143.Lai A.G., Doherty C.J., Mueller-Roeber B., Kay S.A., Schippers J.H., Dijkwel P.P. CIRCADIAN CLOCK-ASSOCIATED 1 regulates ROS homeostasis and oxidative stress responses. Proc. Natl. Acad. Sci. U.S.A. 2012;109:17129–17134. doi: 10.1073/pnas.1209148109. [DOI] [PMC free article] [PubMed] [Google Scholar]
- 144.Atkinson N.J., Lilley C.J., Urwin P.E. Identification of genes involved in the response of Arabidopsis to simultaneous biotic and abiotic stresses. Plant Physiol. 2013;162:2028–2041. doi: 10.1104/pp.113.222372. [DOI] [PMC free article] [PubMed] [Google Scholar]
- 145.Kissoudis C., van de Wiel C., Visser R.G.F., van der Linden G. Enhancing crop resilience to combined abiotic and biotic stress through the dissection of physiological and molecular crosstalk. Front. Plant Sci. 2014;5:207. doi: 10.3389/fpls.2014.00207. [DOI] [PMC free article] [PubMed] [Google Scholar]
- 146.Luscombe N.M., Babu M.M., Yu H.Y., Snyder M., Teichmann S.A., Gerstein M. Genomic analysis of regulatory network dynamics reveals large topological changes. Nature. 2004;431:308–312. doi: 10.1038/nature02782. [DOI] [PubMed] [Google Scholar]
- 147.Cox R.S. 3rd, Surette M.G., Elowitz M.B. Programming gene expression with combinatorial promoters. Mol. Syst. Biol. 2007;3:145. doi: 10.1038/msb4100187. [DOI] [PMC free article] [PubMed] [Google Scholar]
- 148.Nakashima K., Ito Y., Yamaguchi-Shinozaki K. Transcriptional regulatory networks in response to abiotic stresses in Arabidopsis and grasses. Plant Physiol. 2009;149:88–95. doi: 10.1104/pp.108.129791. [DOI] [PMC free article] [PubMed] [Google Scholar]
- 149.Naika M., Shameer K., Sowdhamini R. Comparative analyses of stress-responsive genes in Arabidopsis thaliana: insight from genomic data mining, functional enrichment, pathway analysis and phenomics. Mol. Biosyst. 2013;9:1888–1908. doi: 10.1039/c3mb70072k. [DOI] [PubMed] [Google Scholar]
- 150.Barah P., Jayavelu N.D., Mundy J., Bones A.M. Genome scale transcriptional response diversity among ten ecotypes of Arabidopsis thaliana during heat stress. Front. Plant Sci. 2013;4:532. doi: 10.3389/fpls.2013.00532. [DOI] [PMC free article] [PubMed] [Google Scholar]
- 151.Bolton M.D. Primary metabolism and plant defense-fuel for the fire. Mol. Plant Microbe. Interact. 2009;22:487–497. doi: 10.1094/MPMI-22-5-0487. [DOI] [PubMed] [Google Scholar]
- 152.Rojas C.M., Senthil-Kumar M., Tzin V., Mysore K.S. Regulation of primary plant metabolism during plant-pathogen interactions and its contribution to plant defense. Front. Plant Sci. 2014;5:17. doi: 10.3389/fpls.2014.00017. [DOI] [PMC free article] [PubMed] [Google Scholar]
- 153.Suzuki N., Bajad S., Shuman J., Shulaev V., Mittler R. The transcriptional co-activator MBF1c is a key regulator of thermotolerance in Arabidopsis thaliana. J. Biol. Chem. 2008;283:9269–9275. doi: 10.1074/jbc.M709187200. [DOI] [PubMed] [Google Scholar]
- 154.van Verk M.C., Bol J.F., Linthorst H.J. WRKY transcription factors involved in activation of SA biosynthesis genes. BMC Plant Biol. 2011;11:89. doi: 10.1186/1471-2229-11-89. [DOI] [PMC free article] [PubMed] [Google Scholar]
- 155.Fernandez-Calvo P., Chini A., Fernandez-Barbero G., Chico J.M., Gimenez-Ibanez S., Geerinck J., Eeckhout D., Schweizer F., Godoy M., Franco-Zorrilla J.M., et al. The Arabidopsis bHLH transcription factors MYC3 and MYC4 are targets of JAZ repressors and act additively with MYC2 in the activation of jasmonate responses. Plant Cell. 2011;23:701–715. doi: 10.1105/tpc.110.080788. [DOI] [PMC free article] [PubMed] [Google Scholar]
- 156.Dombrecht B., Xue G.P., Sprague S.J., Kirkegaard J.A., Ross J.J., Reid J.B., Fitt G.P., Sewelam N., Schenk P.M., Manners J.M., et al. MYC2 differentially modulates diverse jasmonate-dependent functions in Arabidopsis. Plant Cell. 2007;19:2225–2245. doi: 10.1105/tpc.106.048017. [DOI] [PMC free article] [PubMed] [Google Scholar]
- 157.Hong G.J., Xue X.Y., Mao Y.B., Wang L.J., Chen X.Y. Arabidopsis MYC2 interacts with DELLA proteins in regulating sesquiterpene synthase gene expression. Plant Cell. 2012;24:2635–2648. doi: 10.1105/tpc.112.098749. [DOI] [PMC free article] [PubMed] [Google Scholar]
- 158.Gomez M.D., Urbez C., Perez-Amador M.A., Carbonell J. Characterization of constricted fruit (ctf) mutant uncovers a role for AtMYB117/LOF1 in ovule and fruit development in Arabidopsis thaliana. PLoS One. 2011;6:e18760. doi: 10.1371/journal.pone.0018760. [DOI] [PMC free article] [PubMed] [Google Scholar]
- 159.Duclercq J., Ndong Y.P.A., Guerineau F., Sangwan R.S., Catterou M. Arabidopsis shoot organogenesis is enhanced by an amino acid change in the ATHB15 transcription factor. Plant Biol. 2011;13:317–324. doi: 10.1111/j.1438-8677.2010.00363.x. [DOI] [PubMed] [Google Scholar]
- 160.Moffat C.S., Ingle R.A., Wathugala D.L., Saunders N.J., Knight H., Knight M.R. ERF5 and ERF6 play redundant roles as positive regulators of JA/Et-mediated defense against Botrytis cinerea in Arabidopsis. PLoS One. 2012;7:e35995. doi: 10.1371/journal.pone.0035995. [DOI] [PMC free article] [PubMed] [Google Scholar]
- 161.Naito T., Kiba T., Koizumi N., Yamashino T., Mizuno T. Characterization of a unique GATA family gene that responds to both light and cytokinin in Arabidopsis thaliana. Biosci. Biotech. Bioch. 2007;71:1557–1560. doi: 10.1271/bbb.60692. [DOI] [PubMed] [Google Scholar]
- 162.Libault M., Wan J.R., Czechowski T., Udvardi M., Stacey G. Identification of 118 Arabidopsis transcription factor and 30 ubiquitin-ligase genes responding to chitin, a plant-defense elicitor. Mol. Plant Microbe. Interact. 2007;20:900–911. doi: 10.1094/MPMI-20-8-0900. [DOI] [PubMed] [Google Scholar]
- 163.Causier B., Ashworth M., Guo W.J., Davies B. The TOPLESS interactome: a framework for gene repression in Arabidopsis. Plant Physiology. 2012;158:423–438. doi: 10.1104/pp.111.186999. [DOI] [PMC free article] [PubMed] [Google Scholar]
- 164.Claeys H., Skirycz A., Maleux K., Inze D. DELLA signaling mediates stress-induced cell differentiation in Arabidopsis leaves through modulation of anaphase-promoting complex/cyclosome activity. Plant Physiol. 2012;159:739–747. doi: 10.1104/pp.112.195032. [DOI] [PMC free article] [PubMed] [Google Scholar]
- 165.Klopffleisch K., Phan N., Augustin K., Bayne R.S., Booker K.S., Botella J.R., Carpita N.C., Carr T., Chen J.G., Cooke T.R., et al. Arabidopsis G-protein interactome reveals connections to cell wall carbohydrates and morphogenesis. Mol. Syst. Biol. 2011;7:532. doi: 10.1038/msb.2011.66. [DOI] [PMC free article] [PubMed] [Google Scholar]
- 166.Shin R., Burch A.Y., Huppert K.A., Tiwari S.B., Murphy A.S., Guilfoyle T.J., Schachtman D.P. The Arabidopsis transcription factor MYB77 modulates auxin signal transduction. Plant Cell. 2007;19:2440–2453. doi: 10.1105/tpc.107.050963. [DOI] [PMC free article] [PubMed] [Google Scholar]
- 167.Barrero J.M., Rodriguez P.L., Quesada V., Alabadi D., Blazquez M.A., Boutin J.P., Marion-Poll A., Ponce M.R., Micol J.L. The ABA1 gene and carotenoid biosynthesis are required for late skotomorphogenic growth in Arabidopsis thaliana. Plant Cell Environ. 2008;31:227–234. doi: 10.1111/j.1365-3040.2007.01759.x. [DOI] [PubMed] [Google Scholar]
- 168.Li M., Doll J., Weckermann K., Oecking C., Berendzen K.W., Schoffl F. Detection of in vivo interactions between Arabidopsis class A-HSFs, using a novel BiFC fragment, and identification of novel class B-HSF interacting proteins. Eur. J. Cell Biol. 2010;89:126–132. doi: 10.1016/j.ejcb.2009.10.012. [DOI] [PubMed] [Google Scholar]
- 169.Shannon P., Markiel A., Ozier O., Baliga N.S., Wang J.T., Ramage D., Amin N., Schwikowski B., Ideker T. Cytoscape: a software environment for integrated models of biomolecular interaction networks. Genome Res. 2003;13:2498–2504. doi: 10.1101/gr.1239303. [DOI] [PMC free article] [PubMed] [Google Scholar]
Associated Data
This section collects any data citations, data availability statements, or supplementary materials included in this article.