Abstract
Genome-wide proximity ligation assays allow the identification of chromatin contacts at unprecedented resolution. Several studies reveal that mammalian chromosomes are composed of topological domains (TDs) in sub-mega base resolution, which appear to be conserved across cell types and to some extent even between organisms. Identifying topological domains is now an important step toward understanding the structure and functions of spatial genome organization. However, current methods for TD identification demand extensive computational resources, require careful tuning and/or encounter inconsistencies in results. In this work, we propose an efficient and deterministic method, TopDom, to identify TDs, along with a set of statistical methods for evaluating their quality. TopDom is much more efficient than existing methods and depends on just one intuitive parameter, a window size, for which we provide easy-to-implement optimization guidelines. TopDom also identifies more and higher quality TDs than the popular directional index algorithm. The TDs identified by TopDom provide strong support for the cross-tissue TD conservation. Finally, our analysis reveals that the locations of housekeeping genes are closely associated with cross-tissue conserved TDs. The software package and source codes of TopDom are available at http://zhoulab.usc.edu/TopDom/.
INTRODUCTION
Chromatin is the physical carrier of genetic and epigenetic information. Recent studies indicate that its high-order spatial conformation plays an important role in many nuclear processes, including gene expression, epigenetic organization and DNA replication (1–7). Although our understanding of the spatial organization of chromatin is still very limited, genome-wide proximity ligation assays (6,8–10) promise to grant new insights into 3D genome structures and their relation to nuclear functions. For example, Hi-C data have led to the interesting observation that the human, mouse and drosophila genomes are linearly partitioned into physical domains with strong internal connectivity but limited interaction with other domains (1,4). These domains occur below the mega base scale, and are termed topological domains (TDs). The chromatin within a TD often displays uniform functional properties such as histone modifications, active gene density, lamina interaction propensity, replication timing, or nucleotide and repetitive element compositions (1,4,6,11–13). Evidence suggests that topological domains are widely conserved across species, not just across cell types in the same species (1).
Several methods have been developed to identify topological domains (1,4,6,11–14). Sexton et al. (2012) defined the first relevant concept, ‘physical domains,’ and devised a probabilistic approach to first infer a distance-scaling factor for each restriction fragment, then identify peaks in these distance-scaling factors as the boundaries of physical domains (4). Dixon et al. (2012) coined the term ‘topological domain,’ and proposed an identification method based on a directionality index (DI). The DI quantifies the degree of upstream or downstream interaction bias for a genomic region, so its value changes drastically at the periphery of a topological domain. Dixon et al. used a Hidden Markov Model (HMM) to identify topological domains from DIs (1). Hou et al. (2012) developed a Bayesian probability model assuming that the number of paired-end tags linking two loci follows a Poisson distribution, and adopted a Markov chain Monte Carlo (MCMC) strategy to estimate the locations of the TD boundaries (12). Filippova et al. (2014) proposed a dynamic programming method called ‘Armatus’ which is able to capture persistent domains across various resolutions. Levi-Leduc et al. (2014) defined a block-wise segmentation model for the detection of TDs, and proved that the maximum likelihood estimate of the block boundaries can be rephrased as a 1D segmentation problem, which can be resolved using standard dynamic programming methods (14). More recently, Rao et al. (2014) used dynamic programming to transform the original contact frequency heatmap into an arrowhead matrix and annotate the domains based on the transformed matrix (6). For all the TDs identified by different methods, insulating factors such as CTCF and other histone modifications were found to be highly enriched at the domain boundaries (1,4,11–12).
All the above methods identify topological domains from different points of view, and all are effective at gaining biological insights in downstream analyses. However, the source codes of only several methods are publically available (1,11,14). Moreover, most of the above methods are challenging for biologists to use, because they require extensive pre-processing (4) and/or substantial parameter tuning (1,4,11–12,14). Among the methods with open source codes, Dixon et al. (1) used the Gaussian Mixture Model and the HMM to predict the state of upstream or downstream bias for each bin, and found that the results depend on parameters chosen by the researcher: the input number of components in the mixture model and the cutoff for the median posterior probability. The Armatus method has a great advantage in that it builds consensus domains combining multiscale domain sets, and requires only a single major parameter (the resolution to generate domains) and two additional minor parameters (the highest resolution used to generate domains, and the step size to increment the resolution parameter) in its combining step (11). The parameters required by the block-wise segmentation approach (14) include the distribution of input data, which is challenging for biological users to determine.
Aside from usability, another important issue is the inconsistency among the domains generated by different methods, or even among domains generated by the same method but with different input parameters. This is especially important given that previous literature has shown that domain boundaries are more likely to be active regions (12). Such regions are less compact and more likely to form inter-chromosomal contacts with other active regions (1,12). But if the signal indicating a TD boundary is weak, the determination of topological domains is sensitive to inconsistencies caused by (i) the heuristic nature of the algorithms, (ii) noise in the data and probably most importantly (iii) the ambiguity of Hi-C data due to heterogeneity among cells in the sample. A robust TD identification method should identify high-quality TDs in a consistent manner.
In this paper, we propose an efficient and deterministic method, TopDom, to systematically identify topological domains. Compared to previous methods, TopDom has linear time complexity and only depends on a single, intuitive parameter. Using this method, we identify TDs that reproduce the fundamental definition of a chromatin TD, namely that the average contact frequency between regions within a TD is much higher than the average contact frequency between inside and outside regions. We compared our method with two existing methods, and showed that TopDom can identify fine-scaled TDs with high quality. Using the TDs identified by our method, we show that cross-tissue TD conservation is even stronger than previously reported, and that the locations of housekeeping genes are strongly associated with cross-tissue conserved TDs.
MATERIALS AND METHODS
We focused on three questions while designing a new method for TD identification: (i) How can we reduce false detections and improve the quality of the TDs? (ii) How can we reduce the computational cost for TD detection? (iii) How can we minimize the number of parameters required to reliably identify TDs?
We propose an efficient and effective method, TopDom, with a single easy-to-adjust parameter. The input data are a Hi-C contact map, where entries are contact frequencies between any two chromatin segments (i.e. bins in the data matrix). Our method has three steps: (i) For each bin, we generate a value binSignal by computing the average contact frequency among pairs of chromatin regions (one upstream, the other downstream) in a small window surrounding the bin. This step results in a curve binSignal(i) that runs along the chromosome. (ii) Discover TD boundaries as local minima in the binSignal(i) series. (iii) Filter out false detections in the local minima by statistical testing. Each step is described in more detail below.
Step 1. Generating binSignal by computing bin-level contact frequencies
A TD boundary can be defined as a region between two adjacent TDs. In general, the contact frequencies between regions upstream and downstream of a TD boundary are lower than those between two regions within a TD. We use this requirement to identify TD boundaries. First, for each bin, we compute the average contact frequency between upstream and downstream regions around the bin location. The size of the window for this calculation is controlled by a free parameter w. Let i denote the bin index. We define a window of length 2w that selects upstream regions Ui = {i-w-1, i-w, …, i}, and downstream regions Di = {i+1, i+2, …, i+w} around the bin i. The average contact frequency, denoted  , is calculated as follows:
 |
(1) |
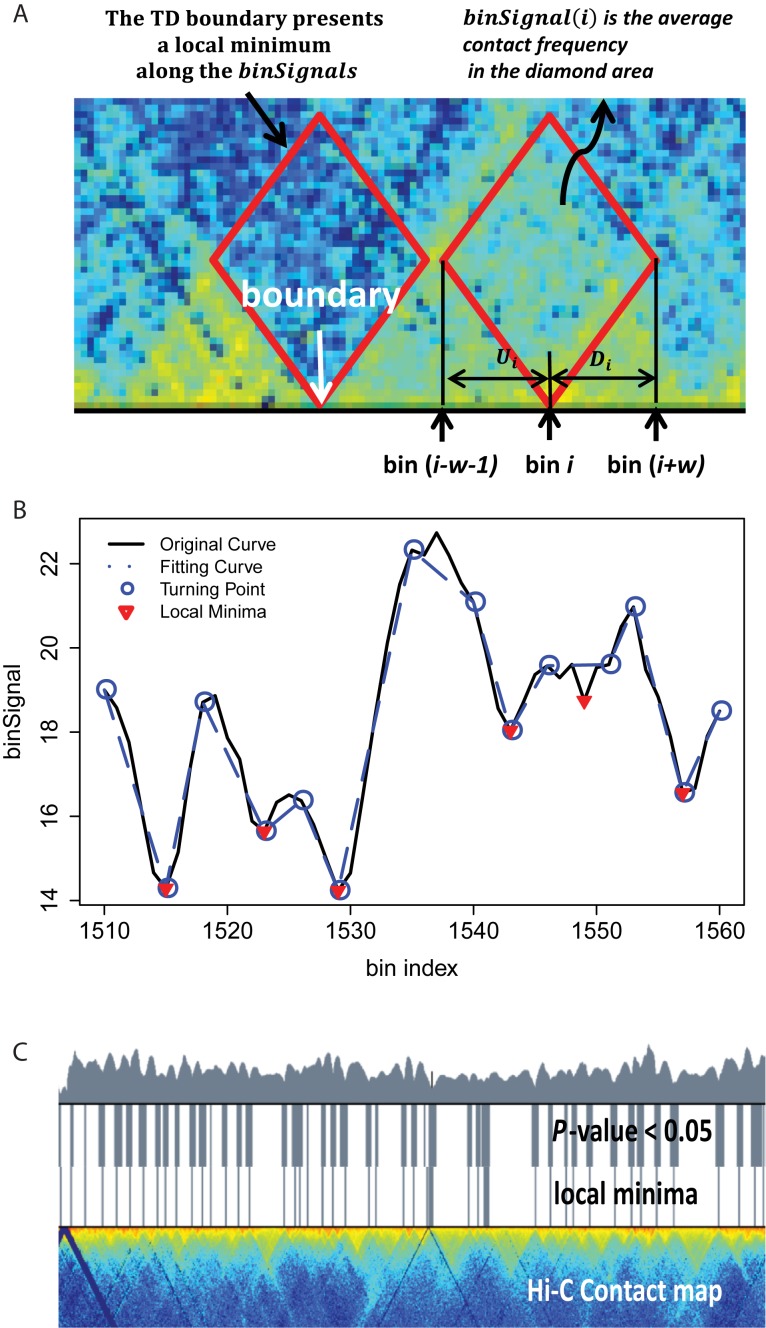
where cont.freq indicates the contact frequency between two bins. Intuitively,  illustrates the average contact frequency between bins in the neighborhood of i, as illustrated in the diamond-shaped area of Figure 1A. We expect
  to be high for bins located close to the center of a TD, while it should be low at a TD boundary. In the following section, we present our approach to find the curve whose shape best fits
  across a TD boundary without any parameters, and then detect local minima using the fitting curve.
Figure 1.
TopDom method. (A) We define binSignal(i) as the average contact frequency between an upstream and a downstream chromatin region (Ui and Di) in a window (of size 2w) surrounding bin i. The value of binSignal(i) is relatively high if bin i is located inside a TD (red diamond), and reaches a local minimum at a TD boundary (dotted red diamond). (B) Using a piecewise linear curve fitting algorithm, we identify turning points (blue circles) in the original curve (black) binSignal(i). Dominant local minima (red inverted triangles) can be detected using the piecewise linear curve (dotted blue line). (C) We compute P-values to assess the validity of local minima by comparing within.interactions and between.interactions using a Wilcox rank-sum test. Deep valleys in the original binSignal(i) curve (top layer), regions with P-values < 0.05 (second layer) and local minima in the piecewise linear curve (third layer) are generally highly consistent. Also, those regions indicate boundaries on a Hi-C contact map (bottom layer).
Step 2. Detect TD boundaries based on binSignal
Intuitively, local minima in the  series along a chromosome represent TD boundaries. However, some local minima result from noise in the data. In order to capture the dominant local minima, we first smooth the binSignal curve. Our strategy is to approximate the binSignal curve with line segments to capture major trends, and for this purpose we adopt the linear-time algorithm of Kumar Ray et al. (15,16).
Specifically, we fit binSignal with a piecewise linear function consisting of the longest possible line segments but minimum fitting error, defined as the sum of distances from points in binSignal to the fitted line segments. The fitness function for a given line segment j is calculated as Fj = Lj - Ej, where Lj denotes the line length and Ej the fitting error. The end of a fitted line segment is termed a turning point. The algorithm is detailed below. Given a fixed starting point (Pstart), it tests line segments of increasing length connecting Pstart to a later point (Pj). The fitness generally increases with line length, but when the algorithm finds a line with a smaller fitness score than the previous line, it saves the previous line as part of the final curve. The previously tested endpoint becomes a turning point and the new starting point for the next iteration. Repeating this procedure until Pj arrives at the end of binSignal (the end of the chromosome), we are able to build a piecewise linear function that clearly identifies all turning points in binSignal.
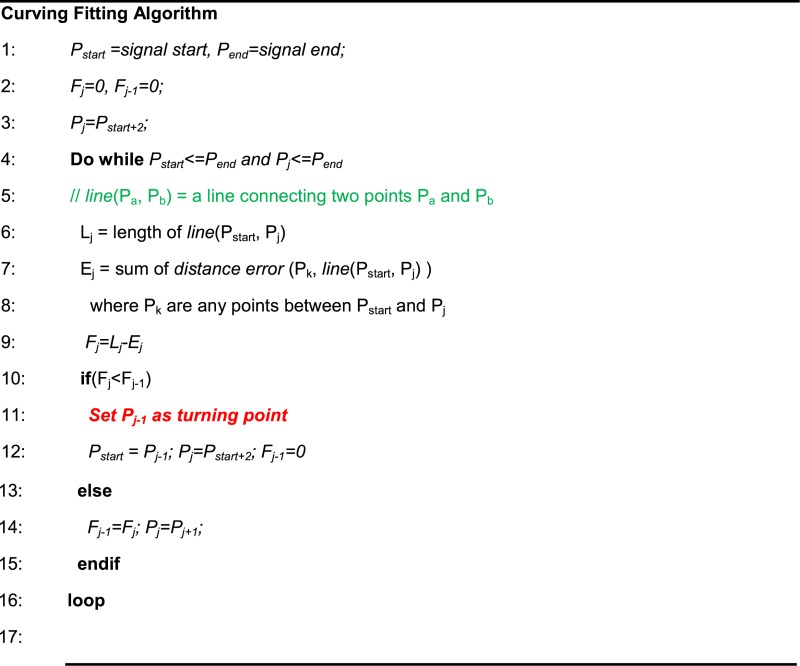
Given the set of turning points from the fitted line segments, we then search for the local minima that have the smallest contact frequencies compared to those of their neighboring bins. Local minima are points that satisfy the following two conditions:
The derivative changes from negative to positive in the interval between two adjacent turning points
The contact frequency has the smallest value the interval between two adjacent turning points
Figure 1B exemplifies the original binSignal curve (black), the fitting curve (blue dotted line) and the turning points (blue dots). The local minima (red inverted triangles) capture ‘TD boundary-like’ bins, and avoid weak local minima in the original curve that are likely due to noise.
Step 3. Statistical filtering of false positive TD boundaries
To filter false positives from the identified TD boundaries, we take advantage of the fact that chromatin interactions inside TDs generally have higher frequencies than those between adjacent TDs. This means that at a TD boundary, interactions between upstream and downstream bins (i.e. between two different TDs) should be much less frequent than interactions between different upstream neighbor bins, or interactions between different downstream neighbor bins. Thus, given a bin i, an adjacent upstream window of length w and an adjacent downstream window of length w, we denote interactions between the up- and downstream windows as the ‘between.interactions’, and interactions within the up- or downstream windows as ‘within.interactions’. If bin i is located at a TD boundary, we expect within.interactions to be stronger than between.interactions; otherwise, there should be no significant difference between within.interactions and between.interactions.
 |
 |
or
 |
..
We perform the Wilcox Rank Sum test to assess whether there is a significant difference between within.interactions and between.interactions for each bin. Because the contact frequency between two bins is highly dependent on the genomic distance between them, we calculate the z-score of each cont.freq (A, B), normalized by all cont.freq (A, B) with the same genomic distance. Finally, we filter out local minima with P-values larger than 0.05. As shown in Figure 1C, almost all local minima discovered in the processed binSignal curve are associated with P-values< 0.05. In practice, only a small proportion of the local minima are discarded at this step. Note that although Steps 2 and 3 are both designed to identify TDs based on the fundamental definition, Step 3 draws on a broader chromatin range (two adjacent TDs) than Step 2 (only a window around a TD boundary).
Given all identified local minima and the P-values of all bins along the chromosome, we use the following rule to annotate TDs and boundary regions: given two consecutive local minima, if any bin does not show a significant difference between the contact frequencies of within.interactions and between.interactions (P-value > 0.05), we classify the region between the minima as a TD; otherwise, we classify it as a boundary region. The boundary regions represent TD-free chromatin at the given sequencing resolution and current parameter settings.
RESULTS
Determination of the TopDom parameter
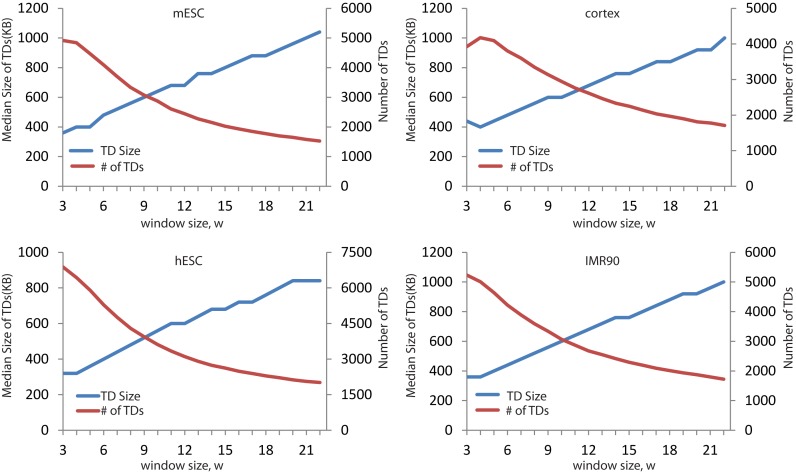
We performed our analysis on Hi-C data sets of two mouse cells (embryonic stem cell and cortex cell) and two human cell lines (embryonic stem cell and IMR90), at a bin resolution of 40 kb, as suggested in the previous study (1). TopDom has a single adjustable parameter, the window size w used to compute binSignal. In general, as w increases, the size of the discovered TDs increases and the number of TDs decreases (Figure 2). To determine the best window size w, we rely on an important characteristic of TDs: bins within a given TD should have more similar contact frequency profiles than bins outside the TD. Therefore, we calculated Pearson's correlation coefficient (PCC) between the contact profiles of bins within a TD as a quality measurement. Moreover, since topological domains are local features of chromatin organization, we also calculate the weighted Pearson's correlation coefficient (wPCC) where contacts inside the TDs are weighted more. Specifically, each bin's contribution to wPCC is weighted by the background contact frequency bi for any two bins at a distance i between the bin and the center bin of the TD. For the contact profiles x and y of two bins within a TD, the weighted correlation coefficient is calculated according to (Equation 2).
 |
(2) |
where
 |
Figure 2.
Variations in the size and number of TDs. The median size of TDs increases (blue) and the number of TDs decreases (red) with window size.
and
 |
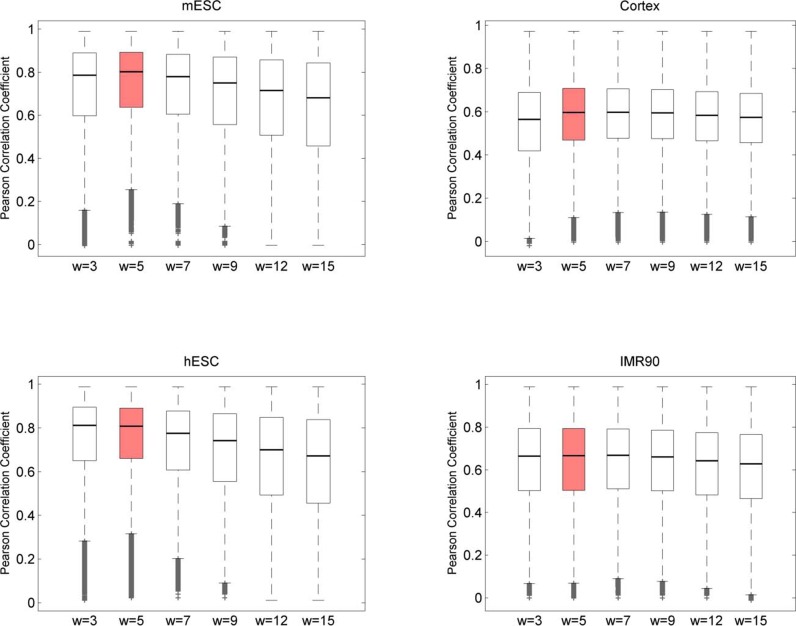
As shown in Figure 3, among the window sizes w = 3, 5, 7, 9, 12 and 15, the choice w = 5 consistently achieved the highest average PCC/wPCC scores. This measurement can be considered a general guideline to determine w, as the ideal value might depend on the genome studied. Considering the previously reported minimum TD size (≈200 kb) (1) and our bin size of 40 kb, w = 5 is a reasonable setting. All results discussed below, unless otherwise stated, are based on the setting w = 5.
Figure 3.
Selection of the window size. The average intra-TD Pearson's correlation coefficient (PCC) and weighted PCC were adopted as measurements of a TD's quality. We computed intra-TD PCC/wPCC for all TDs, with the window size varying from 3 to 15, and the highest average PCC was obtained for w = 5 (red) in all four cell lines. The results for wPCC are very similar (plots not shown).
Comparison between TopDom and existing methods
Considering the popularity of existing methods (based on the number of citations and source code availability), we compared our TopDom method with the directionality index method (1) and the recently developed HicSeg method (14). We refer to these two methods hereafter as DI and HicSeg, respectively.
Our TopDom program (available via http://zhoulab.usc.edu/TopDom/) was written in R (CRAN) script and tested on an Intel Xeon 3.3GHz computer with 10GB RAM. We ran the HicSeg algorithm on the same computer with nb_change_max = 500, distrib = ‘G’ and model = ‘Dplus’. For the DI method, we followed the default settings mentioned in (1). In the same computational environment, TopDom is more efficient at identifying TDs from the same input HiC data. TopDom takes 6–7 min, while DI takes >8 h and HicSeg takes about 2.5 h to process the whole mouse genome.
We counted the number of TDs identified by the three methods. Setting the window size w = 5, TopDom identifies more TDs than the other two methods; consequently, the average size of TDs identified by TopDom is smaller (see Table 1).
Table 1. Comparison of TDs identified by three different methods for four cell types.
| Species | Cell Type | Method | No. of TDs | Ave. Size of TDs |
|---|---|---|---|---|
| Human | hESC | TopDom | 5904 | 453 kb |
| DI | 3127 | 855 kb | ||
| HicSeg | 5240 | 528 kb | ||
| IMR90 | TopDom | 4640 | 580 kb | |
| DI | 2348 | 1123 kb | ||
| HicSeg | 4189 | 657 kb | ||
| Mouse | mESC | TopDom | 4477 | 531 kb |
| DI | 2200 | 1093 kb | ||
| HicSeg | 3484 | 720 kb | ||
| Cortex | TopDom | 4094 | 596 kb | |
| DI | 1518 | 1540 kb | ||
| HicSeg | 3103 | 809 kb |
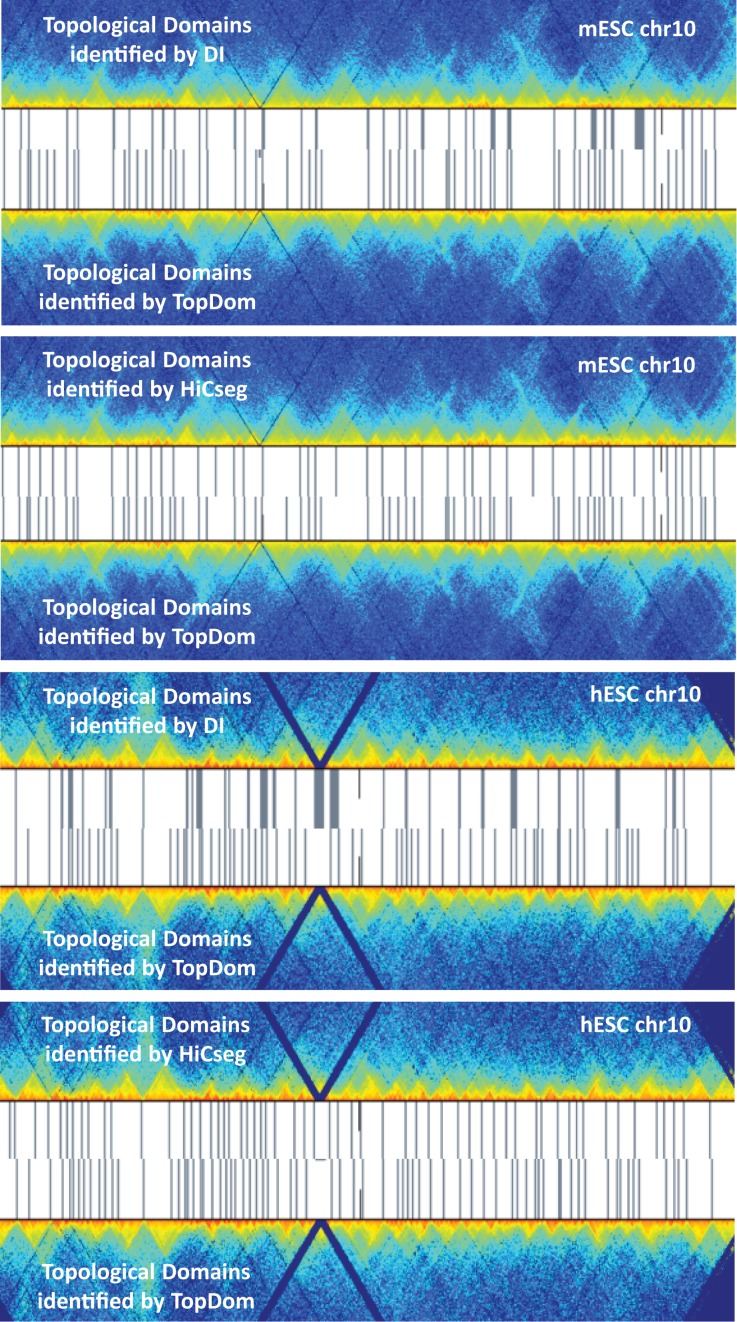
Consistent with results from the DI and HiCseg methods, we found that the average size of TDs in hESC is slightly smaller than that in IMR90, ≈450 kb versus ≈600 kb, respectively. As shown in Figure 4, TopDom captures more boundary-like regions, and most of the TD boundaries discovered by the DI and HiCseg methods are covered by the TD boundaries. While the DI method is generally good at identifying boundaries between large TDs, TopDom and HiCseg are able to detect TDs of smaller size. Thus, both algorithms reveal the topological structure of a genome on a finer scale than DI, and with improved efficiency.
Figure 4.
Illustration of topological domains identified by the DI method, HiCseg and TopDom. TD boundaries (gray bars) are plotted on the Hi-C contact map of chromosome 10 (randomly chosen for this illustration) in mESC and hESC cell types. TD boundaries identified by TopDom (bottom) sensitively capture boundary-like regions. Most TD boundaries identified by the DI method and HiCseg are shared by the TopDom TD boundaries.
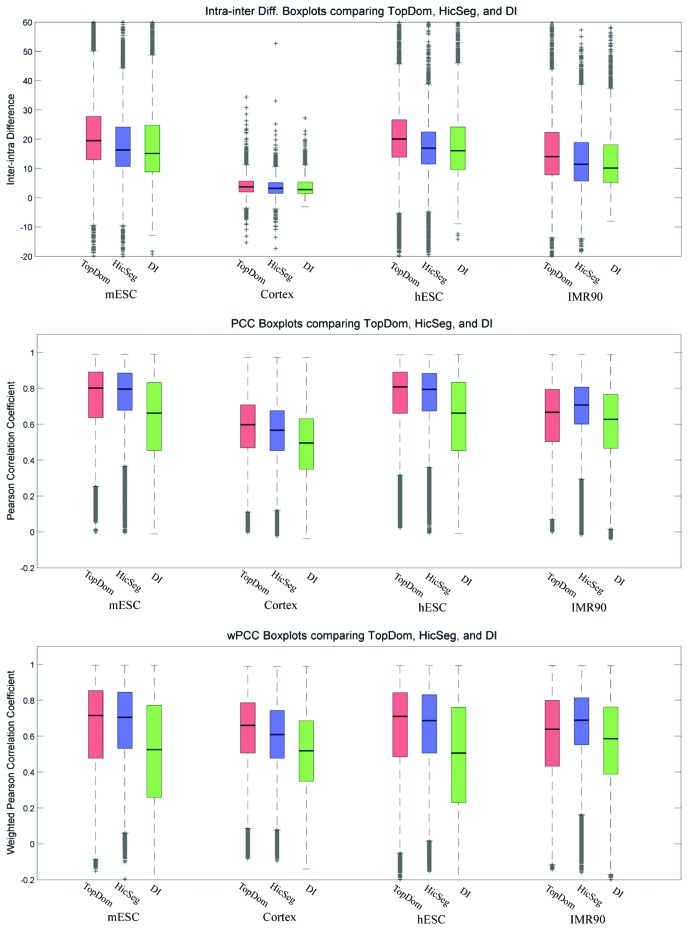
We then compared the methods in terms of three different quality measurements: the intra-TD Pearson's correlation coefficient (PCC), the intra-TD weighted Pearson's correlation coefficient (wPCC), and the difference between the average intra-TD and inter-TD contact frequencies. The last measure is a good alternative quality score because bins in the same TD should have high-frequency interactions, while bins from adjacent TDs should have limited interactions. Let Intra(i) denote the average of contact frequencies between bins within the same TD i, and Inter(i, j) denote the average of contact frequencies between a bin in TD i and a bin in adjacent TD j, where |i – j | = 1. The TD quality can then be defined as Intra(i) – Inter(i, j).
With the setting w = 5, TopDom displays significantly better performance in terms of the mean and variance of all three quality measurements across all four cell lines (P-value < 1e−50 by t-test), except for the measurements of PCC and wPCC on IMR90 (Figure 5). This evaluation indicates that generally, our method more accurately identifies TDs in terms of the similarity of their contact profiles.
Figure 5.
Quality comparison of TDs identified by TopDom, HicSeg and DI on four cell lines using the intra-inter difference measurement (the top panel), the average Pearson's correlation coefficient (the middle panel) and the weighted Pearson's correlation coefficient (the bottom panel). TopDom achieved higher scores than HicSeg and DI on all cases except IMR90 cells, with the PCC and wPCC measurements.
Epigenetic characteristics of chromatin in topological domains
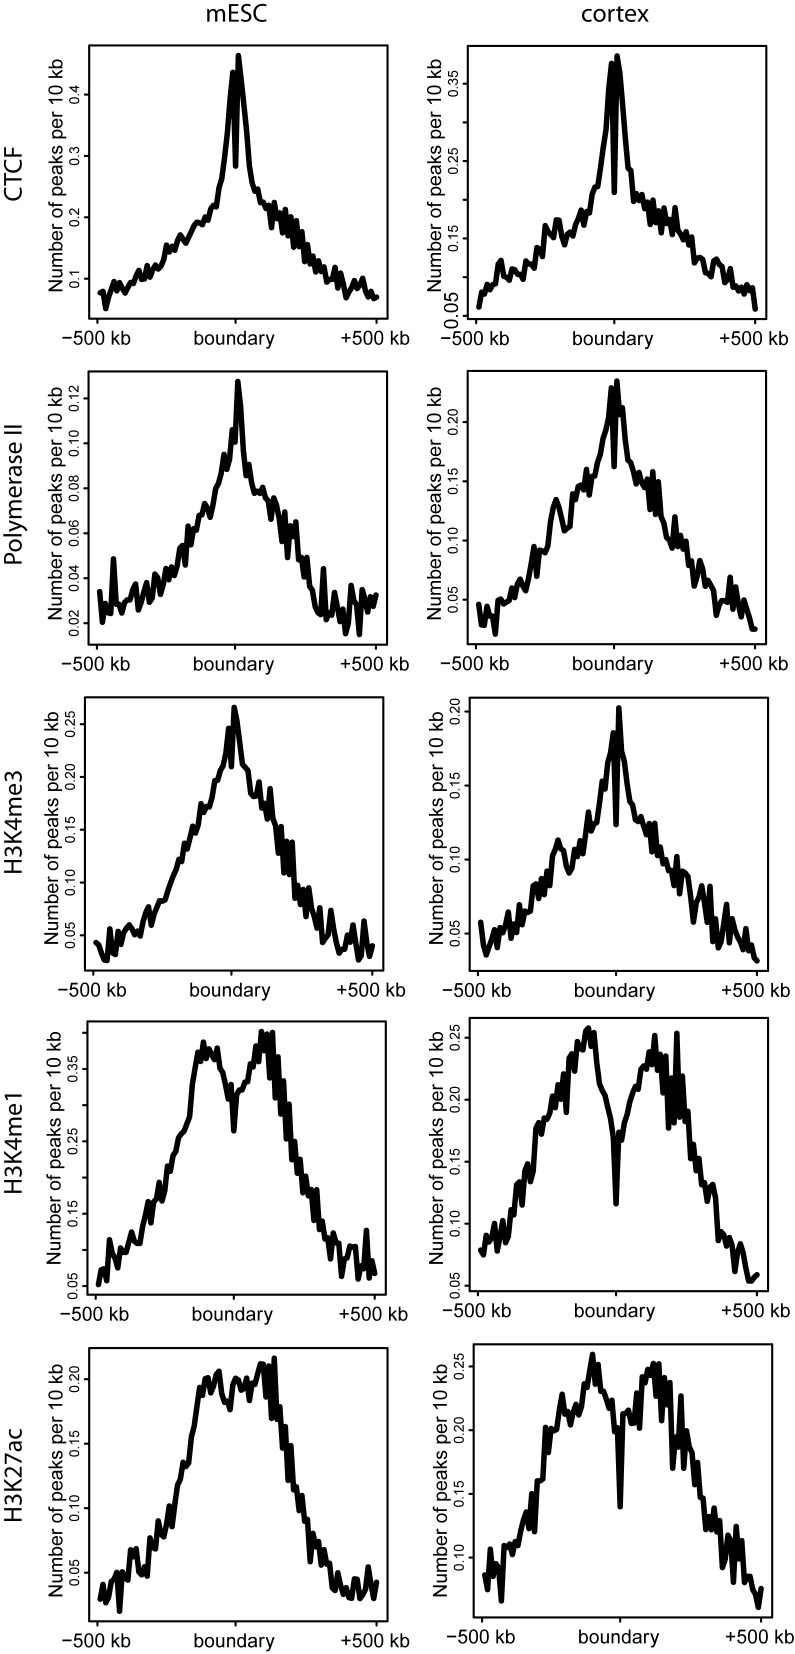
We explored whether certain regulatory factors might be associated with topological boundary regions. For mouse cortex and mESC cells, we collected ChipSeq data from Shen et al. 2012 (17) for the architectural protein CTCF, promoter-related marks (RNA Polymerase II and H3K4me3) and enhancer-related histone modifications (H3K4me1 and H3K27ac). As shown in Figure 6, in both cell types CTCF binding sites are twice as enriched near TD boundaries compared to surrounding regions, confirming the role of CTCF as an insulator (18,19). Similarly, promoter marks such as RNA Polymerase II and H3K4me3 also peak near the boundaries in both cell types (Figure 6). This observation suggests that gene transcription start sites (TSSs) are mainly located at TD boundaries. In addition, H3K4me1 is slightly depleted at locations close to the TD boundaries in both cell types. Interestingly, we observed that H3K27ac shows a different pattern, with a slight peak at the TD boundaries in the mESC cells and a slight depletion at the TD boundaries in mouse cortex cells. The signals are weak for both of these marks, however, due to the regulatory complexity of enhancer regions (Figure 6). All of these observations are highly consistent with previous discoveries (1,4,11–13,20) and support the claim that functional organizations are closely related to physical TD structures.
Figure 6.
Epigenetic characteristics surrounding boundary regions. From the ChIP-seq data of five epigenetic marks in mouse ESC and cortex cells, we identified peaks (P-value < 0.05) using MACS14 (28). The CTCF and promoter marks (Polymerase II and H3K4me3) are enriched near TD boundaries for both cell types. For the enhancer marks H3K4me1 and H3K27ac, the enrichment patterns near boundaries are slightly depleted in both cell types.
TopDom can identify fine-scaled topological domain structures
Our method identified more TDs than the other two methods at w = 5 (see Table 1), and its domains are smaller than those identified by other two methods. There is a great deal of overlap between the regions identified as TDs (comparing DI to TopDom and HiCseg to TopDom), as shown in Figure 4. We now analyze the overall consistency between different sets of TDs, and ask whether the new regions flagged by TopDom are likely to be true TDs. We classify all identified TD boundaries as common boundaries if they are identified by two different methods or in two cell types, and unique boundaries otherwise. The following paragraphs describe how we match TDs from different sets to identify corresponding TD boundaries.
Let A and B be two sets of TDs identified by the two methods on the same sample, {a1, a2, …, an} and {b1, b2, …, bm}. For each TD in A (ai ∈ A), we aim to find the best matching subsets in B (B’ ⊂ B) where B’ contains consecutive TDs along a chromosome. The overlap score measures the degree of matching between a TD from A and a set of consecutive TDs from B:
 |
We computed the overlap scores between every TD in A (ai ∈ A) and all possible subsets (B’ ⊂ B) in B. The subset with the highest overlap score is selected as the best matching set of ai ⊂ A.
 |
Note that the overlap score and the bestmatch operation can also be used to compare TDs across cell types.
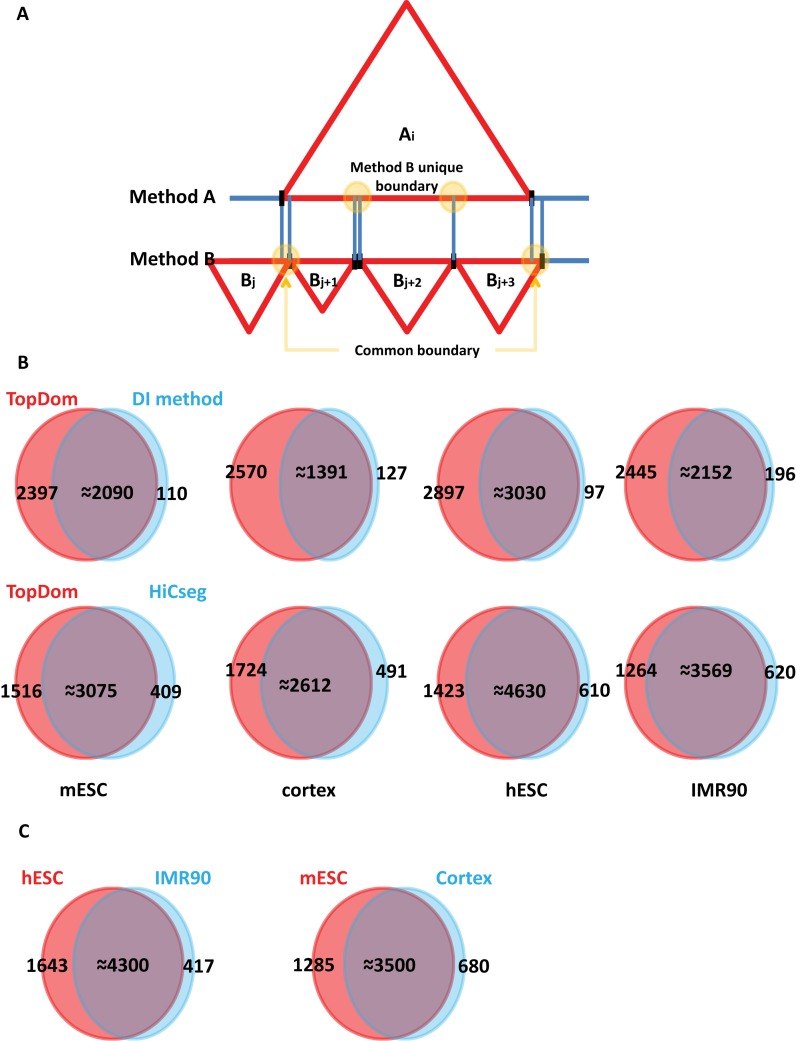
Figure 7A illustrates this concept. The i-th TD in A (ai ∈ A) is overlapped by four TDs (bj, bj+1, bj+2, bj+3) in B. We identify the subset B’ = {bj+1, bj+2, bj+3} with the highest overlap score as the bestmatch of ai. Therefore, boundaries partitioning bj-bj+1 and bj+3-bj+4 are classified as common boundaries, and the boundaries demarcating bj+1-bj+2 and bj+2-bj+3 are considered unique boundaries.
Figure 7.
Common and Unique Boundaries. (A) Illustration of common and unique boundaries. (B) Overlap of TD boundaries identified by the DI method versus TopDom (top) and HiCseg versus TopDom (bottom). Most TD boundaries identified by the DI and HiCseg methods are included in the set identified by TopDom. (C) Overlap of TD boundaries in different cell types (hESC versus IMR90, mESC versus cortex). The TD sets overlap greatly, indicating the strong conservation of TDs across cell types.
As shown in Figure 7B, TopDom identified 2300–2900 unique boundaries in the four cell types when compared with the DI method. TopDom identified 1200–1700 unique boundaries when compared with the HiCseg method. This result suggests that the TopDom TD boundaries include most of the TD boundaries detected by the DI and HiCseg methods. Moreover, we confirm that TD boundaries are strongly conserved across cell types (>70%) (see Figure 7C), which implies that TD structure is also conserved (1).
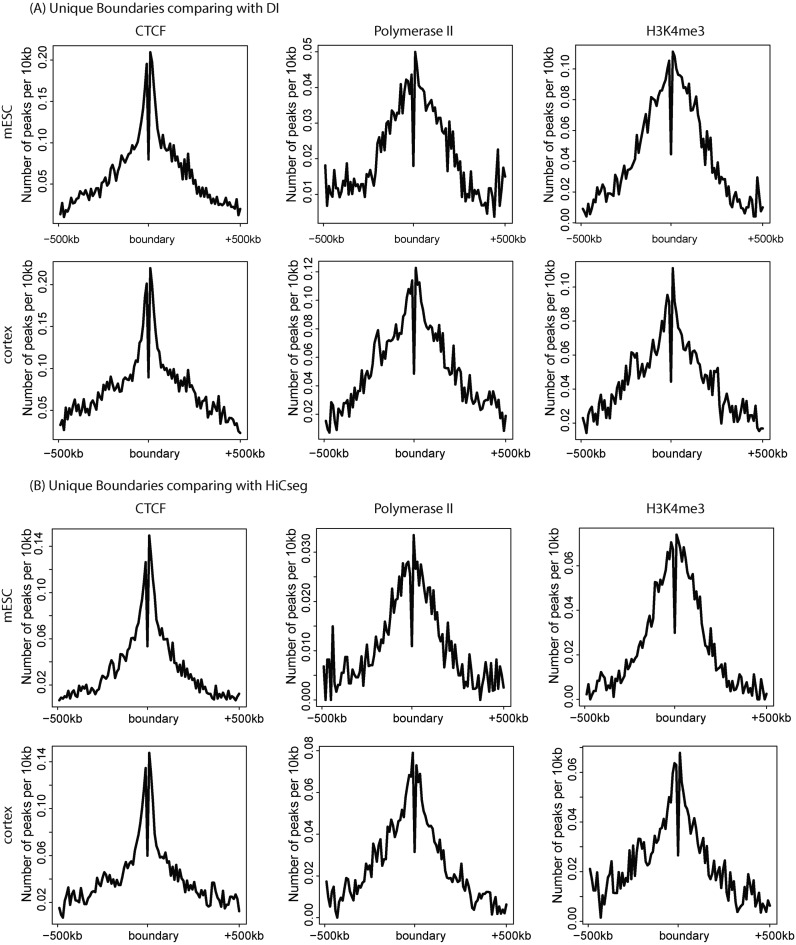
We next asked whether the TopDom unique boundaries can be considered ‘true TD boundaries’ based on their epigenetic characteristics. We examined the enrichment patterns of three epigenetic profiles, CTCF, PolII and H3K4me3, at unique and common (shared by different methods) boundaries for the two mouse cell types. As shown in Figure 8, epigenetic enrichment patterns at our unique boundaries are similar to those at the common boundaries. This strongly suggests that our method is finding fine-scale structures not reported by other methods.
Figure 8.
Epigenetic characteristics of unique boundaries. We examined the epigenetic characteristics of unique boundaries, identified with respect to DI (A) and HiCseg (B). In both (A) and (B), CTCF, Polymerase II and H3K4me3 have strong peaks near unique TD boundaries for both mESC and mouse cortex cells. Their epigenetic profiles at unique boundaries are very similar, with the boundaries showing in Figure 6.
TopDom reveals a significant association between TD conservation and housekeeping gene locations
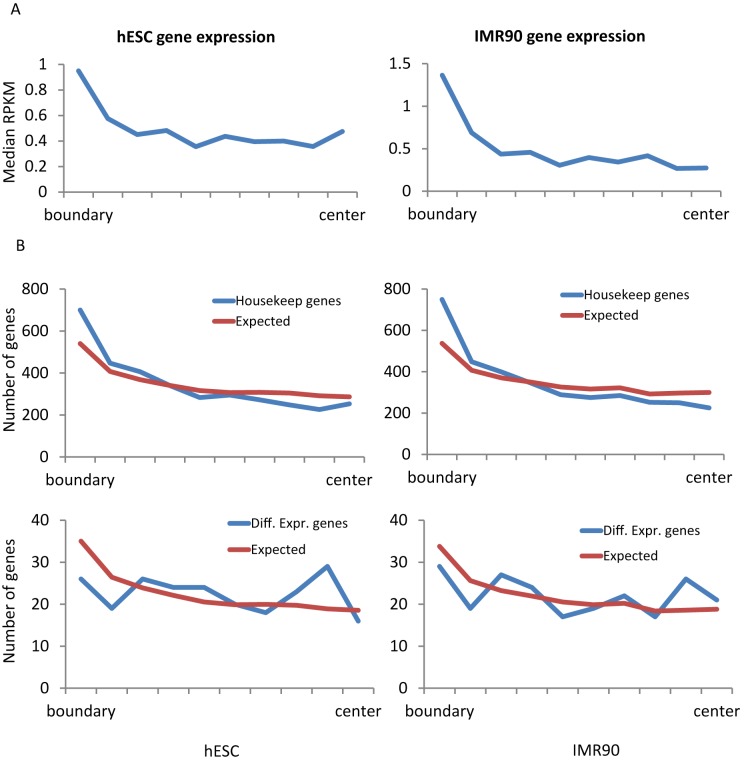
We examined the locations and properties of genes in the context of TDs. For all 22 000 genes of hg18 refSeq in the UCSC genome browser database, we assigned each gene to one of the TDs identified by TopDom. RNA-seq data of the hESC (GSM438363) and IMR90 (GSM438361) cell lines (21–24) were collected from the NCBI Epigenomics Gateway, and cufflinks (25) was used to measure gene expression levels. Similar to the epigenetic profiles, gene density and gene expression increase in regions close to TD boundaries (Figure 9A), suggesting that TD boundaries are likely to have open chromatin. Furthermore, we examined the locations of about 3000 human housekeeping genes (26) and observed that they reside significantly closer to TD boundaries than would be expected under random assignment (Figure 9B). This observation is consistent with previous claims that housekeeping genes tend to locate at TD boundaries (1,4). In contrast, we selected 230 differentially expressed genes (q-value < 0.05) using cuffdiff (25) and observed that the locations of those genes do not show a preference toward TD boundaries (Figure 9B). This could indicate that gene expression differences are largely driven by complex regulatory interactions within the TDs.
Figure 9.
Gene expression and housekeeping gene density near TD boundaries. (A) For two human cell types (hESC and IMR90), we observed that the median RPKM tends to be higher closer to TD boundaries. (B) Housekeeping genes reside significantly closer to TD boundaries than expected (top), but no such pattern exists for differentially expressed genes (bottom).
Considering the facts that housekeeping genes behave similarly across cell types, and that their locations are highly related to TD structures, we next asked if there is a relationship between the locations of housekeeping genes and the structural conservation of TDs across cell types. Dixon et al. reported that around 50–80% of boundaries are shared across cell types (1). In our result, around 80–90% of TD boundaries in the differentiated cells (IMR90 cell, mouse cortex cell) are included in those of embryonic stem cells (hESC, mESC) (Figure 7C), and more than 70% of TD boundaries found in embryonic stem cells are shared with differentiated cells. This suggests that our TDs can provide even stronger support for the conservation of TDs across cell types.
We then examined whether the conserved TD structures are related to the locations of housekeeping genes. First, we counted the number of housekeeping genes that are close to common and unique boundaries in the IMR90 and hESC cells. As shown in Table 2, around 90% of housekeeping genes are located close to common boundaries. Considering that the proportion of common boundaries at hESC is around 70%, this proportion is significantly higher than expected. By a chi-square test (Table 2), we confirm that housekeeping genes are located significantly closer to common boundaries (P-value < 2.2e-16). In summary, our analysis provides strong evidence that TDs are highly conserved across cell types, and that the locations of housekeeping genes are closely related to the conserved TDs.
Table 2. Chi-squared test on the association between conserved TD structures and the locations of housekeeping genes.
| Common Boundaries | Unique Boundaries | |
|---|---|---|
| House-keeping genes | 3315 | 388 |
| Non House-keeping genes | 16 053 | 3255 |
Around 90% of housekeeping genes are mapped to common domain boundaries.
DISCUSSION
We have presented an efficient and deterministic method, TopDom, for identifying chromatin topological domains (TDs). Compared to previous methods, TopDom is not only computationally efficient but also easy for general users to learn and apply. Using several objective assessments, we show that our method captures finer-scale TDs with generally higher quality than two popular existing methods.
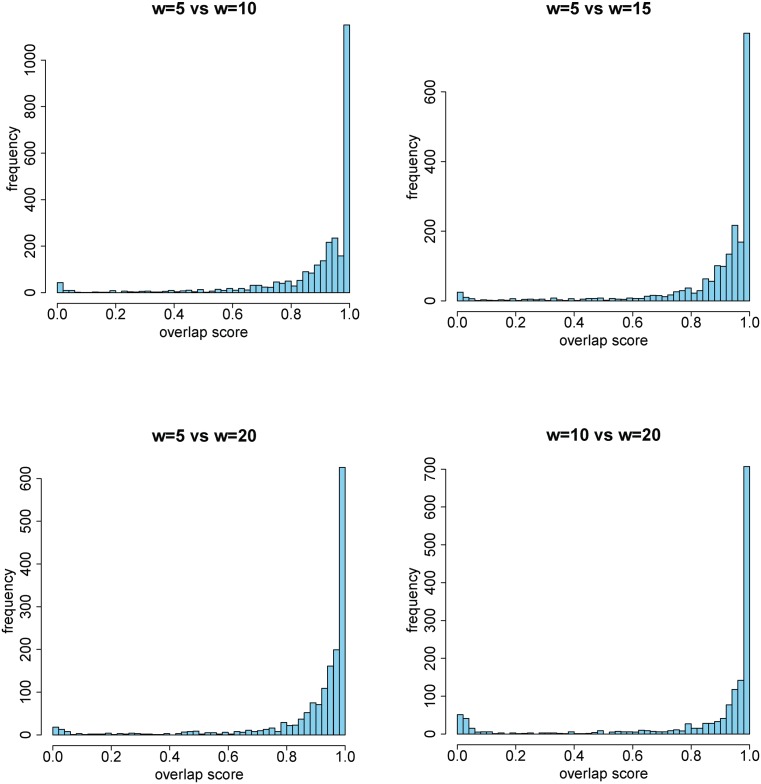
Given a Hi-C data set with fixed resolution (bin size), the only parameter that needs to be chosen by a researcher is the window size, and we have discussed how to choose an appropriate value for this parameter in the Results section. We discovered that the TDs identified under different window sizes w are slightly different, and additionally confirmed that the identified TDs overlap with each other a great deal (Figure 10). This indicates that the set of TD boundaries identified with a small value of w will include most of the TD boundaries identified with a large value of w. Furthermore, we applied TopDom to the Hi-C data at 20 kb and 40 kb resolutions to determine how the bin resolution affects TopDom performance. According to the approach described above, we set w = 5 for the 40 kb Hi-C data of all four cell lines and w = 7, 15, 15 and 5 for the 20 kb Hi-C data of mESC, Cortex, hESC and IMR90, respectively. We then computed the overlap scores of the TDs identified on 20 kb-resolution data with those identified on 40 kb-resolution data. The mean overlap score is around 0.97 on all four cell lines, with a standard deviation around 0.09, indicating that TopDom is not sensitive to the choice of bin size.
Figure 10.
Overlap score of TDs under different window settings. TDs identified by two different w settings have a high overlap score (>0.9) in all four cell types.
We also demonstrated the validity of the TopDom method through several biological assessments. The TDs identified by TopDom support previous claims that TD boundaries are highly related to CTCF binding, promoter regions and housekeeping gene locations. We also observed that TDs are highly conserved; there can be more than 70% overlap in their boundaries across cell types. Moreover, when comparing TDs from two different cell types, we found that housekeeping genes are preferentially located close to TD boundaries in both cell types, which implies that topological conservation is associated with the locations of these genes.
TD identification can not only provide insights into local chromatin structures, but also facilitate the construction of global 3D genome models. Since chromatin interactions within a TD are much more frequent than interactions between TDs, a coarse genome structural model can use TDs as its basic building blocks. While the fine structures within a TD can vary (27), all chromatin regions within a TD are likely to co-localize in nuclear space. Thus, our method, by efficiently and effectively identifying TDs, can help emerging efforts on investigating the higher order genome organization.
FUNDING
National Institutes of Health (NIH) [NHLBI MAPGEN U01HL108634 to X.J.Z., U54 DK107981 to F.A.]; NSF [CAREER 0747475 to X.J.Z., CAREER 1150287 to F.A.]; Arnold and Mabel Beckman foundation [BYI award to F.A.]; Pew Charitable Trusts [Pew Scholarship to F.A.]. Funding for open access charge: National Institutes of Health (NIH) [NHLBI MAPGEN U01HL108634 to X.J.Z.].
Conflict of interest statement. None declared.
REFERENCES
- 1.Dixon J.R., Selvaraj S., Yue F., Kim A., Li Y., Shen Y., Hu M., Liu J.S., Ren B. Topological domains in mammalian genomes identified by analysis of chromatin interactions. Nature. 2012;485:376–380. doi: 10.1038/nature11082. [DOI] [PMC free article] [PubMed] [Google Scholar]
- 2.Lanctôt C., Cheutin T., Cremer M., Cavalli G., Cremer T. Dynamic genome architecture in the nuclear space: regulation of gene expression in three dimensions. Nat. Rev. Genet. 2007;8:104–115. doi: 10.1038/nrg2041. [DOI] [PubMed] [Google Scholar]
- 3.Sexton T., Schober H., Fraser P., Gasser S.M. Gene regulation through nuclear organization. Nat. Struct. Mol. Biol. 2007;14:1049–1055. doi: 10.1038/nsmb1324. [DOI] [PubMed] [Google Scholar]
- 4.Sexton T., Yaffe E., Kenigsberg E., Bantignies F., Leblanc B., Hoichman M., Parrinello H., Tanay A., Cavalli G. Three-dimensional folding and functional organization principles of the Drosophila genome. Cell. 2012;148:458–472. doi: 10.1016/j.cell.2012.01.010. [DOI] [PubMed] [Google Scholar]
- 5.Dixon J.R., Jung I., Selvaraj S., Shen Y., Antosiewicz-Bourget J.E., Lee A.Y., Ye Z., Kim A., Rajagopal N., Xie W. Chromatin architecture reorganization during stem cell differentiation. Nature. 2015;518:331–336. doi: 10.1038/nature14222. [DOI] [PMC free article] [PubMed] [Google Scholar]
- 6.Rao S.S., Huntley M.H., Durand N.C., Stamenova E.K., Bochkov I.D., Robinson J.T., Sanborn A.L., Machol I., Omer A.D., Lander E.S. A 3D map of the human genome at kilobase resolution reveals principles of chromatin looping. Cell. 2014;159:1665–1680. doi: 10.1016/j.cell.2014.11.021. [DOI] [PMC free article] [PubMed] [Google Scholar]
- 7.Lin Y.C., Benner C., Mansson R., Heinz S., Miyazaki K., Miyazaki M., Chandra V., Bossen C., Glass C.K., Murre C. Global changes in the nuclear positioning of genes and intra-and interdomain genomic interactions that orchestrate B cell fate. Nat. Immunol. 2012;13:1196–1204. doi: 10.1038/ni.2432. [DOI] [PMC free article] [PubMed] [Google Scholar]
- 8.Lieberman-Aiden E., van Berkum N.L., Williams L., Imakaev M., Ragoczy T., Telling A., Amit I., Lajoie B.R., Sabo P.J., Dorschner M.O. Comprehensive mapping of long-range interactions reveals folding principles of the human genome. Science. 2009;326:289–293. doi: 10.1126/science.1181369. [DOI] [PMC free article] [PubMed] [Google Scholar]
- 9.Kalhor R., Tjong H., Jayathilaka N., Alber F., Chen L. Genome architectures revealed by tethered chromosome conformation capture and population-based modeling. Nat. Biotechnol. 2012;30:90–98. doi: 10.1038/nbt.2057. [DOI] [PMC free article] [PubMed] [Google Scholar]
- 10.Duan Z., Andronescu M., Schutz K., McIlwain S., Kim Y.J., Lee C., Shendure J., Fields S., Blau C.A., Noble W.S. A three-dimensional model of the yeast genome. Nature. 2010;465:363–367. doi: 10.1038/nature08973. [DOI] [PMC free article] [PubMed] [Google Scholar]
- 11.Filippova D., Patro R., Duggal G., Kingsford C. Identification of alternative topological domains in chromatin. Algorithms Mol. Biol. 2014;9:14. doi: 10.1186/1748-7188-9-14. [DOI] [PMC free article] [PubMed] [Google Scholar]
- 12.Hou C., Li L., Qin Z.S., Corces V.G. Gene density, transcription, and insulators contribute to the partition of the Drosophila genome into physical domains. Mol. Cell. 2012;48:471–484. doi: 10.1016/j.molcel.2012.08.031. [DOI] [PMC free article] [PubMed] [Google Scholar]
- 13.Nora E.P., Lajoie B.R., Schulz E.G., Giorgetti L., Okamoto I., Servant N., Piolot T., van Berkum N.L., Meisig J., Sedat J. Spatial partitioning of the regulatory landscape of the X-inactivation centre. Nature. 2012;485:381–385. doi: 10.1038/nature11049. [DOI] [PMC free article] [PubMed] [Google Scholar]
- 14.Levy-Leduc C., Delattre M., Mary-Huard T., Robin S. Two-dimensional segmentation for analyzing Hi-C data. Bioinformatics. 2014;30:I386–I392. doi: 10.1093/bioinformatics/btu443. [DOI] [PMC free article] [PubMed] [Google Scholar]
- 15.Ray B.K., Ray K.S. Determination of optimal polygon from digital curve using L 1 norm. Pattern Recognit. 1993;26:505–509. [Google Scholar]
- 16.Ray B.K., Ray K.S. A non-parametric sequential method for polygonal approximation of digital curves. Pattern Recognit. Lett. 1994;15:161–167. [Google Scholar]
- 17.Shen Y., Yue F., McCleary D.F., Ye Z., Edsall L., Kuan S., Wagner U., Dixon J., Lee L., Lobanenkov V.V. A map of the cis-regulatory sequences in the mouse genome. Nature. 2012;488:116–120. doi: 10.1038/nature11243. [DOI] [PMC free article] [PubMed] [Google Scholar]
- 18.Van Bortle K., Corces V.G. The role of chromatin insulators in nuclear architecture and genome function. Curr. Opin. Genet. Dev. 2013;23:212–218. doi: 10.1016/j.gde.2012.11.003. [DOI] [PMC free article] [PubMed] [Google Scholar]
- 19.Bickmore W.A., van Steensel B. Genome architecture: domain organization of interphase chromosomes. Cell. 2013;152:1270–1284. doi: 10.1016/j.cell.2013.02.001. [DOI] [PubMed] [Google Scholar]
- 20.Jin F., Li Y., Dixon J.R., Selvaraj S., Ye Z., Lee A.Y., Yen C.-A., Schmitt A.D., Espinoza C.A., Ren B. A high-resolution map of the three-dimensional chromatin interactome in human cells. Nature. 2013;503:290–294. doi: 10.1038/nature12644. [DOI] [PMC free article] [PubMed] [Google Scholar]
- 21.Bernstein B.E., Stamatoyannopoulos J.A., Costello J.F., Ren B., Milosavljevic A., Meissner A., Kellis M., Marra M.A., Beaudet A.L., Ecker J.R. The NIH roadmap epigenomics mapping consortium. Nat. Biotechnol. 2010;28:1045–1048. doi: 10.1038/nbt1010-1045. [DOI] [PMC free article] [PubMed] [Google Scholar]
- 22.Hawkins R.D., Hon G.C., Lee L.K., Ngo Q., Lister R., Pelizzola M., Edsall L.E., Kuan S., Luu Y., Klugman S. Distinct epigenomic landscapes of pluripotent and lineage-committed human cells. Cell Stem Cell. 2010;6:479–491. doi: 10.1016/j.stem.2010.03.018. [DOI] [PMC free article] [PubMed] [Google Scholar]
- 23.Lister R., Pelizzola M., Dowen R.H., Hawkins R.D., Hon G., Tonti-Filippini J., Nery J.R., Lee L., Ye Z., Ngo Q.-M. Human DNA methylomes at base resolution show widespread epigenomic differences. Nature. 2009;462:315–322. doi: 10.1038/nature08514. [DOI] [PMC free article] [PubMed] [Google Scholar]
- 24.Lister R., Pelizzola M., Kida Y.S., Hawkins R.D., Nery J.R., Hon G., Antosiewicz-Bourget J., O'Malley R., Castanon R., Klugman S. Hotspots of aberrant epigenomic reprogramming in human induced pluripotent stem cells. Nature. 2011;471:68–73. doi: 10.1038/nature09798. [DOI] [PMC free article] [PubMed] [Google Scholar]
- 25.Trapnell C., Williams B.A., Pertea G., Mortazavi A., Kwan G., van Baren M.J., Salzberg S.L., Wold B.J., Pachter L. Transcript assembly and quantification by RNA-Seq reveals unannotated transcripts and isoform switching during cell differentiation. Nat. Biotechnol. 2010;28:511–515. doi: 10.1038/nbt.1621. [DOI] [PMC free article] [PubMed] [Google Scholar]
- 26.Eisenberg E., Levanon E.Y. Human housekeeping genes, revisited. Trends Genetics. 2013;29:569–574. doi: 10.1016/j.tig.2013.05.010. [DOI] [PubMed] [Google Scholar]
- 27.Dekker J., Rippe K., Dekker M., Kleckner N. Capturing chromosome conformation. Science. 2002;295:1306–1311. doi: 10.1126/science.1067799. [DOI] [PubMed] [Google Scholar]
- 28.Zhang Y., Liu T., Meyer C.A., Eeckhoute J., Johnson D.S., Bernstein B.E., Nusbaum C., Myers R.M., Brown M., Li W. Model-based analysis of ChIP-Seq (MACS) Genome Biol. 2008;9:R137. doi: 10.1186/gb-2008-9-9-r137. [DOI] [PMC free article] [PubMed] [Google Scholar]


