

Abstract
Alzheimer’s disease is associated with metabolic deficits and reduced mitochondrial function, with the latter due to the effects of oligomeric amyloid beta peptide (AβO) on the respiratory chain. Recent evidence has demonstrated reduction of epigenetic markers, such as DNA methylation, in Alzheimer’s disease. Here we demonstrate a link between metabolic and epigenetic deficits via reduction of mitochondrial function which alters the expression of mediators of epigenetic modifications. AβO-induced loss of mitochondrial function in differentiated neuronal cells was reversed using two novel antioxidants (1 and 2); both have been shown to mitigate the effects of reactive oxygen species (ROS), and compound 1 also restores adenosine triphosphate (ATP) levels. While both compounds were effective in reducing ROS, restoration of ATP levels was associated with a more robust response to AβO treatment. Our in vitro system recapitulates key aspects of data from Alzheimer’s brain samples, the expression of epigenetic genes in which are also shown to be normalized by the novel analogues.
Keywords: Mitochondria, Alzheimer’s disease, epigenetics, multifunctional radical quenchers
Graphical Abstract
Severe metabolic deficit has been shown to be a prominent feature of Alzheimer’s disease in human brain,1 animal models,2–4 and in vitro models.5 Further, in vitro,6 mouse model,3,7 and human studies8 reveal that amyloid beta peptide (Aβ) and oligomeric amyloid beta peptide (AβO) are toxic to mitochondria, thus suggesting that Aβ may be responsible for the metabolic deficit observed in Alzheimer’s disease. Additionally, progressive accumulation of Aβ in mitochondrial Alzheimer’s disease neurons is believed to be an essential step leading to Aβ-mediated mitochondrial dysfunction, and several studies provide substantial evidence that mitochondria contain Aβ in Alzheimer’s disease,9–13 and that β-amyloid is directly responsible for impaired respiratory chain function.2,14–19
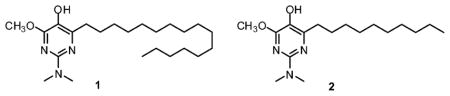
The foregoing observations raise the issue of the effects of mitochondrial deficits on the pathobiology of Alzheimer’s disease. Earlier literature20 led us to anticipate that epigenetic mechanisms might be affected significantly by mitochondrial deficits. Because bioenergetics is crucial to the epigenome, we hypothesized that the effects of AβO on mitochondria could be an overarching mechanism in the epigenetic and chromatin changes observed in Alzheimer’s disease.21,22 The importance of mitochondria to epigenetic function, chromatin structure, and gene transcription, which are all affected in Alzheimer’s disease, led us to investigate the effects of novel antioxidants of our design which have been shown to protect mitochondria, and thereby confer cytoprotection to cultured cells under conditions of induced oxidative stress.23,24 In earlier studies, these multifunctional radical quenchers (MRQs) have been shown to suppress cellular reactive oxygen species (ROS) and lipid peroxidation, apparently acting in a catalytic fashion to do so, and to maintain mitochondrial membrane potential and cell viability under conditions of induced oxidative stress. Some of the MRQs, including compound 1, also augment ATP production. Presently, it is demonstrated that 1 and 2 (Figure 1) also mitigate the effects of AβO.
Figure 1.

Structures of compounds 1 and 2.
The epigenetic regulation of chromatin structure is fundamental in maintaining appropriate levels of gene products to sustain normal cellular function. Because the structure of chromatin has been directly correlated with transcriptional activity which requires ATP,25 and ATP is essential for epigenetic regulation,26 defects in mitochondrial function that affect ATP levels might be expected to impact ongoing epigenetic modification of chromatin for actively transcribing and quiescent genes. It was found that treatment of cultured neuronal cells with 1 and 2 mitigated the effect of AβO, and increased the expression of a majority of the genes whose expression had been decreased by oligomeric Aβ. Also shown are unequivocal similarities to the transcription levels of genes for epigenetic modifying enzymes observed in Alzheimer’s disease brain and in the neuronal cell culture model treated with AβO.
RESULTS
Compounds 1 and 2 are Neuroprotective against Oligomeric AβO-induced Cytotoxicity in a Neuronal Cell Model
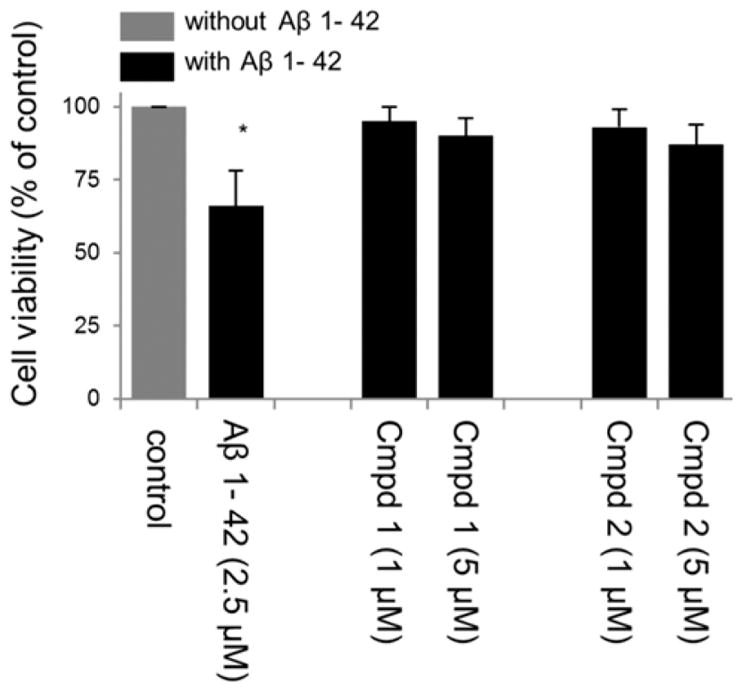
The impact of Aβ oligomers on mitochondrial redox activity in differentiated SH-SY5Y cells was evaluated using the WST-1 assay. As shown in Figure 2A, the cell viability of AβO treated cells was significantly decreased (to 72.5 ± 5.3%) compared with the nontreated control (p < 0.05). Pretreatment with compound 1 or 2 conferred cytoprotection to the AβO-treated cells against AβO-induced neurotoxicity (Figure 2A), while the scrambled AβO peptide showed no neurotoxicity. To confirm these data, similar results were obtained using the trypan blue exclusion assay (Figure 3).
Figure 2.

Neuroprotective effect of compounds 1 and 2 in RA-BDNF-SH-SY5Y cells treated with oligomeric Aβ1–42 (2.5 μM). (A) Cell viability was determined by a mitochondrial enzyme dependent reaction of WST-1 reagent. Results were obtained from three independent experiments and expressed as the mean ± SD. Cell viability was expressed as the percentage of untreated control. *p < 0.05, compared with the control group. (B) Effects of test compounds 1 and 2 on mitochondrial membrane potential (Δψm) in differentiated SH-SY5Y cells treated with Aβ1–42 (2.5 μM) as measured by JC-1 ratiometric fluorescence probe. Red (λex 550, λem 600 nm) and green (λex 485, λem 527 nm) fluorescence were measured. After background subtraction, the ratio of red to green fluorescence was calculated as a measure of mitochondrial membrane potential. Values represent the mean ± SD of three independent experiments. *p < 0.05, compared with control. Depolarization with FCCP was used as a positive control. (C) Effect of compounds 1 and 2 on Aβ-induced ROS in RA-BDNF-SH-SY5Y cells treated with oligomeric Aβ1–42 (2.5 μM) for 12 h following drug preincubation. ROS formation was detected by using the oxidant sensitive probe DCFH-DA. *p < 0.01, compared with the control group. (D) Total ATP level in RA-BDNF differentiated SH-SY5Y cells treated with or without oligomeric Aβ1–42 (2.5 μM) for 48 h following drug preincubation. Results were obtained from three independent experiments and are expressed as the mean ± SD. Total ATP level was expressed as the percentage of untreated control. *p < 0.05, compared with the control group.
Figure 3.
Neuroprotective effect of compounds 1 and 2 in RA-BDNF-SH-SY5Y cells treated with oligomeric Aβ1–42 (2.5 μM). Cell viability was determined by trypan blue exclusion assay. Results were obtained from three independent experiments and expressed as the percentage of untreated control. *p < 0.05, compared with the control group.
Compounds 1 and 2 Protect Mitochondrial Membrane Potential (Δψm) in a Neuronal Cell Model
The protective effect of compounds 1 and 2 on AβO-induced changes in mitochondrial membrane potential was assessed using the 5,5′,6,6′-tetrachloro-1,1′,3,3′-tetraethylbenzimidazole carbocyanide iodide (JC-1) probe. Mitochondrial depolarization is indicated by a decrease in the red/green fluorescence intensity ratio. The JC-1 ratio markedly decreased in RA-BDNF-differentiated SH-SY5Y cells treated with AβO for 24 h compared to control (p < 0.05; Figure 2B). Treatment with compound 1 or 2 alone had no effect on mitochondrial function (Figure 2B), but substantially protected mitochondrial membrane potential from the effects of treatment with AβO. Mitochondrial depolarization caused by the addition of the mitochondrial uncoupler FCCP to SH-SY5Y cells was included to confirm the sensitivity and specificity of JC-1 staining (Figure 2B).
Compounds 1 and 2 Suppress AβO-Induced Reactive Oxygen Species (ROS) in a Neuronal Cell Model
To determine whether compounds 1 and 2 confer cytoprotection by suppressing ROS, the intracellular ROS level was measured using the DCFH-DA fluorescent probe. Treatment of differentiated SH-SY5Y cells with AβO induced a significant increase in the level of ROS 12 h after treatment (195.8% ± 17.1, p = <0.05, Figure 2C), while the scrambled AβO peptide had no effect on ROS levels (Figure 2C). Compounds 1 and 2 completely suppressed the AβO-induced increase in ROS levels at both 1 and 5 μM concentrations (Figure 2C).
Compounds 1 and 2 Support Intracellular ATP Levels Following Oligomeric AβO Treatment in a Neuronal Cell Model
The protective effects of compounds 1 and 2 on mitochondrial function were studied further by measuring relative ATP levels. A significant decline in ATP levels in differentiated SH-SY5Y cells was observed after a 24 h treatment with AβO (Figure 2D). Pretreatment with 1 and 5 μM compound 1 or 2 prevented significant ATP depletion under AβO-induced stress (Figure 2D). Interestingly, ATP levels actually appeared to be increased in differentiated SH-5YSY cells treated with compound 1 in the absence of AβO, as has been noted previously in coenzyme Q10-deficient human lymphocytes and FRDA lymphocytes23,24 and maintained to nearly the same extent as untreated SH-SY5Y cells even in the presence of AβO. In comparison, there was clearly no enhancement of ATP levels for compound 2 (Figure 2D), although this compound also maintained ATP levels in the presence of AβO.
The involvement of the MRQs in maintaining mitochondrial electron transport chain function was further probed by measuring the effect of AβO on complexes I and IV, and the ability of 1 to blunt these effects of AβO. As shown in Figure 4, 1 μM Aβ1–42 reduced the activities of both mtiochondrial complexes. However, pretreatment with 1 μM 1 prevented the loss of activity occasioned by treatment with AβO.
Figure 4.
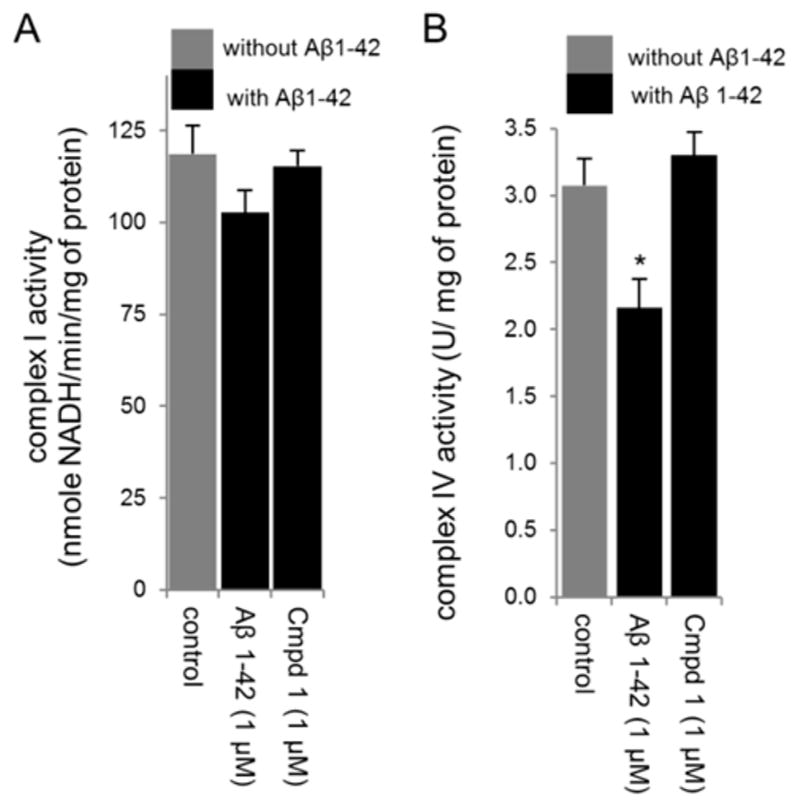
Effect of compound 1 on mitochondrial enzyme activities in mitochondrial extracts prepared from RA-BDNF-SH-SY5Y cells treated with 1 μM oligomeric Aβ1–42. Compound 1 pretreatment attenuated the effect of Aβ1–42 in reducing complex I and IV activities. (A) Results are expressed as nmol of NADH oxidized/min per mg of mitochondrial protein for complex I activity and represented as ± SD for three independent experiments. (B) Complex IV activity is expressed as U/mg of mitochondrial protein and represented as ± SD for three independent experiments. *p < 0.01, compared with the control group.
Expression Profiling of 84 Epigenetic Transcripts Indicates Similarities between Alzheimer’s Brain Middle Temporal Gyrus (MTG) and an Oligomeric Aβ-Treated Neuronal Cell Model
In order to determine whether a cell culture model treated with AβO showed epigenetic chromatin remodeling profiles similar to those observed in human Alzheimer’s disease brain, human epigenetic chromatin modifying PCR arrays were utilized.
Human Brain
The heat map from the PCR arrays shows the magnitude of expression in control vs Alzheimer’s disease brain (Supporting Information Figure S1). Of the 84 epigenetic chromatin modifying transcripts (Supporting Information Figure S2), 93% were down-regulated and 7% up-regulated in Alzheimer’s disease brain compared to controls. Of the differentially expressed transcripts, 17 were found to be significant (p = 0.05 or less in Alzheimer’s disease brain vs control) (Table 1), with 14 trending toward significance (0.05 < 0.09, data not shown). Of all the transcripts, KAT6B (alternatively known as MYST4) had the most significant (p < 0.00002) and largest fold change (+8.95) (Table 1). Further analysis of the KAT6B gene from a collaborative 2.0 microarray, using 17 Alzheimer’s and control cases, replicated our findings that KAT6B is significantly (p < 0.001) up-regulated (by 26% compared to control samples, Supporting Information Figure S3).
Table 1.
Significant, Differentially Expressed Transcripts between Alzheimer’s and Controlsa
| symbol | gene name | fold change | p-value |
|---|---|---|---|
| CDYL | chromodomain protein on Y chromosome-linked | −2.09 | 0.04 |
| HDAC9 | histone deacetylase 9 | −3.01 | 0.04 |
| KDM5C | lysine-specific demethylase 5C | −2.28 | <0.01 |
| KAT2A | K(lysine) acetyltransferase 2A | −2.24 | 0.02 |
| MLL3 | myeloid/lymphoid or mixed-lineage leukemia 3 | −2.53 | 0.02 |
| MLL5 | myeloid/lymphoid or mixed-lineage leukemia 5 | −2.28 | 0.04 |
| KAT7 | histone acetyltransferase MYST2 | −3.33 | 0.02 |
| KAT6B | lysine acetyltransferase 6B | 8.95 | <0.01 |
| PRMT3 | protein arginine N-metyltransferase 3 | −3.51 | 0.03 |
| PRMT5 | protein arginine N-metyltransferase 5 | −3.33 | <0.01 |
| SETD2 | set domain-containing protein 2 | −3.01 | 0.03 |
| SETD3 | set domain-containing protein 3 | −2.85 | 0.02 |
| SETD5 | set domain-containing protein 5 | −1.95 | 0.03 |
| SETDB2 | set domain protein. bifurcated, 2 | −2.28 | 0.04 |
| UBE2B | ubiquitin-conjugating enzyme E2B | −3.90 | 0.03 |
| USP22 | ubiquitin-specific protease 22 | −2.48 | 0.04 |
| WHSC1 | WHS candidate I gene | −2.32 | 0.02 |
Data are expressed as mean fold change ± SD, p < 0.05.
Human Neuronal Cell Line
The fold changes for oligomeric Aβ-treated vs vehicle SH-SY5Y cells (Figure 5A) and Alzheimer’s disease vs ND (Figure 5B) are shown. In vehicle vs AβO treated cultures, eight transcripts were significantly different with six trending toward significance (0.05 < 0.09) (data not shown). Although more chromatin modifying genes were significantly affected in brain samples, AβO treated SH-SY5Y cells showed similar patterns of expression in 85% of the transcripts, which were reduced compared to vehicle control (Figure 5A vs B). Overall, the data show that there is a significant correlation between AβO treated neurons and Alzheimer’s disease brain (r = 0.35, p = 0.001). The specific genes assessed are shown in Figure S2 in the Supporting Information.
Figure 5.
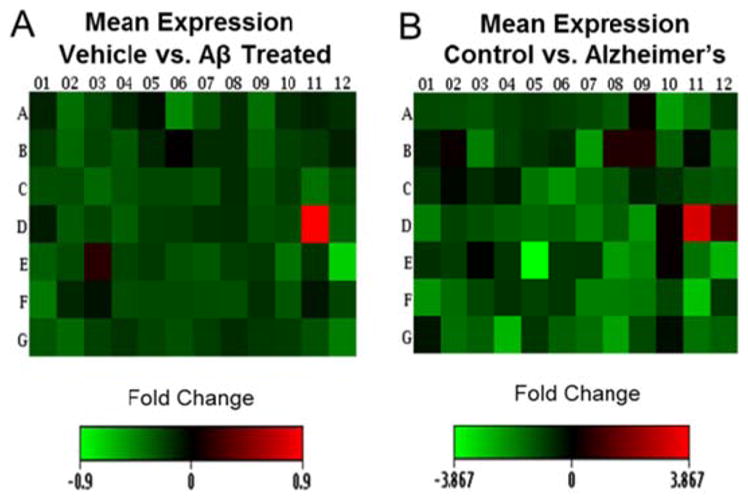
Heat maps, which show the mean fold change of oligomeric Aβ-treated SH-SY5Y cells vs vehicle (A) and Alzheimer’s disease brain vs control brain (B). Both groups show similar patterns of expression (down regulation) for 70 of the 84 epigenetic transcripts analyzed. Overall, the data show that there is a significant correlation between Aβ-treated neuronal cells and Alzheimer’s disease brain (r = 0.35, p = 0.001).
Pretreatment with Compounds 1 and 2 Protects Chromatin Modifying Transcripts from AβO-Induced Alteration
Having established a model for Alzheimer’s disease with respect to the expression of genes for epigenetic modifying enzymes, we asked whether the protective effects of compounds 1 and 2 extended to the protection of epigenetic transcripts from AβO-induced changes. Heat maps, representing magnitude of expression (fold change), indicated that treatment with 1 and 2 protected the cultured cells from AβO-induced alterations of epigenetic transcripts (Figure 6). Both compound 1 (Figure 6A) and compound 2 (Figure 6C) were protective against AβO-induced changes, but compound 1 was found to be more effective in this regard (Figure 6A). Scatter plots comparing normalized expression of all genes shows that cultures pretreated with compound 1 prior to AβO treatment maintained similar patterns of expression as the control group, indicated by the overlapping points on the central line (Figure 6B). Compound 2 (Figure 6D) also showed an upshift in expression for the majority of the transcripts compared to AβO-treated cells, but failed to overlap on the central line to the same extent observed for compound 1. Collectively, the foregoing data show that both compounds protect cultured cells from AβO-induced alterations, but that compound 1 is more “protective” than 2, at least as regards its effect on the expression of genes for epigenetic chromatin modifying enzymes. The specific genes assessed are shown in Figure S2 in the Supporting Information.
Figure 6.
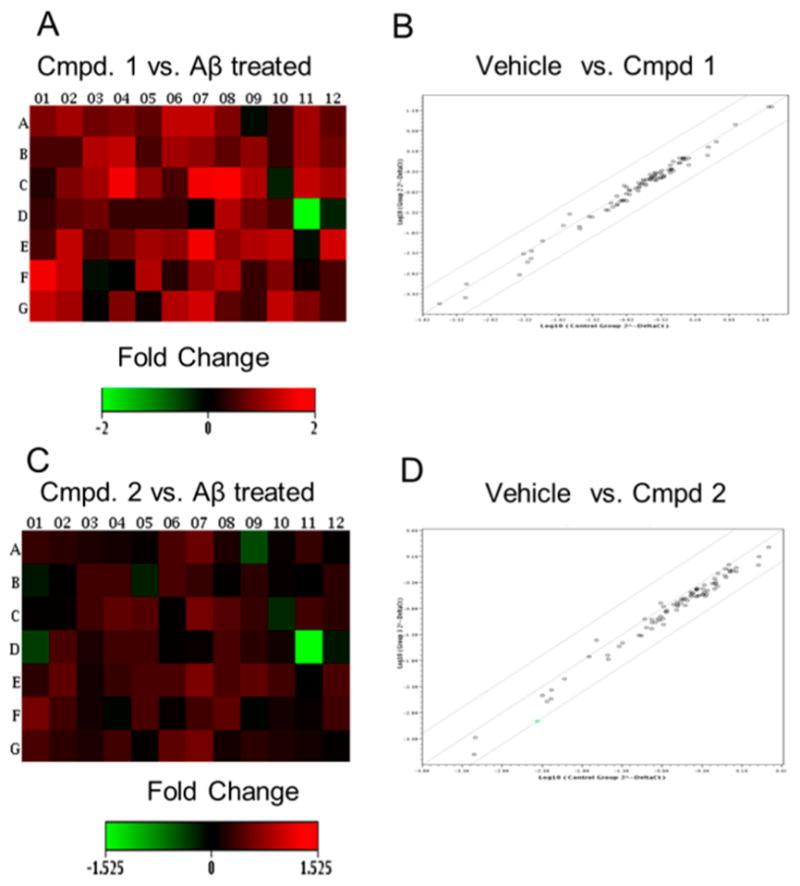
Heat maps showing the fold change following pretreatment of SH-SY5Y cells with compounds 1 (A) and 2 (C). These maps showed that both compounds were able to protect against AβO disturbances (see Figure 5). Panels (B) and (D) are scatter plots comparing the control group with cultures pretreated with compounds 1 and 2, respectively, prior to AβO treatment.
AβO Treatment Induces Open Chromatin State in the Regulatory Region of Histone Acetyltransferase Gene KAT6B, and Compound 1 Prevents These AβO-Induced Changes
In order to determine whether the observed changes in expression coincided with changes in chromatin structure, some of the same cultured cells used for the expression array studies were subjected to in situ chromatin digestion, followed by genomic DNA purification, and real-time PCR. Figure 7C shows the relative openness of the promoter region of histone lysine acetyltransferase (KAT6B) gene in differentiated SH-SY5Y cells following treatment with AβO, or following no treatment (vehicle), or pretreatment with compound 1 followed by AβO treatment. Relative openness was determined using an algorithm which utilized a normalizing control and a reference gene. The control gene, or universally open gene (GAPDH, Figure 7A), showed equal openness under all three experimental conditions. The reference gene, or epigenetically silenced gene (RHO, Figure 7B), showed a relatively closed position under all three experimental conditions. Undigested samples, which received no chromatin digestion buffer (internal control), showed significantly lower CT values than the digested samples (p = 0.0002). Collectively, these data show that the KAT6B gene is 3.5% more open in AβO-treated samples than vehicle (Figure 7C and D). Pretreatment with compound 1 prevented AβO-induced changes in chromatin structure (Figure 7D). These data show that changes in gene expression observed in the array are correlated, at least in part, with the degree of openness in the structure of chromatin, and that these changes can be ameliorated by compound 1. It is interesting that treatment of differentiated SH-SY5Y cells with the mitochondrial poison rotenone also resulted in an increase in expression of the KAT6B gene (Supporting Information Figure S4), consistent with the thesis that the effects of AβO and MRQs 1 and 2 on the epigenome may be mediated at the level of the mitochondria.
Figure 7.

Chromatin analysis. The same cells used in array studies were subjected to in situ chromatin digestion, followed by genomic DNA purification, and QPCR. Chromatin analysis kit was used to show the relative openness of the promoter region of histone acetyltransferase gene (KAT6B). To determine percent openness, a ubiquitously open gene GAPDH and a reference gene RHO (epigenetically silenced) were used as normalizing control genes (A and B, respectively). Panel (C) shows the relative openness of KAT6B in the promoter region of differentiated SH-SY5Y cells treated with AβO (pink, Aβ digested), no treatment (blue, vehicle), or compound 1 pretreatment followed by AβO treatment (cyan, compound 1/Aβ). (D) Bar graph generated from QPCR curves indicates that AβO treatment induced a more permissive chromatin state compared to controls, an effect which was prevented by compound 1.
Compounds 1 and 2 Increased Synapse Number and Overall Neuronal Connectivity
Representative photomicrographs of differentiated SH-SY5Y cells were taken to show the effects of compound 1 or 2 on the neuronal connectivity compared to vehicle control and AβO-treated cells (Figure 8A). Both compounds appeared to increase neuronal processes and connectivity (Figure 8A). It may be noted, however, that we cannot exclude the possibility that the relative paucity of cells following Aβ treatment may also reflect loss of cell adherence or decreased mitosis. Western blot analysis of the presynaptic marker synaptophysin showed the protective effects of both compounds compared to cells treated with Aβ alone (Figure 9B). Western blots also showed an overall increase in synaptophysin (SYP) with both compounds compared to vehicle control. At least as judged visually, compound 1 appeared to be more effective in increasing the level of synaptophysin than compound 2 (Figure 8B).
Figure 8.

Compounds 1 and 2 increased synapse number and overall neuronal connectivity. (A) Representative photomicrographs of differentiated SH-SY5Y cells (vehicle), differentiated SH-SY5Y cells treated with 1 μM oligomeric Aβ for 24 h (Aβ treated), differentiated SH-SY5Y cells pretreated with 1 μM compound 1 or 2 for 12 h followed by treatment with 1 μM oligomeric Aβ for 24 h (1 or 2, Aβ treated). (B) Western blot analysis of presynaptic marker synaptophysin showed the protective effects of both compounds compared to cells treated with Aβ alone. Lane 1, vehicle treatment; lane 2, treatment with 2 + AβO; lane 3, treatment with 1 + AβO; lane 4, treatment with AβO alone. Western blots also showed an overall increase in synaptophysin following treatments with both 1 and 2 compared to vehicle control.
DISCUSSION
Amyloid beta peptide has been shown to induce oxidative stress and neurotoxicity in vitro and in vivo and, consequently, has been implicated in the pathogenesis of Alzheimer’s disease. 9,10,27,28 The mitochondria themselves may be a source of ROS that amplify the mitochondrial dysfunction occurring in this disease.29 Accordingly, mitochondrial dysfunction and disruptions in energy metabolism have been suggested to be a prominent feature of Alzheimer’s disease.10,27–31
We have recently described compounds modeled after coenzyme Q10 which, in addition to mitochondrial electron transport, have been designed to mitigate the effects of oxidative stress in the mitochondrial disease Friedreich’s ataxia (FRDA), a disease which has also been suggested to be under epigenetic control.32,33 These compounds have been shown to suppress ROS and lipid peroxidation and appear to function catalytically.23,24 They also have been shown to maintain mitochondrial membrane potential in cultured FRDA lymphocytes under conditions of induced oxidative stress, and to confer strong cytoprotection to cultured lymphocytes derived from patients with a number of mitochondrial diseases.24 Compound 1 was found to be unusual among MRQ analogues in that it also augments ATP production in coenzyme Q10-deficient human lymphocytes and FRDA lymphocytes.23,24 Because they function in part by quenching radicals involved in oxidative stress, the compounds have been denoted multifunctional radical quenchers (MRQs).
In the present study, we have employed MRQ analogues, compounds 1 and 2, which have quite similar structures. Unsurprisingly, these two compounds also have rather similar properties as MRQ analogues.23 In previous studies, we have demonstrated that MRQs of this type suppress both lipid peroxidation and reactive oxygen species in cells from which glutathione has been depleted by treatment either with the electrophile diethyl maleate, or the glutathione biosynthesis inhibitor buthionine sulfoxime.34 Because the concentrations of MRQs required to mediate these effects are orders of magnitude lower than the normal cellular (5–10 mM) concentration of glutathione which normally suppress these consequences of oxidative stress, it is logical to think that a catalytic mechanism is involved in the case of the MRQs, and a working model for this putative catalytic effect has been suggested (Supporting Information Figure S5).34 This model involves the coordinated quenching of lipid radicals (a reductive process) and the oxidative conversion of superoxide to oxygen. MRQs have also been shown to maintain mitochondrial membrane potential and confer cytoprotection to cells placed under induced oxidative stress, a property shared by compounds 1 and 2.23 However, a critical distinction is that only compound 1 was found to augment ATP production,23 suggesting that the greater effect of compound 1 in conferring protection against AβO-induced effects on the epigenome documented in this study may also be attributed to the ability of compound 1 to augment cellular ATP levels in the presence of AβO.
These similarities and differences were readily apparent in the current study as well. As shown in Figures 2 and 3, at 1 and 5 μM concentrations, both MRQs were effective in suppressing ROS, maintaining mitochondrial membrane potential and conferring cytoprotection to differentiated SH-SY5Y cells treated with 2.5 μM AβO. However, while both compounds prevented the depletion of ATP in AβO-treated SH-SY5Y cells, only compound 1 may actually have augmented ATP production, as it has been shown to do in other cell lines.23 That 1 and 2 actually mediate their effects within the mitochondrial respiratory chain was underscored by the ability of compound 1 to blunt the direct negative effects reported for AβO on the activities of mitochondrial complexes I and IV.15,17–19
Of particular interest in the present study were the possible effects of compounds 1 and 2 on the changes in expression of genes for epigenetic modifying enzymes induced by treatment of SH-SY5Y cells with AβO. As shown in Figure 6, both compounds mitigated the effects of AβO on gene expression, but compound 1 was more effective. Both compounds also increased neuronal processes, compared to vehicle control and AβO-treated cells (Figure 8). While it was difficult to distinguish between the effectiveness of compounds 1 and 2 in this assay, 1 was more effective in increasing the levels of the presynaptic marker synaptophysin (Figure 8B). Compound 1 was also shown to prevent the AβO-induced chromatin condensation in histone acetyltransferase gene KAT6B (Figure 7).
Gene expression in the Alzheimer’s disease brain has been shown to be altered in a wide variety of studies,35–39 including those involving single or small numbers of identified neurons.35,39,40 In these studies, gene expression of multiple systems has been shown to be affected in Alzheimer’s disease, including energy metabolism.16 An early step in gene expression is modification of chromatin structure, which is regulated epigenetically.41 This promotes chromatin structures that are either permissive or repressive for transcription. We have provided evidence of changes in the availability of epigenetic chromatin modifying enzymes in Alzheimer’s disease compared to age matched controls using a PCR array. The reversal of diminished gene expression was shown to be enhanced when ATP production was augmented. We hypothesize that mitochondrial function directly affects epigenetic mechanisms through its effects on the ability to meet the energetic demands of the dynamic epigenome, leading to consequences for regulation of chromatin structure.
The relevance of the foregoing cellular studies in AβO-treated differentiated SH-SY5Y cells to Alzheimer’s disease brain was investigated at the level of regulation of a panel of 84 genes for epigenetic modifying enzymes. Our finding (Figures 5 and S1) that Alzheimer’s disease brain and AβO treated differentiated SH-SY5Y neuroblastoma cells displayed strong similarities in the transcriptome of epigenetic modifying genes (identified in Figure S2) provides an intriguing model system for studying selected biochemical parameters which are altered in the disease. Additionally, it seems possible that the cultured neuroblastoma cells may be employed for initial assessment of the effects of compounds targeting the mitochondria that have potential utility for therapeutic intervention in Alzheimer’s disease. In addition to alterations in expression for numerous epigenetic modifying enzymes it was found that AβO treatment induced substantial changes in the chromatin structure of a selected index epigenetic enzyme, KAT6B, and that this effect was reversed by MRQs 1 and 2. Compound 1, which increased ATP levels in the cells even in the presence of AβO, was found to be more effective in this regard than compound 2. This is consistent with the earlier observations that epigenetic regulation of chromatin structure requires energy in the form of ATP,42 which relies heavily on mitochondrial function,43 known to be altered in Alzheimer’s disease.44
We infer from the foregoing experiments that the changes in expression of genes for epigenetic modifying enzymes in the presence of AβO involve both reduced ATP levels and increased oxidative stress. The study described here has the potential to bring to light underdeveloped avenues of Alzheimer’s disease research which potentially regulate synaptic function, particularly (i) bioenergetics and (ii) the epigenome. Understanding the underlying mechanisms that affect synaptic function could lead to possible new targets for both diagnosis and therapeutic intervention, such as with the novel MRQ analogues employed in this study.
METHODS
Cell Cultures and Differentiation
For in vitro studies, human SH-SY5Y neuroblastoma cell line (CRL 2266, ATCC, Manassas, VA) was resurrected and maintained following ATCC guidelines. Cells were maintained in a humidified 37 °C incubator with 5% CO2, and were supplied with complete DMEM (500 mL of DMEM with high glucose, minus phenol red) (Invitrogen-Gibco), 50 mL fetal bovine serum (Gemini Bio-Products; West Sacramento, CA), 10 mL of HEPES (Irvine Scientific, Santa Ana, CA), 5 mL of sodium pyruvate (Mediatech Cellgro), 5 mL penicillin/streptomycin (Invitrogen-Gibco), and 0.5 mL of gentamycin (Irvine Scientific) every 3 days until experiments were performed (approximately 1 week after initial plating).
Differentiation
Cells were differentiated following a published protocol.45 Briefly, once cells were grown to confluence, they were trypsinized (Invitrogen) and subcultured into 6-well plates (Corning Costar, Lowell, MA), coated with 10 μg/mL poly-L-lysine (Sigma Chemicals), and 10 μg/mL collagen IV from human placenta (Sigma Chemicals). Cells were plated at a density of 1.6 × 10⁶ cells/well in DMEM complete media. At 24 h after seeding, cells were treated with 10 μM all-trans retinoic acid (RA) (Sigma Chemicals) and 2% fetal bovine serum (FBS) for 3 days, followed by 10 μM RA in 0.5% FBS for 3 more days, and then followed by 50 ng/mL of brain derived neurotrophic factor (BDNF) (Peprotech, Rocky Hill, NJ) in 0.5% FBS for 3 more days. Media was removed, and fresh media containing 50 ng/mL BDNF and 0.5% FBS was applied for 3 more days. After 12 days, the SH-SY5Y cells were completely differentiated.
Oligomeric Amyloid Beta Peptide Preparations
Synthetic human Aβ1–42 and scrambled peptide Aβ42–1 were purchased from AnaSpec (San Jose, CA). Oligomeric Aβ1–42 was prepared as described previously.46,47 Briefly, amyloid beta peptide was dissolved in cold 100% hexafluoro-2-propanol (HFIP) (Sigma-Aldrich) at a concentration of 1 mM and incubated at room temperature for 1 h to eliminate pre-existing structural conformations in the lyophilized Aβ1–42. The HFIP was evaporated under a nitrogen flow, and residual HFIP was removed under diminished pressure using a Speed Vac. The resulting Aβ1–42 monomer film was stored at −80 °C until further manipulation. Immediately prior to use, the HFIP-treated monomers were resuspended to a concentration of 5 mM in anhydrous dimethyl sulfoxide. For oligomerization, the stock solution was subsequently diluted to 100 μM with cold Ham’s F12 phenol-free medium without glutamine (Life Technologies), immediately vortexed for 30 s, and incubated at 4 °C for 24 h. The preparation was centrifuged at 14 000g for 10 min at 4 °C to remove insoluble aggregates and fibrillar material, and the supernatant containing soluble oligomers was transferred to clean, siliconized 1.5 mL centrifugation tubes and stored at 4 °C. Scrambled Aβ42–1 peptide treated in exactly the same manner was used in control experiments. To obtain fibrils, the peptide was resuspended in 10 mM HCl at a final concentration of 100 μM and incubated at 37 °C for 24 h. Aβ1–42 peptide content was determined by bicinchoninic acid assay (micro-BCA kit, Pierce) using BSA as reference. Oligomeric Aβ1–42 was employed at concentrations ranging from 1–2.5 μM, reflecting concentrations likely to be involved in the pathophysiology of Alzheimer’s disease.
Dot Blot Analysis
The oligomeric state of amyloid beta preparations was confirmed by dot blot analysis using amyloid oligomer-specific polyclonal antibody A11 (AHB0052, Invitrogen).48 Briefly, 5 μL of the Aβ1–42 oligomeric preparation was spotted onto nitrocellulose membrane (Bio-Rad Laboratories) and allowed to air-dry for 1 h. The membrane was blocked in 10% nonfat dry milk in Tris-buffer saline (TBST) containing 0.01% Tween 20 at 4 °C for 1 h. After three 5 min TBST washes, the membranes were probed with conformation specific primary anti-oligomer antibody A11 (Invitrogen: 1:2000) for 1 h at room temperature in 5% nonfat dry milk in TBST containing 0.01% Tween 20. Following three 5 min washes with TBST, the primary immune-reaction blots were incubated with horseradish peroxidase-linked secondary antirabbit antibody IgGs (1:10 000, Sigma, in 5% nonfat dry milk in TBST) at room temperature for 1 h. Then the membrane was washed three times for 5 min with TBST, rinsed with deionized H2O, and developed with enhanced chemiluminescence (ECL) (BioRad Chemi-Doc) using West Pico Chemiluminescent Substrate (Pierce Biotechnology). Aβ1–42 fibrils were used as a negative control for A11 immunoreactivity.
Western Blot Analysis
For Western blots, a total of 5 μg of total protein from MTG was combined with 2× Laemmli sample buffer for separation by SDS-PAGE, and then transferred to a PVDF membrane (Bio-Rad). Membranes were blocked using 5% nonfat dry milk and probed with primary antibody. After incubation with primary antibody, membranes were washed, incubated with secondary antibody, washed again, developed with enhanced chemiluminescence (ECL) (BioRad Chemi-Doc) using West Pico Chemiluminescent Substrate (Pierce Biotechnology), imaged on an Alpha Ease detection system, and analyzed using AlphaEaseFC software (Alpha Innotech).
CoQ10 Analogues
Compounds 1 and 2 were synthesized starting from commercially available 2-amino-4-methoxy-6-methylpyrimidine (Sigma Chemicals) as described.23 The two compounds were employed at 1 and 5 μM concentrations, as these had been found to fall well within the dynamic range of concentrations in comparable assays studied in our earlier report.23
Cell Viability and Cytotoxicity
Cell viability/cytotoxicity was determined by a mitochondrial enzyme dependent reaction of WST-1 (Roche Diagnostics) and trypan blue exclusion assay. Briefly, SH-SY5Y cells were plated in a 6-well plate and differentiated as described above. Wells were treated for 12 h with compound 1 or 2 at 1 and 5 μM concentrations, prior to treatment with 2.5 μM AβO for 48 h. Color intensity was measured at 450 nm using a SpectraMax M5 microplate reader (Molecular Devices, Sunnyvale, CA). Results are expressed as percentage of viable cells relative to untreated control after subtracting background. Results were obtained from three independent experiments and expressed as the mean ± SD (Figure 2A). Trypan blue exclusion analysis was performed using 0.4% trypan blue solution. Trypan blue positive and negative cells were counted using the Countess Automated Cell Counter (Invitrogen, Carlsbad, CA). Results were obtained from three independent experiments and expressed as the mean ± SD. Cell viability was expressed as the percentage of untreated control (Figure 3).
Measurement of Reactive Oxygen Species (ROS)
Intracellular ROS in AβO-treated differentiated SH-SY5Y cells, with or without compound 1 or 2, was measured using 2′,7′-dichlorodihydrofluorescein diacetate (DCFH-DA, Invitrogen). Briefly, after differentiation (vide supra) and experimental manipulation (wells were treated for 12 h with 1 or 5 μM 1 or 2 before treatment with 2.5 μM AβO for 12 h), the media was removed from each well and 100 μL of 10 μM DCFH-DA in media was added. The plates were placed in a 37 °C incubator for 20 min, then each well was washed with 1 × PBS, and the resulting reaction was assayed using a fluorescence microplate reader (Biotek Synergy HT, VT) set to 37 °C. Measurements were made using a 485/20 nm excitation and 528/20 nm emission filter pair and a PMT sensitivity setting of 55. Results were obtained from three independent experiments and expressed as the mean ± SD.
Measurement of Mitochondrial Membrane Potential (Δψm)
RA-BDNF-differentiated SH-SY5Y cells were exposed to two doses (1 and 5 μM) of 1 or 2 for 12 h, before treatment with 2.5 μM AβO for 24 h. Changes in mitochondrial membrane potential were monitored using a voltage-sensitive dye, 5,5′,6,6′-tetrachloro-1,1′,3,3′-tetraethylbenzimidazole carbocyanide iodide (JC-1). Membrane potential Δψm was assessed using a JC-1 mitochondrial membrane potential detection kit (Biotium Inc. Hayward, CA) following the manufacturer’s instructions. Briefly, plates were incubated at 37 °C for 30 min after the addition of 100 μL of JC-1 reagent into the wells. Cells were washed with PBS and then PBS was added in an amount sufficient to cover the cell layer. In the cytosol, the monomeric form of this dye fluoresces green (excitation at 485 nm, emission at 527 nm), whereas within the mitochondrial matrix highly concentrated JC-1 forms aggregates that fluoresce red (excitation at 550 nm, emission at 600 nm). JC-1 monomers and aggregates were both detectable using a Soft Max Pro fluorescence plate reader (Molecular Devices, Sunnyvale, CA). The ratio of red to green fluorescence in cells undergoing apoptosis was decreased compared with healthy cells. Mitochondrial membrane potential was expressed as the ratio of emission at 600 nm to that at 527 nm. The ratio of red to green fluorescence, an indicator for membrane potential, was determined. The ratio was decreased in dead cells, and in cells undergoing apoptosis, in comparison with healthy cells. As a positive control to check the loss of Δψm, cells were treated with 5 μM carbonyl cyanide p-trifluoromethoxyphenylhydrazone (FCCP) at 37 °C for 5 min and assessed identically for Δψm where a loss of the Δψm was observed. Results were obtained from three independent experiments and expressed as the mean ± SD.
Intracellular ATP Content
ATP was measured using an ATP bioluminescence assay kit (ViaLight-Plus ATP monitoring reagent, Lonza) according to the manufacturer’s instructions. Briefly, SH-SY5Y cells were plated in a 6-well plate at a density of 5 × 10⁵ cells/well and differentiated as described above. Wells were treated overnight with compound 1 or 2 (1 and 5 μM) before treatment with 2.5 μM oligomeric AβO. The plates were incubated at 37 °C in 5% CO2 for an additional 24 h before the measurement of intracellular ATP content. Cells were washed in ice-cold PBS, harvested and lysed immediately. After removal of cell debris by centrifugation (12 000g, 5 min, 4 °C), the ATP concentration in the resulting supernatant was determined by luciferase bioluminescence assay using a luminator (Clarity luminescence microplate reader). A standard curve was generated using solutions having known ATP concentrations. ATP levels were normalized to protein concentration and were expressed as nmoles of ATP per milligram of protein.
Isolation of Mitochondria
Mitochondrial fractions were isolated from SH-SY5Y cells by centrifugation, and kept at 4 °C, as described previously with some modifications.49 Briefly, cells were washed with ice-cold phosphate buffer saline (PBS), harvested and pooled for each sample group. The following steps were performed on ice. The resulting pellet was resuspended in 500 μL of lysis buffer (10 mM Tris-HCl, pH 7.6, containing 75 mM NaCl, 1 mM EDTA 0.05% digitonin, 1 mM Pefabloc, a protease inhibitor cocktail) for 10 min at 4 °C. The cell lysate suspension was disrupted on ice by 10 rounds of aspiration and ejection through a 25-gauge needle followed by a 30-gauge needle. The homogenates were spun at 600g for 10 min at 4 °C followed by a further 5 min centrifugation of the resuspended pellet in lysis buffer. The resulting supernatants were combined and centrifuged at 20 000g for 15 min at 4 °C to pellet mitochondria. The final mitochondrial pellet was resuspended in 500 μL of 10 mM Tris-HCl, 250 mM sucrose buffer, pH 7.4 for determining the activities of complex I and cytochrome c oxidase (complex IV). Mitochondrial protein determinations were performed on diluted samples with the bicinchoninic acid assay (micro-BCA kit, Pierce) using BSA as reference. Samples were adjusted to the same protein concentration to reduce variability between different samples.
Complex I Activity
Complex I (NADH: ubiquinone oxidoreductase) activity was determined in homogenates of isolated mitochondria as rotenone-sensitive NADH dehydrogenase-mediated reduction of coenzyme Q1.50 The isolated mitochondria were subject to freeze–thaw cycles to obtain submitochondrial particles. Ten micrograms of mitochondria homogenate was combined with a complex I buffer (50 mM phosphate buffer, pH 7.4, containing 0.25 M sucrose, 1 mM MgCl2, 2 μM antimycin A, 50 μM of coenzyme Q1 and 2 mM KCN). Each reaction was initiated by the addition of 50 μM NADH, and the enzymatic activity was assayed at 30 °C and monitored spectrophotometrically (340 nm, ε 6.22 mM−1 cm−1). The initial rates were calculated from the linear portion of the traces. Rotenone-insensitive oxidoreductase activity in the presence of 2 μM rotenone was subtracted (no physiological electron transfer). The enzyme activity was expressed in nmoles per minute per milligram protein.
Complex IV Activity (Cytochrome Oxidase Activity)
Cytochrome oxidase activity was measured spectrophotometrically in mitochondria isolated from RA-BDNF differentiated SH-SY5Y cells using a Sigma Kit (CYTOCOX1) (Sigma-Aldrich) following the manufacturer’s instructions. Briefly, 2 μg of mitochondrial proteins was added to 1.1 mL of a reaction solution containing, 10 mM Tris-HCl, pH 7.0, 120 mM KCl and 0.025% dodecylmaltoside. The addition of 50 μL of 0.22 mM cytochrome c fully reduced by the use of 0.5 mM DTT was used to initiate the reaction. The enzymatic activity was assessed by following the oxidation of reduced cytochrome c at 550 nm at 25 °C. Complex IV activity was calculated as KCN-sensitive cytochrome oxidase activity. The difference between the extinction coefficient of ferrocytochrome c (oxidized) and ferricytochrome c (reduced) at 550 nm (ΔεmM of 21.84) was used to calculate complex IV activity. One unit of complex IV activity will oxidize 1.0 μmol of ferricytochrome c per minute at pH 7.0 at 25 °C.
Human Subjects
Samples of human middle temporal gyrus (MTG) were secured from Alzheimer’s disease and ND brains obtained at autopsy at the Banner Sun Health Research Institute Tissue Bank. The cognitive status of all cases was evaluated antemortem by board-certified neurologists, and post-mortem by a board-certified neuropathologist, resulting in a consensus diagnosis using standard NIH Alzheimer’s disease Center criteria for Alzheimer’s disease or neurologically normal, nondemented elderly control (ND). The Alzheimer’s disease and ND groups were well matched for age (Alzheimer’s disease: 83 ± 3.3 years; ND: 80 ± 2.4 years), gender (3 females and 3 males in each group), and post-mortem interval (PMI) (Alzheimer’s disease: 3 h 1 min ±1 min; ND: 3 h 33 min ±2.2 min).
RNA Isolation
Isolation of total RNA (human brain tissue or SH-SY5Y cells) was carried out using RNeasy mini RNA isolation kit (Qiagen). All samples were loaded onto RNA 6000 Nano Chips (Agilent Technologies, Santa Clara, CA), where RNA integrity and concentration was assessed using the Bioanalyzer 2100 instrument (Agilent Technologies). Human brain samples and cultured cells used for RNA based experiments had to meet a minimum RIN number of 8.5 to be included in the experiments.
RT2 PCR Profiler Array and Analysis
One μg of RNA from each sample (human brain or SH-SY5Y cultured cells) was pipetted into a genomic DNA elimination mixture followed by the conversion of RNA to cDNA using the RT2 First Strand kit (SABiosciences, Frederick, MD). The cDNA was then added to the RT2 SYBR Green qPCR Master Mix (SABiosciences). Each sample was aliquoted into 96-well plates containing 84 epigenetic chromatin-modifying enzymes, five housekeeping genes, a genomic DNA control, three reverse transcription controls, and three controls lacking template. Samples were analyzed using ICycler IQ (BioRad) with the following cycling conditions: 10 min at 95 °C, 15 s at 95 °C, 1 min 60 °C for 40 cycles with a final infinite 4 °C hold. QPCR analysis: To analyze the PCR-array data, the manufacturer’s Web site (http://www.sabiosciences.com/pcrarraydataanalysis.php) is equipped with data analysis capabilities, and was followed using the manufacturer’s instructions. Briefly, for each PCR reaction, the online software calculated raw Ct values, normalized Ct values, a paired t test (p-value) and a fold change. Data normalization was based on correcting all raw Ct values for the geometric mean of all five housekeeping genes present on the array.
Chromatin Structure and Analysis
For analysis of chromatin structure at the regulatory region of KAT6B, an EpiQ Chromatin Analysis kit was used according to the manufacturer’s instructions. After select treatments, each individual experiment was treated with chromatin buffer (undigested) or chromatin buffer with nuclease (digested). Each treatment group contained three biological replicates, thus six wells per group/per condition were used. Quantification of DNA was done using Quant-iT PicoGreen Assay (Life Technologies). For quantitative PCR, 5 ng of DNA from each sample was amplified for 40 cycles on an iCycler iQ (Bio-Rad) using EpiQ SYBR Green Supermix (Bio-Rad). Primers for the gene of interest were designed flanking the promoter region near the transcription start site (TSS). Primers were designed using EpiQ Chromatin Analysis Kit Primer Design booklet. Primer optimization led to the following QPCR cycling protocol: step 1: 96 °C for 5 min; step 2: 96 °C for 15 s; step 3: 64 °C for 1 min; plate read, step 4: 86 °C for 30 s; step 5: go to step 2, 39 more times; step 6: melt curve, 70 to 96 °C, 0.2 °C increments, 5 s hold, and hold at 4 °C. KAT6B primers (Sigma Genosys) are in bolded lowercase letters, and the TSS in capital letters:
t-a-t-g-t-g-g-a-a-g-c-g-a-g-a-t-g-a-c-c-g-g-c-a-g-g-a-a-c-c-t-g-c-c-c-c-a-a-t-g-g-g-c-t-g-c-a-g-a-g-t-g-g-t-t-a-g-t-g-a-g-t-g-g-g-t-g-a-c-a-g-a-c-a-g-a-c-c-c-g-t-a-g-g-c-c-a-a-c-g-g-g-t-g-g-c-c-t-t-a-a-g-t-g-t-c-t-t-t-g-g-t-c-t-c-c-t-c-c-a-a-t-g-g-a-g-c-a-g-c-g-g-c-g-g-g-g-c-g-g-g-a-c-c-g-c-g-a-c-t-c-g-g-g-t-t-t-a-a-t-g-a-g-a-c-t-c-c-a-t-t-g-g-g-c-t-g-t-a-a-t-c-a-g-t-g-t-c-a-t-g-t-c-g-g-a-t-t-c-A-T-G-t-c-a-a-c-g-a-c-a-a-c-a-a-c-a-g-g-g-g-g-a-c-a-c-a-a-a-a-t-g-g-c-g-g-c-g-g-c-t-t-g-g-c-a-c-c-t-c-c-t-c-c-a-g-g-c-g-g-c-a-g-c-c-g-c-a-g-t-t-t-c-t-c-a-g-g-c-a-g-c-g-g-c-a-g-c-g-c-c-c-c-c-g-g-c-a-g-g-c-g-c-g-g-t-g-g-c-g-g-t-g-g-c-g-c-g-c-a-g-c-ca-g-g-t-c-t-g-t-c-a-c-c-c-a-c-c-c-c-g-c-g-c-g-t-t-c-c-c-a-g-g-g-g.
Chromatin Structure Analysis
QPCR data was imported into Excel according to the instructions and uploaded into EpiQ Chromatin Kit Data Analysis tool (http://www.bio-rad.com/en-us/sku/soft-litepiq-epiq-chromatin-kit-data-analysis-tool-pc). To determine the percent openness/closed, the results of individual experiments (Exp) were measured and compared with a reference gene RHO (epigenetically silenced) and a ubiquitously open control gene GAPDH, according to the following formula: 1 − (2ΔCt (RHO)/2ΔCt (Exp))/1 − (2ΔCt (RHO)/2ΔCt (GAPDH)).
Supplementary Material
Acknowledgments
Funding
The Brain and Body Donation Program is supported by the National Institute of Neurological Disorders and Stroke (U24 NS072026 National Brain and Tissue Resource for Parkinson’s Disease and Related Disorders), the National Institute on Aging (P30 AG19610 Arizona Alzheimer’s Disease Core Center), the Arizona Department of Health Services (Contract 211002, Arizona Alzheimer’s Research Center), the Arizona Biomedical Research Commission (Contracts 4001, 0011, 05-901, and 1001 to the Arizona Parkinson’s Disease Consortium), and grant ADH-080000 to D.F.M., and the Michael J. Fox Foundation for Parkinson’s Research. This work was supported by NIH RO1 AG036400 and AARC DHS Award FY 2012 to P.D.C. Studies at ASU were supported by grants from the Arizona Alzheimer’s Disease Core Center Pilot Program and the Friedreich’s Ataxia Research Alliance.
We are grateful to the Banner Sun Health Research Institute Brain and Body Donation Program of Sun City, Arizona for the provision of human brain samples. We also thank Jennifer Nolz and Elaine Delvaux for their technical help.
ABBREVIATIONS
- Aβ
amyloid beta peptide
- AβO
oligomeric amyloid beta peptide
- CoQ10
coenzyme Q10
- MRQs
multifunctional radical quenchers
- acetyl-CoA
acetyl-coenzyme A
- MTG
human middle temporal gyrus
- ND
nondemented elderly control
- RIN
RNA integrity number
- RA
all-trans retinoic acid
- BDNF
brain derived neurotrophic factor
- HFIP
hexafluoro-2-propanol
- TBST
Tris-buffer saline containing 0.01% Tween 20
- ROS
reactive oxygen species
- DCFH-DA
2′,7′-dichlorodihydrofluorescein diacetate
- PBS
phosphate buffered saline
- Δψm
mitochondrial inner membrane potential
- JC-1
5,5′,6,6′-tetrachloro-1,1′,3,3′-tetraethylbenzimidazole carbocyanide iodide
- FCCP
carbonyl cyanide 4-(trifluoromethoxy)-phenylhydrazone
- PMT
photomultiplier
- WST-1
2-(4-iodophenyl)-3-(nitrophenyl)-5-(2,4-disulphophenyl)-2H tetrazolium sodium salt
- TSS
transcription start site
- FRDA
Friedreich’s ataxia
Footnotes
Notes
The authors declare no competing financial interest.
Details of relative gene expression levels of control vs Alzheimer’s disease brain, the epigenetic modifying genes, hippocampal expression of KAT6B, the effect of rotenone on the heat map of SH-SY5Y cells, and the proposed mechanism of action of MRQs. This material is available free of charge via the Internet at http://pubs.acs.org.
References
- 1.Swerdlow RH, Burns JM, Khan SM. The Alzheimer’s disease mitochondrial cascade hypothesis. J Alzheimer’s Dis. 2010;20(Suppl 2):S265–279. doi: 10.3233/JAD-2010-100339. [DOI] [PMC free article] [PubMed] [Google Scholar]
- 2.Yao J, Irwin RW, Zhao L, Nilsen J, Hamilton RT, Brinton RD. Mitochondrial bioenergetic deficit precedes Alzheimer’s pathology in female mouse model of Alzheimer’s disease. Proc Natl Acad Sci U S A. 2009;106:14670–14675. doi: 10.1073/pnas.0903563106. [DOI] [PMC free article] [PubMed] [Google Scholar]
- 3.Xie H, Guan J, Borrelli LA, Xu J, Serrano-Pozo A, Bacskai BJ. Mitochondrial alterations near amyloid plaques in an Alzheimer’s disease mouse model. J Neurosci. 2013;33:17042–17051. doi: 10.1523/JNEUROSCI.1836-13.2013. [DOI] [PMC free article] [PubMed] [Google Scholar]
- 4.Cavallucci V, Ferraina C, D’Amelio M. Key role of mitochondria in Alzheimer’s disease synaptic dysfunction. Curr Pharm Des. 2013;19:6440–6450. doi: 10.2174/1381612811319360005. [DOI] [PubMed] [Google Scholar]
- 5.Bobba A, Petragallo VA, Marra E, Atlante A. Alzheimer’s proteins, oxidative stress, and mitochondrial dysfunction interplay in a neuronal model of Alzheimer’s disease. Int J Alzheimer’s Dis. 2010;2010:1–11. doi: 10.4061/2010/621870. [DOI] [PMC free article] [PubMed] [Google Scholar]
- 6.Ma WW, Hou CC, Zhou X, Yu HL, Xi YD, Ding J, Zhao X, Xiao R. Genistein alleviates the mitochondria-targeted DNA damage induced by beta-amyloid peptides 25–35 in C6 glioma cells. Neurochem Res. 2013;38:1315–1323. doi: 10.1007/s11064-013-1019-y. [DOI] [PubMed] [Google Scholar]
- 7.Calkins MJ, Manczak M, Mao P, Shirendeb U, Reddy PH. Impaired mitochondrial biogenesis, defective axonal transport of mitochondria, abnormal mitochondrial dynamics and synaptic degeneration in a mouse model of Alzheimer’s disease. Hum Mol Genet. 2011;20:4515–4529. doi: 10.1093/hmg/ddr381. [DOI] [PMC free article] [PubMed] [Google Scholar]
- 8.Reddy PH, Tripathi R, Troung Q, Tirumala K, Reddy TP, Anekonda V, Shirendeb UP, Calkins MJ, Reddy AP, Mao P, Manczak M. Abnormal mitochondrial dynamics and synaptic degeneration as early events in Alzheimer’s disease: implications to mitochondria-targeted antioxidant therapeutics. Biochim Biophys Acta. 2012;1822:639–649. doi: 10.1016/j.bbadis.2011.10.011. [DOI] [PMC free article] [PubMed] [Google Scholar]
- 9.Lin MT, Beal MF. Alzheimer’s APP mangles mitochondria. Nat Med. 2006;12:1241–1243. doi: 10.1038/nm1106-1241. [DOI] [PubMed] [Google Scholar]
- 10.Manczak M, Anekonda TS, Henson E, Park BS, Quinn J, Reddy PH. Mitochondria are a direct site of A beta accumulation in Alzheimer’s disease neurons: implications for free radical generation and oxidative damage in disease progression. Hum Mol Genet. 2006;15:1437–1449. doi: 10.1093/hmg/ddl066. [DOI] [PubMed] [Google Scholar]
- 11.Cha MY, Han SH, Son SM, Hong HS, Choi YJ, Byun J, Mook-Jung I. Mitochondria-specific accumulation of amyloid beta induces mitochondrial dysfunction leading to apoptotic cell death. PLoS One. 2012;7:e34929. doi: 10.1371/journal.pone.0034929. [DOI] [PMC free article] [PubMed] [Google Scholar]
- 12.Hansson Petersen CA, Alikhani N, Behbahani H, Wiehager B, Pavlov PF, Alafuzoff I, Leinonen V, Ito A, Winblad B, Glaser E, Ankarcrona M. The amyloid beta-peptide is imported into mitochondria via the TOM import machinery and localized to mitochondrial cristae. Proc Natl Acad Sci U S A. 2008;105:13145–13150. doi: 10.1073/pnas.0806192105. [DOI] [PMC free article] [PubMed] [Google Scholar]
- 13.Caspersen C, Wang N, Yao J, Sosunov A, Chen X, Lustbader JW, Xu HW, Stern D, McKhann G, Yan SD. Mitochondrial Abeta: a potential focal point for neuronal metabolic dysfunction in Alzheimer’s disease. FASEB J. 2005;19:2040–2041. doi: 10.1096/fj.05-3735fje. [DOI] [PubMed] [Google Scholar]
- 14.Cardoso SM, Santos S, Swerdlow RH, Oliveira CR. Functional mitochondria are required for amyloid β-mediated neurotoxicity. FASEB J. 2001;15:1439–1441. doi: 10.1096/fj.00-0561fje. [DOI] [PubMed] [Google Scholar]
- 15.Veereshwarayya V, Kumar P, Rosen KM, Mestril R, Querfurth HW. Differential effects of mitochondrial heat shock protein 60 and related molecular chaperones to prevent intracellular β-amyloid-induced inhibition of complex IV and limit apoptosis. J Biol Chem. 2006;281:29468–29478. doi: 10.1074/jbc.M602533200. [DOI] [PubMed] [Google Scholar]
- 16.Liang WS, Reiman EM, Valla J, Dunckley T, Beach TG, Grover A, Niedzielko TL, Schneider LE, Mastroeni D, Caselli R, Kukull W, Morris JC, Hulette CM, Schmechel D, Rogers J, Stephan DA. Alzheimer’s disease is associated with reduced expression of energy metabolism genes in posterior cingulate neurons. Proc Natl Acad Sci U S A. 2008;105:4441–4446. doi: 10.1073/pnas.0709259105. [DOI] [PMC free article] [PubMed] [Google Scholar]
- 17.Rhein V, Baysang G, Rao S, Meier F, Bonert A, Müller-Spahn F, Eckert A. Amyloid-beta leads to impaired cellular respiration, energy production and mitochondrial electron chain complex activities in human neuroblastoma cells. Cell Mol Neurobiol. 2009;29:1063–1071. doi: 10.1007/s10571-009-9398-y. [DOI] [PMC free article] [PubMed] [Google Scholar]
- 18.Hernandez-Zimbron LF, Luna-Muñoz J, Mena R, Vazquez-Ramirez R, Kubli-Garfias C, Cribbs DH, Manoutcharian K, Gevorkian G. Amyloid-β peptide binds to cytochrome C oxidase subunit 1. PLoS One. 2012;8:e42344. doi: 10.1371/journal.pone.0042344. [DOI] [PMC free article] [PubMed] [Google Scholar]
- 19.Bobba A, Amadoro G, Valenti D, Corsetti V, Lassandro R, Atlante A. Mitochondrial respiratory chain complexes I and IV are impaired by β-amyloid via direct interaction and through complex I-dependent ROS production, respectively. Mitochondrion. 2013;13:298–311. doi: 10.1016/j.mito.2013.03.008. [DOI] [PubMed] [Google Scholar]
- 20.Minocherhomji S, Tollefsbol TO, Singh KK. Mitochondrial regulation of epigenetics and its role in human diseases. Epigenetics. 2012;7:326–334. doi: 10.4161/epi.19547. [DOI] [PMC free article] [PubMed] [Google Scholar]
- 21.Lewis PN, Lukiw WJ, De Boni U, McLachlan DR. Changes in chromatin structure associated with Alzheimer’s disease. J Neurochem. 1981;37:1193–1202. doi: 10.1111/j.1471-4159.1981.tb04670.x. [DOI] [PubMed] [Google Scholar]
- 22.Mastroeni D, Grover A, Delvaux E, Whiteside C, Coleman PD, Rogers J. Epigenetic changes in Alzheimer’s disease: decrements in DNA methylation. Neurobiol Aging. 2010;31:2025–2037. doi: 10.1016/j.neurobiolaging.2008.12.005. [DOI] [PMC free article] [PubMed] [Google Scholar]
- 23.Khdour OM, Arce PM, Roy B, Hecht SM. An optimized pyrimidinol multifunctional radical quencher. ACS Med Chem Lett. 2013;4:724–729. doi: 10.1021/ml400130z. [DOI] [PMC free article] [PubMed] [Google Scholar]
- 24.Goldschmidt R, Arce PM, Khdour OM, Collin VC, Dey S, Jaruvangsanti J, Fash DM, Hecht SM. Effects of cytoprotective antioxidants on lymphocytes from representative mitochondrial neurodegenerative diseases. Bioorg Med Chem. 2013;21:969–978. doi: 10.1016/j.bmc.2012.11.051. [DOI] [PubMed] [Google Scholar]
- 25.Gilbert N, Ramsahoye B. The relationship between chromatin structure and transcriptional activity in mammalian genomes. Briefings Funct Genomics Proteomics. 2005;4:129–142. doi: 10.1093/bfgp/4.2.129. [DOI] [PubMed] [Google Scholar]
- 26.Vignali M, Hassan AH, Neely KE, Workman JL. ATP-dependent chromatin-remodeling complexes. Mol Cell Biol. 2000;20:1899–1910. doi: 10.1128/mcb.20.6.1899-1910.2000. [DOI] [PMC free article] [PubMed] [Google Scholar]
- 27.Smith MA, Hirai K, Hsiao K, Pappolla MA, Harris P, Siedlak S, Tabaton M, Perry G. Amyloid-beta deposition in Alzheimer transgenic mice is associated with oxidative stress. J Neurochem. 1998;70:2212–2215. doi: 10.1046/j.1471-4159.1998.70052212.x. [DOI] [PubMed] [Google Scholar]
- 28.Butterfield DA, Boyd-Kimball D. Amyloid beta-peptide(1–42) contributes to the oxidative stress and neurodegeneration found in Alzheimer disease brain. Brain Pathol. 2004;14:426–432. doi: 10.1111/j.1750-3639.2004.tb00087.x. [DOI] [PMC free article] [PubMed] [Google Scholar]
- 29.Lin MT, Beal MF. Mitochondrial dysfunction and oxidative stress in neurodegenerative diseases. Nature. 2006;443:787–795. doi: 10.1038/nature05292. [DOI] [PubMed] [Google Scholar]
- 30.Du H, Guo L, Yan S, Sosunov AA, McKhann GM, Yan SS. Early deficits in synaptic mitochondria in an Alzheimer’s disease mouse model. Proc Natl Acad Sci U S A. 2010;107:18670–18675. doi: 10.1073/pnas.1006586107. [DOI] [PMC free article] [PubMed] [Google Scholar]
- 31.Hirai K, Aliev G, Nunomura A, Fujioka H, Russell RL, Atwood CS, Johnson AB, Kress Y, Vinters HV, Tabaton M, Shimohama S, Cash AD, Siedlak SL, Harris PL, Jones PK, Petersen RB, Perry G, Smith MA. Mitochondrial abnormalities in Alzheimer’s disease. J Neurosci. 2001;21:3017–3023. doi: 10.1523/JNEUROSCI.21-09-03017.2001. [DOI] [PMC free article] [PubMed] [Google Scholar]
- 32.De Biase I, Chutake YK, Rindler PM, Bidichandani SI. Epigenetic silencing in Friedreich ataxia is associated with depletion of CTCF (CCCTC-binding factor) and antisense transcription. PLoS One. 2009;4:e7914. doi: 10.1371/journal.pone.0007914. [DOI] [PMC free article] [PubMed] [Google Scholar]
- 33.Kumari D, Usdin K. Is Friedreich ataxia an epigenetic disorder? Clin Epigenet. 2012;4:2. doi: 10.1186/1868-7083-4-2. [DOI] [PMC free article] [PubMed] [Google Scholar]
- 34.Arce PM, Khdour OM, Goldschmidt R, Armstrong JS, Hecht SM. A strategy for suppressing redox stress within mitochondria. ACS Med Chem Lett. 2011;2:608–613. doi: 10.1021/ml200095w. [DOI] [PMC free article] [PubMed] [Google Scholar]
- 35.Liang WS, Dunckley T, Beach TG, Grover A, Mastroeni D, Ramsey K, Caselli RJ, Kukull WA, McKeel D, Morris JC, Hulette CM, Schmechel D, Reiman EM, Rogers J, Stephan DA. Altered neuronal gene expression in brain regions differentially affected by Alzheimer’s disease: a reference data set. Physiol Genomics. 2008;33:240–256. doi: 10.1152/physiolgenomics.00242.2007. [DOI] [PMC free article] [PubMed] [Google Scholar]
- 36.Loring JF, Wen X, Lee JM, Seilhamer J, Somogyi R. A gene expression profile of Alzheimer’s disease. DNA Cell Biol. 2001;20:683–695. doi: 10.1089/10445490152717541. [DOI] [PubMed] [Google Scholar]
- 37.Robinson CA, Clark AW, Parhad IM, Fung TS, Bou SS. Gene expression in Alzheimer neocortex as a function of age and pathologic severity. Neurobiol Aging. 1994;15:681–690. doi: 10.1016/0197-4580(94)90049-3. [DOI] [PubMed] [Google Scholar]
- 38.Weeraratna AT, Kalehua A, DeLeon I, Bertak D, Maher G, Wade MS, Lustig A, Becker KG, Wood W, III, Walker DG, Beach TG, Tauba DD. Alterations in immunological and neurological gene expression patterns in Alzheimer’s disease tissues. Exp Cell Res. 2007;313:450–461. doi: 10.1016/j.yexcr.2006.10.028. [DOI] [PMC free article] [PubMed] [Google Scholar]
- 39.Chow N, Cox C, Callahan LM, Weimer JM, Guo L, Coleman PD. Expression profiles of multiple genes in single neurons of Alzheimer’s disease. Proc Natl Acad Sci U S A. 1998;95:9620–9625. doi: 10.1073/pnas.95.16.9620. [DOI] [PMC free article] [PubMed] [Google Scholar]
- 40.Ginsberg SD, Hemby SE, Lee VM, Eberwine JH, Trojanowski JQ. Expression profile of transcripts in Alzheimer’s disease tangle-bearing CA1 neurons. Ann Neurol. 2000;48:77–87. [PubMed] [Google Scholar]
- 41.Quina AS, Buschbeck M, Di Croce L. Chromatin structure and epigenetics. Biochem Pharmacol. 2006;72:1563–1569. doi: 10.1016/j.bcp.2006.06.016. [DOI] [PubMed] [Google Scholar]
- 42.Conaway RC, Conaway JW. ATP activates transcription initiation from promoters by RNA polymerase II in a reversible step prior to RNA synthesis. J Biol Chem. 1988;263:2962–2968. [PubMed] [Google Scholar]
- 43.Klingenberg M. The ADP and ATP transport in mitochondria and its carrier. Biochim Biophys Acta. 2008;1778:1978–2021. doi: 10.1016/j.bbamem.2008.04.011. [DOI] [PubMed] [Google Scholar]
- 44.Maruszak A, Zekanowski C. Mitochondrial dysfunction and Alzheimer’s disease. Prog Neuro-Psychopharmacol Biol Psychiatry. 2011;35:320–330. doi: 10.1016/j.pnpbp.2010.07.004. [DOI] [PubMed] [Google Scholar]
- 45.Mastroeni D, Grover A, Leonard B, Joyce JN, Coleman PD, Kozik B, Bellinger DL, Rogers J. Microglial responses to dopamine in a cell culture model of Parkinson’s disease. Neurobiol Aging. 2009;30:1805–1817. doi: 10.1016/j.neurobiolaging.2008.01.001. [DOI] [PMC free article] [PubMed] [Google Scholar]
- 46.Dahlgren KN, Manelli AM, Stine WB, Jr, Baker LK, Krafft GA, LaDu MJ. Oligomeric and fibrillar species of amyloid-beta peptides differentially affect neuronal viability. J Biol Chem. 2002;277:32046–32053. doi: 10.1074/jbc.M201750200. [DOI] [PubMed] [Google Scholar]
- 47.Klein WL. Abeta toxicity in Alzheimer’s disease: Globular oligomers (ADDLs) as new vaccine and drug targets. Neurochem Int. 2002;41:345–352. doi: 10.1016/s0197-0186(02)00050-5. [DOI] [PubMed] [Google Scholar]
- 48.Kayed R, Head E, Thompson JL, McIntire TM, Milton SC, Cotman CW, Glabe CG. Common structure of soluble amyloid oligomers implies common mechanism of pathogenesis. Science. 2003;300:486–489. doi: 10.1126/science.1079469. [DOI] [PubMed] [Google Scholar]
- 49.Kim J, Kim SK, Kim HK, Mattson MP, Hyun DH. Mitochondria function in human neuroblastoma cells is up-regulated and protected by NQO1, a plasma membrane redox enzyme. PLoS One. 2013;4:e69030. doi: 10.1371/journal.pone.0069030. [DOI] [PMC free article] [PubMed] [Google Scholar]
- 50.Davis RE, Miller S, Herrnstadt C, Ghosh SS, Fahy E, Shinobu LA, Galasko D, Thal LJ, Beal MF, Howell N, Parker WD., Jr Mutations in mitochondrial cytochrome c oxidase genes segregate with late-onset Alzheimer disease. Proc Natl Acad Sci U S A. 1997;94:4526–4531. doi: 10.1073/pnas.94.9.4526. [DOI] [PMC free article] [PubMed] [Google Scholar] [Retracted]
Associated Data
This section collects any data citations, data availability statements, or supplementary materials included in this article.