Abstract
Histotripsy therapy produces cavitating bubble clouds to increasingly fractionate and eventually liquefy tissue using high intensity ultrasound pulses. Following cavitation generated by each pulse, coherent motion of the cavitation residual nuclei can be detected using metrics formed from ultrasound color Doppler acquisitions. In this paper, three experiments were performed to investigate the characteristics of this motion as real-time feedback on histotripsy tissue fractionation. In the first experiment, bubble-induced color Doppler (BCD) and particle image velocimetry (PIV) analysis monitored the residual cavitation nuclei in the treatment region in an agarose tissue phantom treated with 2-cycle histotripsy pulses at > 30 MPa using a 500 kHz transducer. Both BCD and PIV results showed brief chaotic motion of the residual nuclei followed by coherent motion first moving away from the transducer and then rebounding back. Velocity measurements from both PIV and BCD agreed well, showing a monotonic increase in rebound time up to a saturation point for increased therapy dose. In a second experiment, a thin layer of red blood cells (RBC) was added to the phantom to allow quantification of the fractionation of the RBC layer to compare with BCD metrics. A strong linear correlation was observed between the fractionation level and the time to BCD peak rebound velocity over histotripsy treatment. Finally, the correlation between BCD feedback and histotripsy tissue fractionation was validated in ex vivo porcine liver evaluated histologically. BCD metrics showed strong linear correlation with fractionation progression, suggesting that BCD provides useful quantitative real-time feedback on histotripsy treatment progression.
Index Terms: Elastography, High intensity focused ultrasound (HIFU) hyperthermia and surgery, Medical Signal and Image Processing, Medical Tissue Characterization
I. Introduction
Histotripsy creates tissue fractionation by initiating and controlling a cloud of cavitating bubbles using short, high pressure ultrasound pulses [1–3]. These bubbles fractionate a portion of the tissue in the therapy focus with each pulse, eventually reducing the target tissue to a liquid acellular homogenate after a sufficient number of pulses have been applied. Histotripsy has been investigated as a potential treatment for benign prostatic hyperplasia [4], deep venous thrombosis [5], urinary calculi [6], liver tumors [7], several congenital heart diseases [8], and transcranial applications [9].
Real-time imaging feedback during minimally invasive or non-invasive ablation therapy is essential for ensuring efficient and thorough treatment of the target tissue. The fractionation induced by histotripsy appears as a hypo-echoic zone on B-mode ultrasound images, resulting from the backscatter amplitude reduction due to reduced number and size of scatters [10]. However, this is only observed when substantial tissue fractionation is generated, and the level of reduction corresponding to treatment completion varies significantly across subjects [11]. Magnetic resonance (MR) imaging has also been investigated and histotripsy lesions can be shown on standard T1- or T2- weighted images [12]. MR is sensitive to histotripsy-induced tissue damage, as T2-weighted images show apparent changes after only a few therapy pulses have been applied. The high cost of MR imaging systems, the slower frame rate, and the requirement for MR compatible ultrasound therapy transducers are potential limiting factors.
Elastography has also been explored to monitor histotripsy therapy, as histotripsy fractionation results in increasingly softer tissue. With comparatively low cost and ease of integration, ultrasound elastography [13–19] is an attractive choice for histotripsy feedback. Ultrasound elastography has been widely investigated for tissue delineation because the high contrast in the elasticity between normal and diseased tissues allows higher specificity and sensitivity for disease diagnosis [20–22]. Wang et al.’s [23] work has demonstrated shear wave elastography is more sensitive at detecting early-stage histotripsy fractionation compared to echogenicity decrease. However, in that work, to measure a shear wave velocity reliably the treatment needs to be halted temporally to allow the application of additional push pulses and the measurements of shear wave velocity. Also, as shear waves do not propagate through liquid, sensitivity is reduced as the tissue is increasingly fractionated.
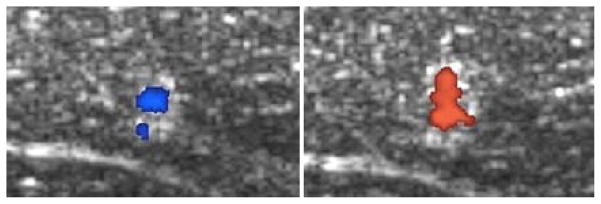
Color Doppler imaging, synchronized with histotripsy pulses has been observed to detect what appeared to be motion in the focal volume along the ultrasound propagation direction immediately after the histotripsy pulse arrives at the focus (Fig. 1). As recent studies have shown that Doppler signals can be attributed to cavitation dynamics in situations like this [24, 25], we first set to investigate the source of this bubble-induced motion. The velocity detected at a fixed delay after the histotripsy pulses was observed to change in magnitude and even direction over the course of histotripsy therapy. This motion is only detectable when a cavitation bubble cloud is formed, and therefore we termed it bubble-induced motion. This motion can last over 20 ms after each histotripsy pulse. We hypothesize that this detected signal is the motion of residual cavitation nuclei resulting from the rapid, asymmetric expansion and/or collapse of cavitation bubbles in the focal region, which depends on the force applied by the bubble expansion and collapse as well as the mechanical properties of the tissue in the focal region containing the residual cavitation nuclei. Motion of the residual bubble nuclei following histotripsy has been observed previously [26]. As the tissue is increasingly fractionated by histotripsy, the motion of the residual cavitation nuclei lasts longer. We hypothesize that metrics of the changing bubble-induced motion over the course of histotripsy therapy may be directly correlated with fractionation progression, which can be detected by ultrasound color Doppler in real-time during the histotripsy treatment. The residual cavitation nuclei can persist for over 100 ms after the cloud collapse [27] and provide strong acoustic scattering for Doppler acquisitions of bubble-induced motion in the treatment focal region [25]. The increased signal from these residual bubbles grants increased signal to noise ratio in the focal region, allowing more aggressive filtering to reduce clutter and other noise in the images.
Fig. 1.
Color Doppler overlaid on B-mode images during a histotripsy treatment of ex vivo porcine liver. The coherent motion in the focal region was first away from the therapy transducer, then rebounds back towards the transducer, and then oscillates between away from and towards the transducer. The delay time between the color Doppler imaging pulses and the therapy pulses were selected purposely capture the rebound motion towards the therapy transducer at the start of treatment (left), which turns to the push motion away from the transducer with the same delay time later in the treatment (right).
This paper characterizes the bubble-induced motion during the histotripsy treatment and correlates the bubble-induced color Doppler (BCD) feedback to the degree of tissue fractionation generated by histotripsy. Three experiments were performed. First, the bubble-induced motion was investigated and characterized using particle image velocimetry (PIV). The motion in the treatment focal region after each histotripsy therapy pulse was generated in transparent tissue-mimicking agarose phantoms where cavitation bubbles and residual nuclei are the only source of contrast for PIV. The profiles of the PIV and Doppler velocity were collected simultaneously and compared over the course of the entire histotripsy treatment to investigate the source of the Doppler signal and characterize the bubble-induced motion. Similar comparison between color Doppler and optical PIV has shown good agreement in velocity measurements [28]. Second, a metric capturing the change in the temporal profile of the BCD is correlated with the level of fractionation generated in tissue-mimicking phantoms over the course of the histotripsy treatment. Finally, the same BCD acquisitions were performed in treatments of ex vivo porcine liver tissue to validate this correlation in real tissue. To evaluate the potential of using BCD feedback for real-time histotripsy monitoring, we also investigated an additional metric to quantify change in the temporal profile of the bubble-induced motion that can be measured and processed during the histotripsy treatment.
II. Methods
A. General Methods
1) Histotripsy Therapy
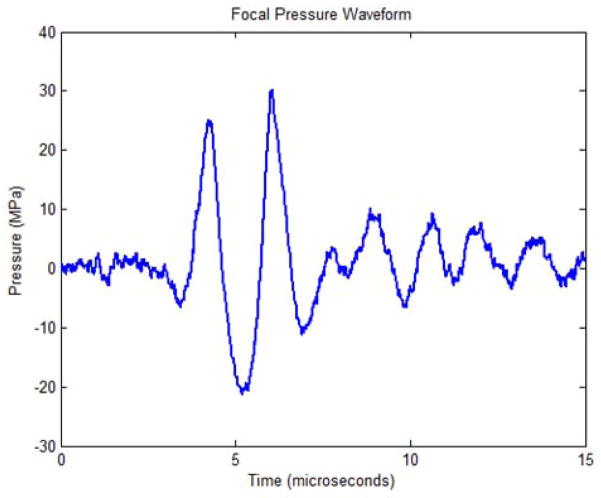
Histotripsy therapy pulses of 2 cycles in duration at > 30 MPa peak negative pressure were applied over a 6 mm cube using a 500 kHz phased array transducer built in-house. The transducer is comprised of 32 elements with 50 mm diameter mounted confocally on a 15 cm hemispherical shell, resulting in an array with 15 cm focal length and 30 cm aperture. The acoustic output pressure waveform of the therapy transducer was measured using a fiber optic probe hydrophone (FOPH) up to 20 MPa [29] as shown in Fig. 2. At higher pressure levels, the acoustic output of the full aperture could not be directly measured due to cavitation at the fiber tip. The peak negative pressure was estimated by a linear summation (P(−)LS) of the output focal p- values from individual transducer elements measured by a calibrated needle hydrophone (model HNR-0500, Onda Corp., Sunnyvale, CA). Each element generated 2.2 MPa peak negative pressure at the parameters used for this study, for a P(−)LS of about 70.4 MPa for the full aperture. This approximation assumes minimal nonlinear distortion of the waveform occurs within the focal region and probably overestimates the peak pressure. The array is driven by a custom-built 32-channel amplifier system that controls the driving amplitude and phase of each individual element. This transducer has a −6 dB beamwidth of 1.9 mm in the lateral dimension and 4 mm in the axial dimension.
Fig. 2.
Focal pressure waveform for the 32-element transducer as measured with a fiber-optic hydrophone when driven below the cavitation threshold.
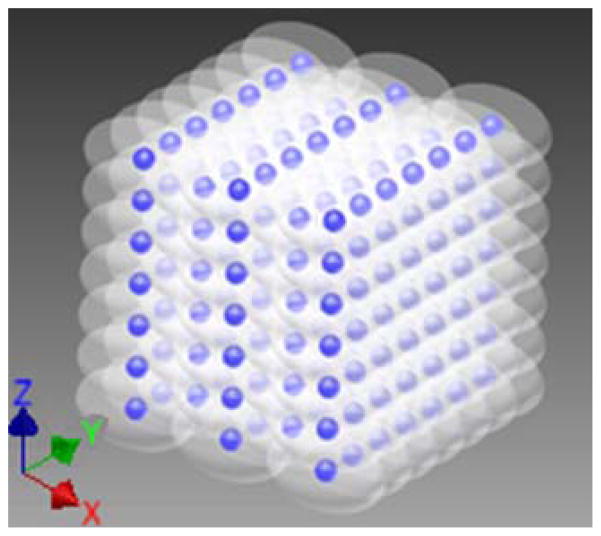
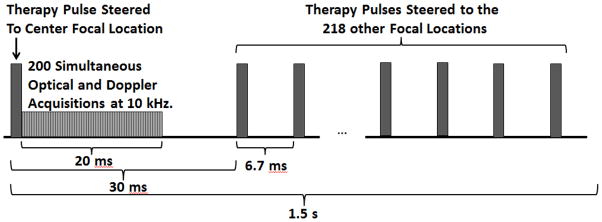
To ensure uniform fractionation over the target volume, 219 focal points at 1 mm separations were treated sequentially at 150 Hz with a single pulse applied at each location. These focal locations were arranged into layers separated by 1 mm in the axial dimension, with alternating layers offset in both lateral dimensions from adjacent layers by half the lateral spacing (Fig. 3). P(−)LS over this steering range was estimated to be at least 49.3 MPa. Treatment was applied starting with the layer farthest from the transducer and moving layer by layer toward the transducer. Individual foci within each layer were treated in random order. This treatment strategy provides complete coverage of the treatment area with fewer focal locations and less treatment overlap than a simple rectilinear scan due to the roughly ellipsoidal bubble cloud shape. This pulsing scheme (Fig. 4) was repeated every 1.5 seconds until all focal locations had been treated with up to 2000 pulses each. Using this pulsing strategy, all 219 foci are treated in parallel, at a constant rate of 0.67 Hz. This pulsing strategy guarantees uniform therapy dose over the treatment volume at all times during treatment.
Fig. 3.
Steered focal locations for the 219 foci with 5 alternating 1 mm spaced axial layers of 7×7 foci and 6×6 foci. The axial layers (X axis) are separated by 1 mm, but with the 6×6 grids offset from the 7×7 layers by 0.5 mm in both lateral dimensions (Y and Z axes). The hemispherical transducer is located in the positive X direction of the YZ plane in this case.
Fig. 4.
Timing diagram showing the first therapy pulse delivered to the center focal location of the target volume, followed by the 20 ms high speed optical imaging and ultrasound Doppler acquisition window, and finally steered therapy pulses delivered to the 218 other focal locations. The therapy pulse was steered back to the center focal location after 1.5 seconds.
2) High Speed Optical Imaging
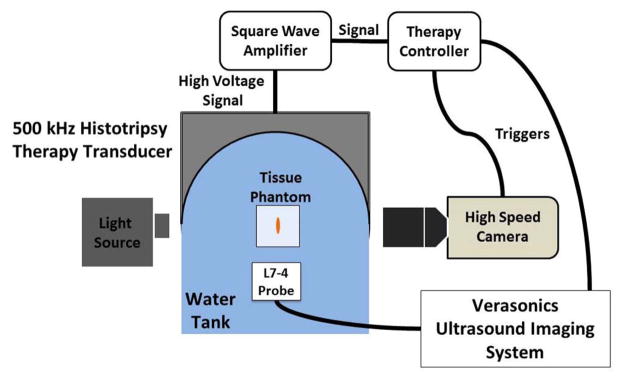
High speed optical images of the focal region were captured using a Phantom V210 high-speed camera with 135mm macro lens on bellows with backlighting (Vision Research, Wayne, NJ), providing a pixel resolution of approximately 8.6 μm and an optical depth of field larger than the 1.9 mm bubble cloud width. In experiments in transparent agarose phantoms, the bubble cloud and these residual bubble nuclei generated after the bubble cloud collapse at 250 μs are the only source of optical contrast in the images. At this resolution, a significant number of residual bubble nuclei could be resolved after cloud collapse, and the translational velocity of these bubble nuclei could be estimated by comparing successive images. The camera and backlight were positioned perpendicular to the therapy axis (Fig. 5). The camera was set to capture either a single image per therapy pulse, or acquisition sets of 200 images at 10 kHz frame rate beginning immediately after the firing of a therapy pulse for a 20 ms total acquisition time, well within the 100+ ms lifetime of the residual bubble nuclei [27]. For the 200 image per pulse acquisition mode, the internal memory of the camera could only accommodate a total of 95 sets of 200 images, so to facilitate continuous treatment without interruptions for data transfer over a dose sufficient to completely fractionate the tissue phantom; acquisition sets were captured after every 10th pulse delivered to the center focal location for a total treatment of 941 therapy pulses.
Fig. 5.
Experimental setup with 500 kHz transducer mounted to the side of a water tank with 5 MHz imaging probe mounted opposite the therapy and aligned along the therapy axis. The Phantom high speed camera was positioned perpendicular to the therapy axis.
3) Doppler Ultrasound Imaging
Ultrasound Doppler acquisitions were performed using a Verasonics imaging system (Redmond, WA) with a 5 MHz linear imaging transducer (ATL HDI L7–4, Philips, Andover, MA). The imaging transducer was positioned opposite the therapy transducer, aligned along the therapy axis approximately 40 mm from the therapy focus, i.e., the ultrasound imaging beam was rigidly aligned with the therapy beam to avoid the effect of angle variation on Doppler (Fig. 5). The ultrasound imaging system was set to capture acquisition sets of 200 Doppler acquisitions at 10 kHz pulse repetition frequency (PRF) rate to estimate the motion in the focal region over a period of 20 ms after each therapy pulse delivered to the center location of the target volume, which covered the same time period of motion recorded simultaneously using PIV in experiments in transparent agarose phantoms. In those experiments, the phantom was observed to be homogeneous and dark on ultrasound imaging, resulting in the bubble cloud and residual bubble nuclei (after the bubble cloud collapse at 250 μs) generated by each histotripsy pulse and persisting for 100+ ms [27] being the only source of acoustic contrast in the ultrasound image. With these Doppler imaging parameters, a maximum velocity of 75 cm/s can be measured, high enough to avoid aliasing of the roughly 2 cm/s average velocities observed in preliminary experiments. Acquisition sets were captured after every pulse delivered to the center location, and therefore included Doppler acquisitions simultaneous to the optical images acquired after every 10th pulse for direct comparison.
B. Experiment 1 – Bubble-induced Motion Characterization using PIV and Doppler
1) Agarose Tissue Phantom Preparation and Treatment
To investigate the bubble-induced motion after each histotripsy pulse through the entire histotripsy treatment, experiments were performed in optically transparent agar tissue mimicking phantoms. This phantom allowed simultaneous optical and acoustic interrogation of the focal volume for motion analysis during histotripsy treatment. Agar powder (AG-SP, Lab Scientific, Livingston, NJ) was dissolved in heated distilled water at 1.5% concentration by mass. The solution was then degassed in a vacuum chamber and allowed to cool and solidify in an acrylonitrile butadiene styrene (ABS) plastic housing frame with thin polycarbonate walls. This results in a phantom with similar mechanical properties to tissue, but without embedded scatterers the attenuation and absorption are not comparable to real tissue. Three phantoms were treated at 3 locations each with 941 histotripsy pulses using the previously described methods and parameters, for a total of 9 treatments. These treatments were monitored using the described optical and ultrasound imaging methods for PIV and Doppler velocity estimation. In this experiment, 200 optical images were acquired at 10 kHz frame rate after every 10th therapy pulse for PIV analysis. The high speed camera memory could only accommodate 95 sets of 200 images, thus treatment was limited to 941 pulses, which was more than sufficient to completely fractionate the target volume. In these images, the bubble cloud collapsed after roughly 250 μs, leaving behind residual bubble nuclei as the only source of optical contrast in the images. Doppler data sets of 200 acquisitions were collected at 10 kHz frame rate after every therapy pulse. Similarly, after the bubble cloud collapsed, residual bubble nuclei were the only source of acoustic contrast in the phantom.
2) PIV Velocity Estimation
The high-speed optical images of the focal region were processed using the freely available PIVlab package (v1.32, Thielicke and Stamhuis, Bremen University of Applied Sciences, Germany) for MATLAB to estimate the residual bubble motion resulting from the histotripsy therapy pulses. The PIV analysis was performed in a roughly 6.6 × 3.3 mm field of view at a resolution of 116 pixels per mm (total 768 × 384 pixels). The images were processed in pairs at two subsequent time points using a FFT window deformation algorithm with 3 pass velocity estimation with image block sizes and step sizes of 64/32 pixels for pass 1, 32/16 pixels for pass 2, and 16/8 pixels for pass 3. This processing resulted in velocity field maps of the field of view over the 19 ms after a histotripsy therapy pulse. The axial components of these PIV velocity maps were then spatially averaged over the 2 × 4 mm bubble cloud area, and temporally averaged over a 1 ms rolling window to produce an average velocity estimate in the focal region over time to compare with that measured by color Doppler simultaneously. As the optical images have higher resolution than the acoustic images, the residual bubble motion estimated from PIV is considered the benchmark that we can use to assess the accuracy of the Doppler velocity estimation.
3) Doppler Velocity Estimation
The ultrasound Doppler acquisitions were processed offline using the Doppler processing algorithm included in the Verasonics imaging system. To calculate the velocity over the 19 ms after the therapy pulse, the 200 acquisitions were processed in rolling 10 acquisition segments (equivalent to making 190 separate 10 frame acquisitions at 10 kHz PRF with delay times of integer multiples of 100 ns after each histotrispy pulse). These Doppler velocity maps were then spatially averaged over the 2 × 4 mm bubble cloud area to produce the final average velocity estimate over time. The motion profiles as measured by color Doppler can then be compared to those measured by PIV interrogation to determine if color Doppler acquisitions can provide an accurate measure of histotripsy bubble cloud induced motion.
From both the PIV and Doppler datasets, a metric was extracted to capture the changes in the temporal profile of the bubble-induced motion over the course of therapy into a single number. The metric used is the time to peak rebound velocity (tPRV), which was computed by calculating the time of the highest magnitude negative velocity after each therapy pulse. This metric was computed from both the PIV and color Doppler velocity measurements for comparison.
C. Experiment 2 – Correlate Bubble-induced Color Doppler (BCD) with Histotripsy-induced Fractionation in Agarose Tissue Phantom
1) Damage-indicating Agarose Phantom Preparation and Treatment
The purpose of using this phantom is to provide a quantifiable damage indicator of histotripsy tissue fractionation to correlate with a feedback metric extracted from the BCD velocity estimations. Tissue-mimicking agarose gel phantoms embedded with a thin layer of red blood cells (RBC) have been shown to indicate the level of cavitation-induced fractionation, where the RBC area turns from opaque red to translucent pink as the RBCs are fractionated and can be visualized directly during the treatment [30]. To form the 3 layer phantom, agar powder was dissolved in heated, phosphate-buffered saline solution at 1.5% concentration by mass. This solution was degassed and poured to half fill the same ABS housing with thin polycarbonate walls used in the previous experiment. This was allowed to solidify to form a bottom layer of transparent agarose. Red blood cells were then added to small amount of agarose solution at 5% concentration by mass. This was then poured onto the base layer of transparent agarose in an approximately 1mm thick layer and allowed to solidify. Finally, a top layer of transparent agarose was added to fill the housing and fully contain the RBC layer in a large tissue-mimicking phantom.
The BCD and PIV setup was identical to the previous experiment, with color Doppler and optical interrogations performed following the therapy pulse delivered to center focal location after each full treatment of the therapy volume. In this case however, only a single optical image was captured per therapy pulse. The phantom was positioned with the RBC layer parallel to the therapy propagation and perpendicular to the high speed imaging to visualize the lesion development over the course of therapy. Four phantoms were treated at 3 locations each with 1000 histotripsy pulses each using the previously described methods and parameters, for a total of 12 treatments.
2) Fractionation Progress Estimation
From images of this lesion progression, we created a reference metric of fractionation progression and used it to correlate with the tPRV BCD feedback metric. To compute this reference metric, an approximately 4 mm square region of interest was chosen in the center of the treated region and the average pixel intensity was computed over the treatment course. The RBC layer allows more light to pass through as it is increasingly fractionated, eventually becoming completely transparent when all cells in the layer have been destroyed. The mean lesion intensity (MLI) in the region of interest can therefore directly measure the fractionation progression in that region and serve as a reference metric of fractionation progression. This metric was computed for the twelve treatments and correlated to the fractionation metric extracted from the BCD feedback (tPRV) to determine its sensitivity in detecting histotripsy fractionation damage in the RBC tissue phantom.
D. Experiment 3 – Validate Bubble-induced Color Doppler in Ex Vivo Porcine Liver
A final experiment was conducted in ex vivo porcine liver to validate the bubble-induced color Doppler feedback in real tissue. Doppler data was collected throughout each histotripsy treatment. Ex vivo porcine liver samples were treated with different therapy doses (i.e., number of therapy pulses), with 3 samples per dose. The treated tissue was processed for histological analysis, and the degree of tissue fractionation corresponding to a therapy dose was assessed by counting the percentage of intact cell nuclei within the treatment region as described below. The tPRV metric was computed for these datasets as described earlier. An alternative metric, the fixed delay focal mean velocity (Vt_delay), was also computed from the synchronized, delayed color Doppler acquisitions. Specifically, the mean Doppler velocity over a 1 ms window (10 Doppler pulse acquisitions) at a delay of 14.3 ms from the therapy pulse was computed over the 1000 pulse treatments. The Vt_delay can be computed at higher frame rates, and would therefore be useful for applications requiring faster treatment pulsing rates. Both tPRV and Vt_delay were correlated with the level of tissue fractionation evaluated histologically.
1) Tissue Preparation
Freshly excised porcine liver tissue was acquired from a local supplier, preserved in normal saline at 4°C, and used within 24 hours of harvest. Prior to treatment, the liver was sectioned into approximately 5 cm cube sections. The sections were placed in degassed saline (less than 20% of normal saturation determined by pO2) at room temperature for at least 1 hour to allow for equilibration of the temperature and gas concentration. The liver sections were then embedded in 1% agarose in the same ABS framed, polycarbonate walled housing used in the previous experiments.
2) Ex Vivo Tissue Treatment
Lesions were created in the liver samples with 50, 200, 500, 1000, or 2000 pulses per treatment location using the previously described histotripsy setup and therapy parameters. A total of 15 samples were treated, with a sample size of 3 for each number of therapy pulses. The ultrasound imaging setup was identical to the previous experiments, with color Doppler interrogations performed following the therapy pulse delivered to center focal location after each full treatment of the therapy volume. The same treatment process used for the agarose phantom treatments, and explained above, was repeated until all focal locations had been treated with the prescribed therapy dose. The BCD acquisitions were processed identically to the previous experiments to produce a velocity progression over the course of histotripsy therapy.
3) Assessment of Degree of Tissue Fractionation
The degree of tissue fractionation was assessed for the lesions produced in the liver samples via histology. The liver sections were fixed in 10% neutral buffered formalin and processed for hematoxylin and eosin (H&E) staining. Histological sections 5 μm thick were made at 500 μm intervals through the lesion with slices oriented in parallel with the ultrasound imaging plane. The degree of tissue fractionation was evaluated with the percentage of structurally intact cell nuclei remaining in the lesions. This percentage was calculated using the method described in [11], and summarized here. The number of structurally intact cell nuclei was counted in five 320 μm × 240 μm regions near the center of the lesion, or in an untreated control region. An average count was obtained from the five counts. The average count for the lesion was then divided by that for the control, producing the percentage of nuclei remaining (PNR) metric. This metric was then compared to the fractionation metrics extracted from the BCD feedback (tPRV or Vt_delay) to determine its sensitivity in detecting histotripsy fractionation damage in tissue.
III. Results
A. Experiment 1 – Bubble-induced Motion Characterization using PIV and Color Doppler
Following each histotripsy pulse, a cavitation bubble cloud was generated immediately and collapsed within 300 μs. Residual bubble nuclei persisted after the cavitation collapse and were clearly visible in high-speed optical images of the focal region taken during the 20 ms after each histotripsy therapy pulse. An estimation of how closely these residual nuclei followed the flow for PIV analysis of the bubble-induced motion can be made using the particle Stokes number given in equation 1, [31]. When St < 0.1, the particle gravity is negligible and the particle motion represents the fluid behavior well [32].
| (1) |
Where τp is the relaxation time of tracer particle and τf is the characteristic time of fluid, which are given by equations 2 and 3.
| (2) |
| (3) |
Using the density of air for the particle (ρp = 1.29 kg/m3), the density of intact agarose for an upper bound of the liquid (ρl = 1040 kg/m3), the maximum observed residual bubble diameter (dp = 5·10−5 m), the viscosity of water as a lower bound (μl = 8.9·10−4 Pa·s), a characteristic length on the order of the focal zone size (L = 1 mm), and maximum velocity (Ul = 0.1 m/s) we have an upper bound of St = 0.0081. This indicates that the residual bubbles observed in the high speed images will closely follow the liquid flow in the fractionated gel, and can be used as contrast particles for PIV analysis.
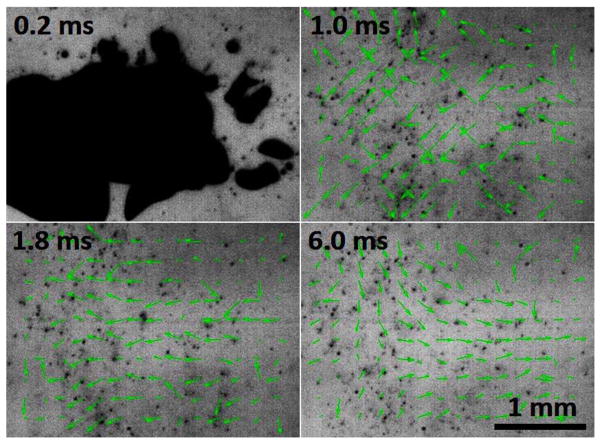
PIV velocity maps showed 2 phases of motion during the 20 ms after a histotripsy therapy pulse. For up to the first 2 ms, chaotic motion was present, where the motion was pointed in all directions in a random manner through this period and was inconsistent from pulse to pulse. This chaotic motion phase likely resulted from the violent activity of the cavitation bubble cloud collapse. After this chaotic motion subsides, a coherent motion along the direction of the therapy ultrasound beam was visible. The coherent motion was first moving away from the therapy transducer, and then rebounding back towards the therapy transducer and oscillating. Fig. 6 shows images of an example progression of the focal region PIV velocity map after the tissue had been treated with 50 histotripsy pulses. The therapy pulse propagated from right to left in these images.
Fig. 6.
High speed images of the focal region 50 pulses into treatment (therapy applied from the right) with PIV velocity map overlays showing the histotripsy bubble cloud (top left), chaotic motion immediately after the collapse of the bubble cloud (top right), and finally coherent motion, including a push away from the transducer (bottom left) and subsequent rebound (bottom right).
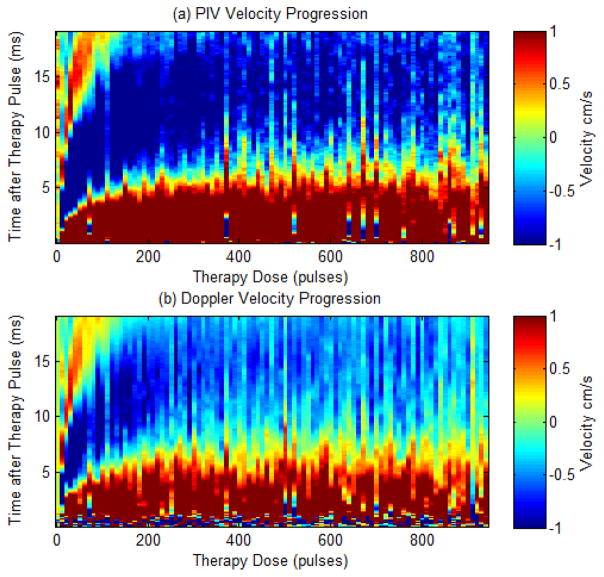
Three treatments of 941 pulses were performed in each of the agarose tissue phantoms, with the bubble-induced motion following the histotripsy pulses monitored using the PIV and color Doppler methods described. Velocity maps collected using both methods show a similar trend, with brief chaotic motion followed by push and rebound motion. Chaotic motion was evident in the Doppler acquisitions as high dispersion in the color Doppler signals. This trend remained the same as the treatment progressed. The duration of these push and rebound motions were observed to increase over the course of histotripsy therapy as the tissue phantom was increasingly fractionated, eventually saturating, likely because the phantom was completely fractionated to liquefied homogenate. The average velocity progression is shown in Fig. 7 for both PIV and BCD methods. The estimated velocity is shown in color (red is away from therapy transducer and blue is towards the therapy transducer) versus the time delay from the onset of the therapy pulse (y axis) and the number of therapy pulses (x axis). Both profiles are shown over the same limited velocity range (−1 cm/s to 1 cm/s) to allow more easy comparison of the changes over the course of treatment.
Fig. 7.
Comparison plots showing the velocity estimates from a single experiment as measured by PIV (a) and Doppler (b) after every 10 therapy pulses. The plots show velocity (color map) versus time after the therapy pulse (y-axis) over the course of therapy (x-axis).
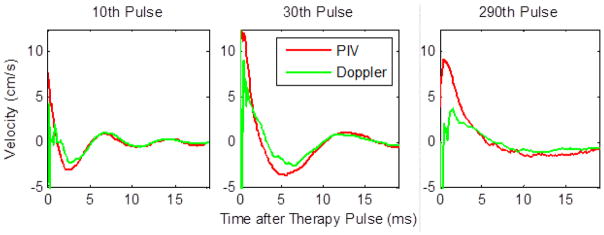
For further comparison of the bubble-induced velocity estimated using PIV versus color Doppler for a specific number of therapy pulse applied, Fig. 8 shows 3 individual velocity traces after 10, 30, and 290 therapy pulses. These traces correspond to vertical lines in the full velocity progressions at the specified dose points.
Fig. 8.
Individual velocity plots for the 19 ms after the therapy pulse after 10 therapy pulses (left), 30 therapy pulses (center), and 290 therapy pulses (right) showing good agreement between PIV and Doppler in measured velocity after the initial chaotic motion.
After the 2 ms chaotic motion phase, PIV and Doppler estimates of the average velocity agree with each other well over the course of treatment with a root mean squared (RMS) error of 0.46 ± 0.06 cm/s. These plots show a temporal expansion of the velocity profile with increased therapy dose, likely resulting from reduced elasticity as the phantom or tissue was increasingly fractionated by histotripsy pulses. The reduced tissue elasticity provides less resistance to the motion, which we hypothesize to be induced by asymmetric growth and/or collapse of cavitation bubbles. With lower resistance, the momentum is carried out longer. In addition, the temporal profile for the bubble growth also elongates in tissue with lower elasticity [33]. This combination may result in the temporal expansion of the velocity and motion observed. Eventually when the treatment tissue or phantom is completely fractionated to liquefied homogenate, the temporal expansion is saturated. For example, tPRV was 2.6, 5.4, and 10.8 ms after 10, 30, and 290 pulses, respectively. The increase in the duration of the coherent push and rebound motion reached a plateau after roughly 250 pulses because the phantom was completely liquefied.
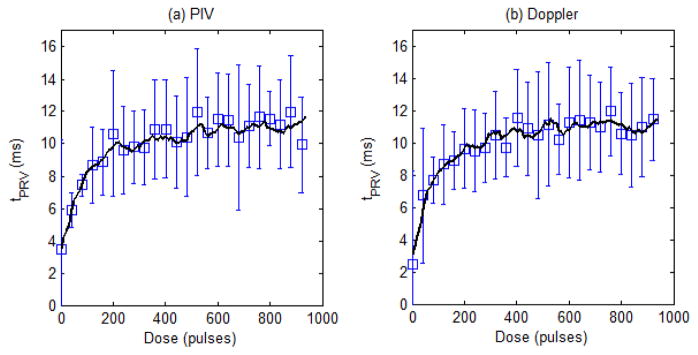
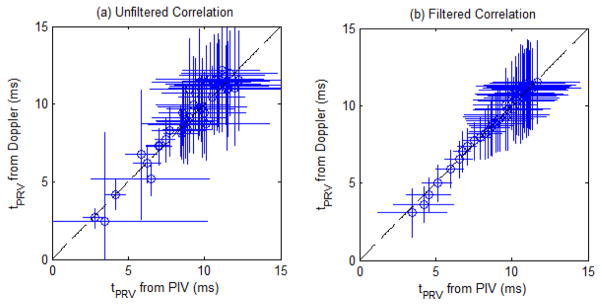
The tPRV metric was computed for the velocity profiles obtained from the 9 treatments using PIV and Doppler data to further validate the Doppler velocity measurements of the bubble-induced motion. Analysis was performed on both the raw metric, along with a 5 point (50 pulse) moving average filtered version to compare the underlying trend in the progression of the tPRV metric. Fig. 9 shows the mean and standard deviation of the raw tPRV metric from the PIV and Doppler analysis, along with the filtered version of each for comparison. The tPRV extracted from PIV and Doppler both increased with increasing therapy dose, saturating after approximately 250 pulses. At doses beyond this saturation point, an increase in pulse to pulse variation within both measurements was observed. The tPRV extracted from PIV and Doppler matched well. Fig. 10 shows the correlation of the raw tPRV metric from both sources, along with the correlation of the filtered metric. The pulse to pulse variation reduced the correlation (R2 = 0.81) for the raw metric, however the underlying trend is clearly the same from the high correlation of the filtered metric (R2 = 0.97).
Fig. 9.
Plots of the tPRV metric from the PIV analysis (a) and the Doppler analysis (b) with mean and standard deviation of the raw metric for every 40th pulse, along with a solid line representing the 5 point (50 pulse) moving average (N = 9).
Fig. 10.
(a) Correlation of the tPRV metric from the PIV and the Doppler analysis. Dashed line: y = x (R2 = 0.81) (N = 9). (b) Correlation of the filtered tPRV metric from the PIV and the Doppler analysis. Dashed line: y = x (R2 = 0.97) (N = 9).
B. Experiment 2 – Correlate BCD with histotripsy-induced fractionation in agarose phantom
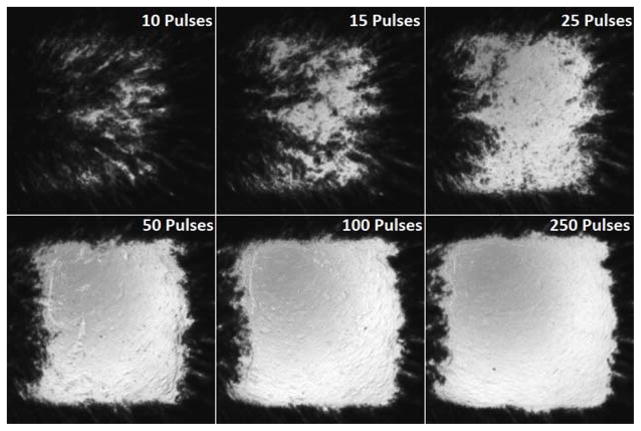
In the agarose tissue phantom, optical images of the RBC layer and BCD velocity profiles were collected after each of the 941 therapy pulses at the center of the treated volume. The RBC phantoms showed rapid fractionation for the first 50 pulses, with slower fractionation up to 120 pulses, when the lesion became completely transparent. Example images of the RBC layer fractionation progression are shown in Fig. 11 after 10, 15, 25, 50, 100, and 250 pulses have been applied to all points in the treatment pattern.
Fig. 11.
Images of the fractionated red blood cell (RBC) layer after 10 (top left), 15 (top middle), 25 (top right), 50 (bottom left), 100 (bottom middle), and 250 (bottom right) therapy pulses have been applied to each focal point in the 219 point focal pattern. Rapid fractionation is observed for the first 50 pulses, after which the lesion was mostly transparent.
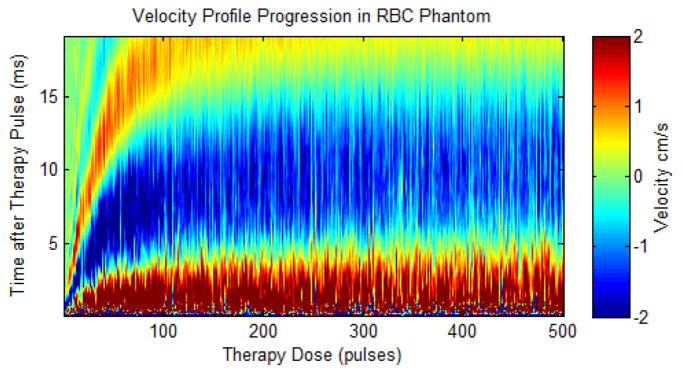
The BCD velocity progression is shown in Fig. 12 over the first 500 pulses of a single treatment. This velocity profile shows the velocity response expand in time for increased therapy dose, reaching a plateau after roughly 250 pulses. Additional therapy beyond this point generates no further change in the average temporal characteristics of the push and rebound motion that can be detected by color Doppler acquisitions.
Fig. 12.
Doppler velocity profile for the first 500 pulses during a single RBC phantom ablation. The plot shows velocity (color map) versus time after the therapy pulse (y-axis) over the course of therapy (x-axis). The estimated velocity is shown in color (red is away from the therapy transducer and blue is towards the therapy transducer) versus the delay from the therapy pulse (y-axis) and therapy dose (x-axis).
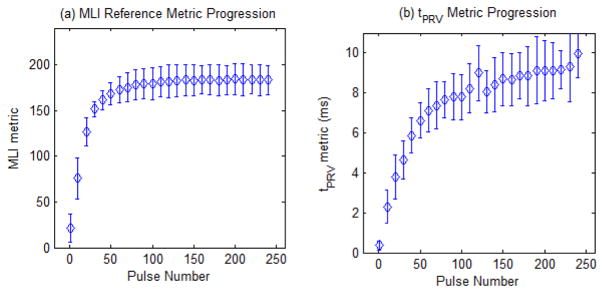
Fractionation metrics were computed from the data for each of the 12 individual RBC layer treatments. From the optical images of the RBC layer, the fractionation metric of mean lesion intensity (MLI) was computed and is plotted over the course of therapy in Fig. 13. This plot shows the area of the fractionation increased and the MLI metric saturated after approximately 120 pulses. At this point, images of the lesion show that all the RBC’s in the layer had been destroyed and no further information could be obtained with this metric. From the BCD velocity data, the time to peak rebound velocity (tPRV) metric was computed for the motion following each therapy pulse. The tPRV metric can be visualized in the full velocity progression (Fig. 12) as the time value (y-axis value) at which the highest negative velocity (darkest blue color) occurs for each value of therapy dose (x-axis value). This metric is plotted in Fig. 13, showing tPRV rapidly increased up to approximately 120 pulses. The increase became gradual after 120 pulses with therapy dose and eventually saturated after approximately 250 pulses, indicating no further change in the bubble induced motion following additional histotripsy therapy pulses. Both metrics were computed for all 1000 therapy pulse, but are displayed with mean and standard deviation for only every 10th pulse for the first 250 pulses for clarity.
Fig. 13.
Progression of the MLI reference metric (a) and tPRV metric (b) over the first 250 pulses of histotripsy therapy in the RBC layer Agarose phantom. Both metrics are plotted with mean and standard deviation (N = 12) for every 10th pulse for pulses 1 to 241 for clarity.
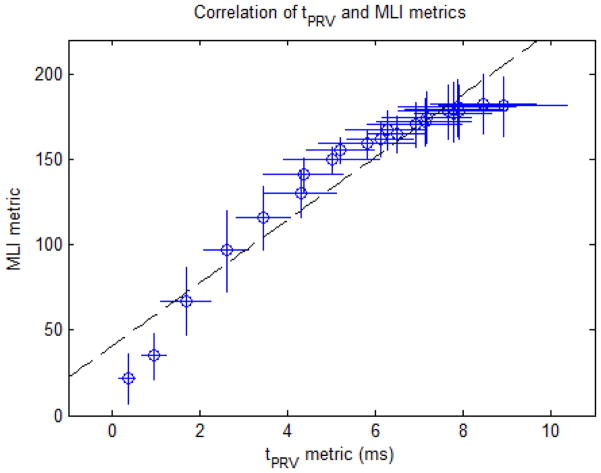
The correlation between these metrics was then computed to determine the validity of the tPRV metric to measure the degree of fractionation of the target tissue and is shown in Fig. 14. This analysis was confined to the first 120 pulses, since the reference metric of fractionation progress (MLI) saturated at this point, providing no additional information about the fractionation progression for additional therapy. A linear correlation was observed between the tPRV metric and the reference MLI metric (R2 = 0.92).
Fig. 14.
MLI metric vs. tPRV metric for the first 120 pulses of therapy in the RBC phantom. Dashed line: y = 18.43•x + 40.83 (R2 = 0.92) (N=12).
C. Experiment 3 – Validate Bubble-induced Color Doppler in Ex Vivo Porcine Liver
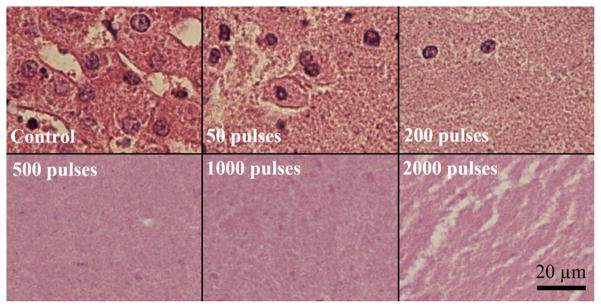
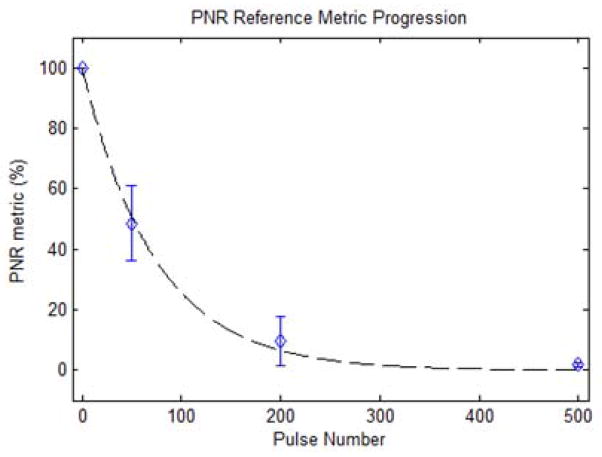
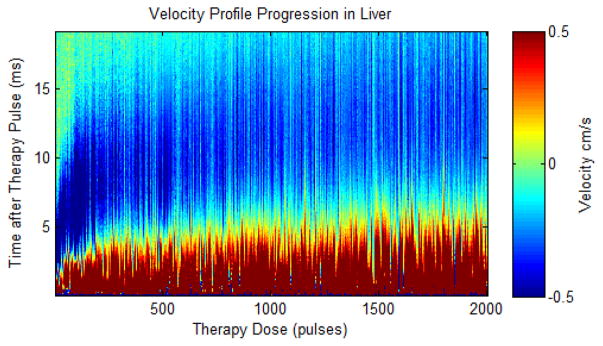
Representative histology of the lesions produced in the ex vivo liver sections are shown in Fig. 15. In the control regions, all tissue and cellular structures appeared normal and structurally intact. At 50 pulses/treatment location applied, fractionation was apparent in the tissue. While some pockets of cells appeared structurally intact with normal appearing cell nuclei, roughly half of the treated region appeared as homogenized acellular debris. At 200 pulses/treatment location, over 90% of tissue structures and cells were destroyed. Only a few scattered nuclei and tissue fragments remained intact. At a larger number of pulses (>500 pulses/treatment location), the treated volume appeared completely homogenized with no recognizable tissue structures or cellular components. Some white streak artifacts are visible in the tissue treated with 2000 pulses. We hypothesize these to be tissue processing artifacts that appear in tissue treated heavily beyond complete cellular fractionation. This could result in decreased effectiveness of the fixative and higher probability for these processing artifacts. The tissues outside the lesion volume appeared structurally intact, with only minor damage pockets scattered around the area very near the edges of the treated region (< 100 micron). The percentage of nuclei remaining (PNR) metric in the treated volume was plotted against the number of therapy pulses in Fig. 16. This percentage decreased exponentially with increasing numbers of therapy pulses (R2 = 0.97), and reached nearly zero shortly after 200 pulses per treatment location. BCD velocity profiles were collected after each of up to 2000 therapy pulses at the center of the treated volume for the 15 ex vivo liver treatments, three for each therapy dose. Fig. 17 shows the average velocity profile over the three 2000 pulse treatment. The BCD profiles in the ex vivo porcine liver were similar to the agarose phantom, with a brief period of chaotic motion followed by coherent push and rebound motions. These coherent motions also expanded in time with increased therapy dose up to 800 pulses, likely due to increasing fractionation leading to complete tissue liquefaction at 800 pulses. After that point, the push duration stayed roughly constant or decreased slightly with increasing number of therapy pulses.
Fig. 15.
Histological sections of the lesions produced with increasing numbers of therapy pulses per treatment location. In the control, all tissue structures and cells appeared structurally intact. After 50 pulses, large volumes of acellular debris were observed, with some pockets of structurally intact cells and nuclei remaining. After 200 pulses, the entire lesion appeared fractionated with few remaining intact nuclei. Beyond this (>500 pulses/treatment location), the treated volume appeared completely homogenized with no recognizable tissue structures and very few fragments of nuclear material.
Fig. 16.
Percentage of structurally intact cell nuclei decreased exponentially with increasing numbers of therapy pulses per treatment location. Dashed line: y = 100•e-0.01362•x (R2 = 0.97).
Fig. 17.
Plot showing the velocity estimates from Doppler after every therapy pulse in a single ex vivo porcine liver treatment. The plot shows velocity (color map) versus time after the therapy pulse (y-axis) over the course of therapy (x-axis). The estimated velocity is shown in color (red is away from the therapy transducer and blue is towards the therapy transducer) versus the delay from the therapy pulse (y axis) and therapy dose (x axis).
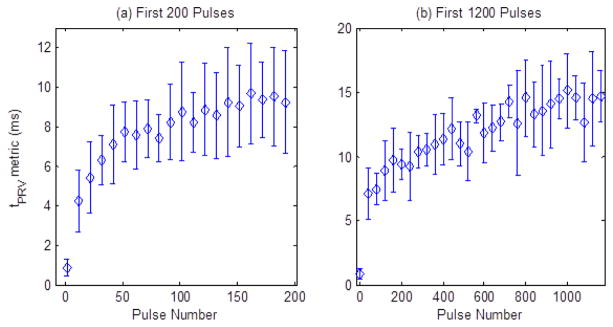
The tPRV metric was computed from the color Doppler data collected during the 2000 pulse ex vivo liver treatments. This metric is plotted in Fig. 18, showing a rapid increase in the tPRV metric for the first 200 pulses, corresponding to the rapid fractionation of 90% of the treated region that was observed histologically at this time point. The tPRV metric continued to slowly increase from 200 to 800 pulses, indicating continued fractionation of the tissue fragments. After approximately 800 pulses, no consistent change in the bubble induced motion following additional histotripsy therapy pulses was observed. The metric was computed for all 2000 therapy pulse, but is displayed with mean and standard deviation for only every 10th pulse for the first 200 pulses (Fig. 18a), and every 40th pulse for the first 1200 pulses (Fig. 18b) for clarity. From 1200 to 2000 pulses, tPRV has a flat trend similar to that shown from 800–1200 pulses.
Fig. 18.
Plots of tPRV metric over the course of therapy in the ex vivo porcine liver tissue. Panel (a) shows the rapid increase in the tPRV metric during the first 200 pulses and panel (b) shows the slower increase from 200 to 800 pulses. Pulses beyond this point generated no significant change in the tPRV metric (N = 3).
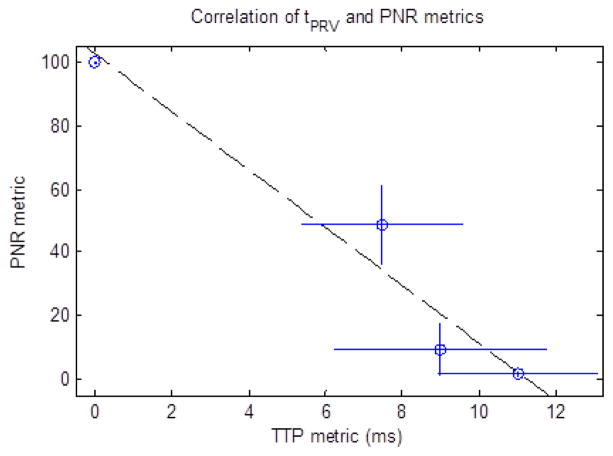
The correlation between the tPRV metric and the PNR metric was then computed to determine the validity of the tPRV metric to measure the degree of fractionation in tissue and is shown in Fig. 19. This analysis was confined to the first 500 pulses, since the reference metric of fractionation progress (PNR) saturated at this point, providing no additional information about the fractionation progression for additional therapy.
Fig. 19.
PNR metric vs. tPRV metric for the first 500 pulses of therapy in the ex vivo liver samples. Dashed line: y = −9.107•x + 102.5 (R2 = 0.95) (N = 3).
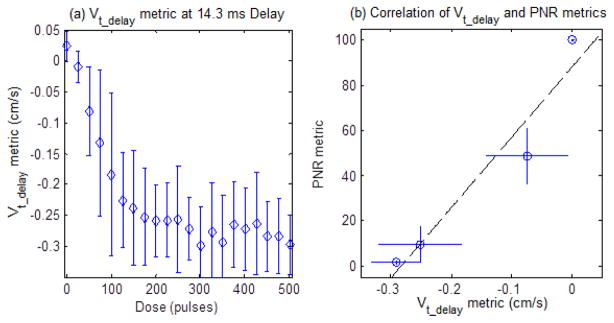
The Vt_delay metric was computed from the BCD data collected during the 2000 pulse ex vivo liver treatments using a 14.3 ms delay from the beginning of each therapy pulse. This metric can be visualized in the full velocity progression (Fig. 12) as the velocity value (color axis) for each value of therapy dose (x-axis) at a fixed time delay of 14.3 ms (y-axis). The pulse to pulse variation in the BCD velocity measurement leads to increased noise in this measurement, for this reason, a 10 point rolling average filter was applied to each individual Vt_delay vs dose trace before comparison. This metric is plotted in Fig. 20 (a) for the first 500 pulses with mean and standard deviation for every 25th pulse for clarity. This delay allowed Vt_delay to behave similarly to the tPRV metric, capturing the rapid increase in the observed velocity for the first 200 pulses, with a slower increase beyond 200 pulses. The correlation between the Vt_delay metric and the PNR metric was then computed to determine the validity of the metric to measure the degree of fractionation in tissue and is shown in Fig. 20(b). This analysis was also confined to the first 500 pulses, due to the saturation of the reference metric of fractionation progress (PNR) at this point. A linear correlation was observed between the tPRV metric and the reference PNR metric (R2 = 0.95).
Fig. 20.
Panel (a) shows the Vt_delay metric at 14.3 ms delay for the first 500 pulses of therapy in the ex vivo liver samples. Panel (b) shows the PNR metric vs. the Vt_delay metric for the first 500 pulses in the ex vivo liver samples. Dashed line: y = 310.7•x + 87.85 (R2 = 0.93) (N = 3).
IV. Discussion
The imaging feedback method proposed in this paper relies on bubble-induced translational motion of the residual cavitation nuclei after each histotripsy pulse long after the cavitation collapse at the therapy focus along the axis of propagation. The source of this motion is not fully understood at this time, but the experiments presented here demonstrate that the phenomenon is consistent and reproducible. Several potential mechanisms have been identified, and are currently being investigated. Based on our recent unpublished data, we hypothesize that the mechanism behind bubble-induced color Doppler is asymmetric expansion of the bubbles during the formation of the bubble cloud or asymmetric collapse of the bubble clouds. Our recent high speed images show that as the individual bubbles form, they grow more along the direction of propagation away from the therapy transducer, generating a net force on the medium away from the transducer. The cumulative effect of many bubbles growing along the ultrasound propagation direction at a very fast rate (up to 100 m/s) could generate the coherent “push” motion with sufficient inertia to generate the oscillatory motion lasting tens of milliseconds as observed in this study. Another potential mechanism is the violent collapse of the histotripsy bubble cloud that could generate the observed motion. Certainly the cloud collapse generates much of the chaotic motion in the focal region that hides the coherent push motion in the first few milliseconds after the histotripsy pulse observed in this study, but it could also generate consistent pushes of the focal region should the transducer geometry produce bubble clouds that consistently collapse asymmetrically away from the therapy transducer. Acoustic radiation force is also a tempting choice for the mechanism behind the type of push-rebound motions observed in this study, however the extremely short pulses (< 2 cycles) are not sufficient to generate the observed motion simply through absorption alone. Moreover, preliminary experiments show no measurable focal velocity (below 0.7 cm/s) at slightly sub-cavitation threshold pulses (~28.7 MPa peak negative pressure). Some combination of these mechanisms is possible, and a comprehensive study is in progress based on these preliminary results to fully elucidate the primary mechanism behind this observed motion.
An important consideration for any real-time feedback on histotripsy fractionation progression is how rapidly these metrics can be computed. The primary metric presented in this work, tPRV, has significant acquisition and computational requirements. The major computational element is the processing of the 190 color Doppler acquisition sets to form the full 20 ms velocity profile at the 0.1 ms time resolution used in this work. A real-time method using these exact techniques would achieve frame rates around 0.25 Hz, though optimization and parallelization could potentially improve this by a factor of 10. Therapy monitoring at this rate would be most useful for volume ablations similar to the 6 mm cube treatment presented in this work, where the treatment progression can be monitored for a single location with the remainder of the lesion treated during processing. Once the monitored location has been sufficiently fractionated, additional probing pulses with BCD feedback could be directed to other points in the treated volume to verify complete treatment over the full lesion. However, it may be necessary in certain applications to gather feedback more rapidly, and for this reason the Vt_delay metric was tested. The Vt_delay metric is essentially a spatial velocity average taken from a standard color Doppler imaging sequence. This metric is currently achievable in real-time at an average rate of 30 Hz on the Verasonics imaging system used in this study. The only requirements are that the color Doppler acquisitions be synchronized and delayed from the therapy pulses by a predetermined amount, and that ultrasound imaging system provides access to the color Doppler data for spatial averaging. The required delay would be determined from preliminary tissue studies, similar to those presented here, in the target tissue to identify an appropriate delay that generates a metric sensitive to the desired therapeutic endpoint. Other metrics, extensions of these metrics, or detectors based on these metrics are also possible from bubble-induced color Doppler feedback including: push or rebound duration metrics, fixed delay peak velocity or zero-crossing detection, and focal mean velocity saturation detection.
Other methods for quantitative histotripsy therapy feedback have been developed previously, including ultrasound backscatter reduction [10, 11], ultrasound shear wave elastography [23], and peak-to-peak displacement of the shear displacement profile (ARFI) [34]. Though the results cannot be directly compared due to the use of a different transducer and therapy pulsing parameters, we are encouraged by the sensitivity of the elasticity metric for detecting histotripsy therapy progress at low therapy doses presented in [23]. We believe that changes to the tissue mechanical properties, especially elasticity, at the focus in response to histotripsy fractionation are the primary cause of the changes to the bubble-induced velocity profile captured by the metrics presented in this work. As a result, these methods produce feedback with similar high sensitivity to histotripsy fractionation damage as shear wave elastography, with the advantage of real-time acquisition during therapy application. This suggests a potential useful advantage of BCD feedback over previous techniques, as each treated point in a lesion can be monitored during treatment and the therapy stopped when fractionation completion is detected.
Although the methods presented here were only tested in ex vivo liver tissue, the principle is likely applicable in other tissues that soften as they are increasingly fractionated by histotripsy pulses. Based on our experience, most soft tissues follow this trend and become increasingly soft until liquefied when treated by histotripsy, including liver [7, 10], prostate [4], heart [8], and thrombus [5]. Although the different tissues begin therapy, and likely end therapy, with varying mechanical properties, it is expected that this softening will result in a temporally expanding velocity profile similar to that observed in liver in this work. Furthermore, we anticipate that metrics extracted from BCD resulting from histotripsy therapy will change as the tissue is increasingly fractionated and eventually saturate when the tissue is completely homogenized. The saturation can provide an indication of complete tissue fractionation, regardless of tissue types, based on our other preliminary results. An important consideration for in vivo treatment of the more mobile organs however, is the potential for clutter in the Doppler velocity measurements from background tissue motion. However, this motion is also a concern for therapy targeting accuracy, and any solution to avoid treating during tissue motion will ensure a stationary tissue during BCD acquisition. Therefore these metrics, or similar metrics from BCD, are potential real-time feedback during any histotripsy therapy application.
V. Conclusion
This study shows that histotripsy pulses generate a consistent bubble-induced motion at the therapy focus. Characteristics of bubble-induced motion can be accurately estimated using standard color Doppler acquisitions as verified by direct comparison with simultaneous optical PIV measurements of the motion in an acoustically and optically transparent agarose gel phantom. The temporal velocity profile of BCD expands and eventually saturates as the tissue is fractionated by histotripsy. This change can be quantified by metrics extracted from BCD acquired during continuous therapy. These metrics are closely correlated to the degree of tissue fractionation in phantoms and ex vivo tissues, providing a potentially useful real-time quantitative feedback on the fractionation progression. Further analysis, targeting a specific tissue and therapeutic endpoint, could refine these methods into a valuable feedback metric for a specific clinical application.
Acknowledgments
Research reported in this publication was supported by the National Institute of Biomedical Imaging And Bioengineering of the National Institutes of Health under Award Numbers R01EB008998 and R21NS093121, a Research Scholar Grant from the American Cancer Society (RSG-13-101-01-CCE), The Hartwell Foundation, National Science Foundation (S10 RR022425), and The Focused Ultrasound Foundation.
The authors would like to thank Drs. Tzu-Yin Wang and Kuang-Wei Lin for their assistance in histological analysis.
Disclosure: Drs. Ryan Miller, Charles Cain and Zhen Xu have financial interest and/or other relationship with HistoSonics Inc.
Biographies
Ryan M. Miller was born in Lansing, MI in 1980. He received the B.S.E. in electrical engineering in 2007, M.S.E. in electrical engineering: systems in 2010, and the Ph.D. degree in biomedical engineering in 2014 from the University of Michigan, Ann Arbor. From 2007 to 2014 he was a research assistant in the Image-Guided Ultrasound Therapy Laboratory at the University of Michigan, Ann Arbor. Since 2014 he has been employed as a Systems Engineer at HistoSonics, Inc. in Ann Arbor, MI. His research interests include histotripsy for pediatric cardiac applications and other indications, ultrasound image guidance, and ultrasound therapy feedback.

Xi Zhang was born and raised in Shaanxi, China. He received the B.S. degree in electrical engineering with the highest honor from Chongqing University, China, in 2011, and the M.S. degree in electrical engineering from the University of Michigan, Ann Arbor in 2013.
He is currently a Ph.D. candidate in the Department of Biomedical Engineering at the University of Michigan, Ann Arbor. His research interests include non-invasive ultrasound therapy, therapy monitoring and feedback, sonothrombolysis, and medical device hardware and software development.
Adam D. Maxwell received the B.S. degree in electrical engineering from the University of Washington in 2006, the M.S. degree in electrical engineering from the University of Michigan in 2007, and the Ph. D. degree in biomedical engineering from the University of Michigan in 2012.
From 2004 to 2006, he was with the Center for Industrial and Medical Ultrasound at the University of Washington, where he was engaged in research on therapeutic ultrasound and lithotripsy. He is currently a postdoctoral fellow in the Department of Urology at the University of Washington. His research interests include focused ultrasound therapies, medical ultrasound transducer development, acoustic cavitation, and nonlinear acoustics.

Charles A. Cain (S’65–M’71–SM’80–F’89) was born in Tampa, FL, on March 3, 1943. He received the B.E.E. (highest honors) degree in 1965 from the University of Florida, Gainesville, FL; the M.S.E.E. degree in 1966 from the Massachusetts Institute of Technology, Cambridge, MA; and the Ph.D. degree in electrical engineering in 1972 from the University of Michigan, Ann Arbor, MI. From 1965 through 1968, he was a member of the Technical Staff at Bell Laboratories, Naperville, IL, where he worked in the electronic switching systems development area. From 1972 through 1989, he was in the Department of Electrical and Computer Engineering at the University of Illinois at Urbana–Champaign, where he was a professor of electrical engineering and bioengineering. Since 1989, he has been in the College of Engineering at the University of Michigan, Ann Arbor, as a professor of biomedical engineering and electrical engineering. He was the chair of the Biomedical Engineering Program from 1989 to 1996, the founding chair of the Biomedical Engineering Department from 1996 to 1999, and the Richard A. Auhll Professor of Engineering in 2002. He has been involved in research on the medical applications of ultrasound, particularly high-intensity ultrasound for noninvasive surgery. He was formerly an associate editor of the IEEE Transactions on Biomedical Engineering and the IEEE Transactions on Ultrasonics, Ferroelectrics, and Frequency Control, and an editorial board member of the International Journal of Hyperthermia and Radiation Research. He is a fellow of IEEE and the American Institute for Medical and Biological Engineer ring (AIMBE).

Zhen Xu (S’05-M’06’) is an Associate Professor in the Department of Biomedical Engineering at the University of Michigan, Ann Arbor, MI. She received the B.S.E. (highest honors) degree in biomedical engineering from Southeast University, Nanjing, China, in 2001, and her M.S. and Ph.D. degrees from the University of Michigan in 2003 and 2005, respectively, both in biomedical engineering. Her research is focusing on ultrasound therapy, particularly the applications of histotripsy for noninvasive surgeries. In 2006, she received IEEE Ultrasonics, Ferroelectrics and Frequency Control Society Outstanding Paper Award; American Heart Association (AHA) Outstanding research in Pediatric Cardiology in 2010; National Institute of Health (NIH) New Investigator Award at the First National Institute of Biomedical Imaging and Bioengineering (NIBIB) Edward C. Nagy New Investigator Symposium in 2011, and Frederic Lizzi Early Career Award from the International Society of Therapeutic Ultrasound (ISTU) in 2015. She is an associated editor for IEEE Transactions on Ultrasonics, Ferroelectrics, and Frequency Control (UFFC).
Contributor Information
Ryan M. Miller, Email: millerrm@umich.edu, University of Michigan, Ann Arbor, MI 48109 USA. He is now with HistoSonics, Inc. Ann Arbor, MI 48103
Xi Zhang, Email: xizh@umich.edu, University of Michigan, Ann Arbor, MI 48109 USA.
Adam Maxwell, Email: maxwell@apl.washington.edu, University of Michigan, Ann Arbor, MI 48109 USA. He is now with the University of Washington, Seattle, WA 98105.
Charles Cain, Email: cain@umich.edu, University of Michigan, Ann Arbor, MI 48109 USA.
Zhen Xu, Email: zhenx@umich.edu, University of Michigan, Ann Arbor, MI 48109 USA.
References
- 1.Parsons JE, Cain CA, Abrams GD, Fowlkes JB. Pulsed Cavitational Ultrasound Therapy For Controlled Tissue Homogenization. Ultrasound in Medicine and Biology. 2006 Jan;32:115–129. doi: 10.1016/j.ultrasmedbio.2005.09.005. [DOI] [PubMed] [Google Scholar]
- 2.Xu Z, Ludomirsky A, Eun LY, Hall TL, Tran BC, Fowlkes JB, Cain CA. Controlled Ultrasound Tissue Erosion. IEEE Transactions on Ultrasonics, Ferroelectrics, and Frequency Control. 2004 Jun;51:726–736. doi: 10.1109/tuffc.2004.1308731. [DOI] [PMC free article] [PubMed] [Google Scholar]
- 3.Hoogenboom M, Eikelenboom D, den Brok MH, Heerschap A, Fütterer JJ, Adema GJ. Mechanical high-intensity focused ultrasound destruction of soft tissue: working mechanisms and physiologic effects. Ultrasound in Medicine and Biology. 2015 Jun;41:1500–1517. doi: 10.1016/j.ultrasmedbio.2015.02.006. [DOI] [PubMed] [Google Scholar]
- 4.Lake AM, Hall TL, Kieran K, Fowlkes JB, Cain CA, Roberts WW. Histotripsy: minimally invasive technology for prostatic tissue ablation in an in vivo canine model. Urology. 2008 Sep;72:682–686. doi: 10.1016/j.urology.2008.01.037. [DOI] [PMC free article] [PubMed] [Google Scholar]
- 5.Maxwell AD, Owens G, Gurum HS, Ives K, Myers DD, Xu Z. Noninvasive treatment of deep venous thrombosis using pulsed ultrasound cavitation therapy (histotripsy) in a porcine model. Journal of Vascular and Inerventional Radiology. 2011 Mar;22:369–377. doi: 10.1016/j.jvir.2010.10.007. [DOI] [PMC free article] [PubMed] [Google Scholar]
- 6.Duryea AP, Hall TL, Maxwell AD, Xu Z, Cain CA, Roberts WW. Histotripsy erosion of model urinary calculi. Journal of Endourology. 2011 Feb;25:341–344. doi: 10.1089/end.2010.0407. [DOI] [PMC free article] [PubMed] [Google Scholar]
- 7.Vlaisavljevich E, Kim Y, Allen S, Owens G, Pelletier S, Cain C, Ives K, Xu Z. Image-guided non-invasive ultrasound liver ablation using histotripsy: feasibility study in an in vivo porcine model. Ultrasound Med Biol. 2013 Aug;39:1398–409. doi: 10.1016/j.ultrasmedbio.2013.02.005. [DOI] [PMC free article] [PubMed] [Google Scholar]
- 8.Owens GE, Miller RM, Ensing G, Ives K, Gordon D, Ludomirsky A, Xu Z. Therapeutic Ultrasound to Noninvasively Create Intracardiac Communications in an Intact Animal Model. Catheterization and Cardiovascular Interventions. 2011;77:580–588. doi: 10.1002/ccd.22787. [DOI] [PMC free article] [PubMed] [Google Scholar]
- 9.Kim Y, Hall TL, Zhen X, Cain CA. Transcranial histotripsy therapy: a feasibility study. Ultrasonics, Ferroelectrics, and Frequency Control, IEEE Transactions on. 2014;61:582–593. [Google Scholar]
- 10.Hall TL, Fowlkes JB, Cain CA. A Real-Time Measure of Cavitation Induced Tissue Disruption by Ultrasound Imaging Backscatter Reduction. IEEE Transactions on Ultrasonics, Ferroelectrics, and Frequency Control. 2007 Mar;54:569–575. doi: 10.1109/tuffc.2007.279. [DOI] [PubMed] [Google Scholar]
- 11.Wang TY, Xu Z, Winterroth F, Hall TL, Fowlkes JB, Rothman ED, Roberts WW, Cain CA. Quantitative Ultrasound Backscatter for Pulsed Cavitational Ultrasound Therapy-Histotripsy. IEEE Transactions on Ultrasonics, Ferroelectrics, and Frequency Control. 2009 May;56:995–1005. doi: 10.1109/tuffc.2009.1131. [DOI] [PMC free article] [PubMed] [Google Scholar]
- 12.Hall TL, Lee GR, Cain CA, Hernandez-Garcia L. Relaxation Properties of Cavitation Induced Tissue Lesions. presented at the Joint Annual Meeting ISMRM (International Society for Magnetic Resonance in Medcine)-ESMRMB (European Society for Magnetic Resonance in Medicine and Biology); 2007. [Google Scholar]
- 13.Parker KJ, Huang SR, Musulin RA, Lerner RM. Tissue response to mechanical vibrations for “sonoelasticity imaging”. Ultrasound in Medicine & Biology. 1990;16:241–246. doi: 10.1016/0301-5629(90)90003-u. [DOI] [PubMed] [Google Scholar]
- 14.Ophir J, Céspedes I, Ponnekanti H, Yazdi Y, Li X. Elastography: A quantitative method for imaging the elasticity of biological tissues. Ultrasonic Imaging. 1991 Apr;13:111–134. doi: 10.1177/016173469101300201. [DOI] [PubMed] [Google Scholar]
- 15.O’Donnell M, Skovoroda AR, Shapo BM, Emelianov SY. Internal Displacement and Strain Imaging Using Ultrasonic Speckle Tracking. IEEE Transactions on Ultrasonics, Ferroelectrics and Frequency Control. 1994 May;41:314–325. [Google Scholar]
- 16.Nightingale K, Soo MS, Nightingale R, Trahey G. Acoustic radiation force impulse imaging: in vivo demonstration of clinical feasibility. Ultrasound in Medicine & Biology. 2002 Feb;28:227–235. doi: 10.1016/s0301-5629(01)00499-9. [DOI] [PubMed] [Google Scholar]
- 17.Sandrin L, Tanter M, Catheline S, Fink M. Shear Modulus Imaging with 2-D Transient Elastography. IEEE Transactions on Ultrasonics, Ferroelectrics, and Frequency Control. 2002 Apr;49:426–435. doi: 10.1109/58.996560. [DOI] [PubMed] [Google Scholar]
- 18.Fatemi M, Greenleaf JF. Probing the dynamics of tissue at low frequencies with the radiation force of ultrasound. Physics in Medicine and Biology. 2000 Jun;45:1449–1464. doi: 10.1088/0031-9155/45/6/304. [DOI] [PubMed] [Google Scholar]
- 19.Shahmirzadi D, Hou GY, Chen J, Konofagou EE. Ex Vivo characterization of canine liver tissue viscoelasticity after high-intensity focused ultrasound ablation. Ultrasound Med Biol. 2014 Feb;40:341–50. doi: 10.1016/j.ultrasmedbio.2013.09.016. [DOI] [PMC free article] [PubMed] [Google Scholar]
- 20.Emelianov SY, Lubinski MA, Weitzel WF, Wiggins RC, Skovoroda AR, O’Donnell M. Elasticity imaging for early detection of renal pathology. Ultrasound in Medicine & Biology. 1995;21:871–883. doi: 10.1016/0301-5629(94)00146-5. [DOI] [PubMed] [Google Scholar]
- 21.Yeh WC, Li PC, Jeng YM, Hsu HC, Kuo PL, Li ML, Yang PM, Lee PH. Elastic modulus measurements of human liver and correlation with pathology. Ultrasound in Medicine & Biology. 2002 Apr;28:467–474. doi: 10.1016/s0301-5629(02)00489-1. [DOI] [PubMed] [Google Scholar]
- 22.Krouskop TA, Wheeler TM, Kallel F, Garra BS, Hall T. Elastic moduli of breast and prostate tissues under compression. Ultrasonic Imaging. 1998 Oct;20:260–274. doi: 10.1177/016173469802000403. [DOI] [PubMed] [Google Scholar]
- 23.Wang TY, Hall TL, Xu Z, Fowlkes JB, Cain CA. Imaging Feedback of Histotripsy Treatments Using Ultrasound Shear Wave Elastography. IEEE Transactions on Ultrasonics, Ferroelectrics, and Frequency Control. 2012 Jun;59:1167–1181. doi: 10.1109/tuffc.2012.2307. [DOI] [PMC free article] [PubMed] [Google Scholar]
- 24.Lu W, Sapozhnikov OA, Bailey MR, Kaczkowski PJ, Crum LA. Evidence for trapped surface bubbles as the cause for the twinkling artifact in ultrasound imaging. Ultrasound in Medicine & Biology. 2013 Jun;39:1026–1038. doi: 10.1016/j.ultrasmedbio.2013.01.011. [DOI] [PMC free article] [PubMed] [Google Scholar]
- 25.Tong L, Khokhlova T, Sapozhnikov O, O’Donnell M, Hwang J. A new active cavitation mapping technique for pulsed HIFU applications-bubble doppler. Ultrasonics, Ferroelectrics, and Frequency Control, IEEE Transactions on. 2014;61:1698–1708. doi: 10.1109/TUFFC.2014.006502. [DOI] [PMC free article] [PubMed] [Google Scholar]
- 26.Khokhlova TD, Canney MS, Khokhlova VA, Sapozhnikov OA, Crum LA, Crum MR, Bailey MR. Controlled tissue emulsification produced by high intensity focused ultrasound shock waves and millisecond boiling. Journal of the Acoustical Society of America. 2011 Nov;130:3498–3510. doi: 10.1121/1.3626152. [DOI] [PMC free article] [PubMed] [Google Scholar]
- 27.Wang TY, Xu Z, Hall TL, Fowlkes JB, Cain CA. An efficient treatment strategy for histotripsy by removing cavitation memory. Ultrasound in Medicine & Biology. 2012 May;38:753–66. doi: 10.1016/j.ultrasmedbio.2012.01.013. [DOI] [PMC free article] [PubMed] [Google Scholar]
- 28.Garcia D, del Alamo JC, Tanne D, Yotti R, Cortina C, Bertrand E, Antoranz JC, Perez-David E, Rieu R, Fernandez-Aviles F, Bermejo J. Two-Dimensional Intraventricular Flow Mapping by Digital Processing Conventional Color-Doppler Echocardiography Images. IEEE Transactions on Medical Imaging. 2010 Oct;29:1701–1713. doi: 10.1109/TMI.2010.2049656. [DOI] [PubMed] [Google Scholar]
- 29.Parsons JE, Cain CA, Fowlkes JB. Cost-effective Assembly of a Basic Fiberoptic Hydrophone for measurement of High-Amplitude Therapeutic Ultrasound Fields. Journal of the Acoustical Society of America. 2006 Mar;119:1432–1440. doi: 10.1121/1.2166708. [DOI] [PubMed] [Google Scholar]
- 30.Maxwell AD, Wang TY, Yuan L, Duryea AP, Xu Z, Cain CA. A Tissue Phantom For Visualization and Measurement of Ultrasound-Induced Cavitation Damage. Ultrasound in Medicine & Biology. 2010;36:2132–2143. doi: 10.1016/j.ultrasmedbio.2010.08.023. [DOI] [PMC free article] [PubMed] [Google Scholar]
- 31.Ortiz-Villafuerte J, Schmidl WD, Hassan YA. Three-dimensional ptv study of the surrounding flow and wake of a bubble rising in a stagnant liquid. Experiments in Fluids. 2000 Dec 01;29:S202–S210. [Google Scholar]
- 32.Brandon DJ, Aggarwal SK. A Numerical Investigation of Particle Deposition on a Square Cylinder Placed in a Channel Flow. Aerosol Science and Technology. 2001 Jan 01;34:340–352. [Google Scholar]
- 33.Vlaisavljevich E, Lin KW, Warnez MT, Singh R, Mancia L, Putnam AJ, Johnsen E, Cain C, Xu Z. Effects of tissue stiffness, ultrasound frequency, and pressure on histotripsy-induced cavitation bubble behavior. Physics in Medicine and Biology. 2015 Mar;60:2271–2292. doi: 10.1088/0031-9155/60/6/2271. [DOI] [PMC free article] [PubMed] [Google Scholar]
- 34.Wang T-Y, Hall TL, Xu Z, Fowlkes JB, Cain CA. Imaging feedback for histotripsy by characterizing dynamics of acoustic radiation force impulse (ARFI)-induced shear waves excited in a treated volume. IEEE Transactions of Ultrasonics, Ferroelectrics, and Frequency Control. doi: 10.1109/TUFFC.2014.3013. In Submission. [DOI] [PubMed] [Google Scholar]


