

Abstract
Objectives
Children with asthma and allergies—particularly food and/or multiple allergies–are at risk for adverse asthma outcomes. This analysis describes allergy prevalence trends among US children by asthma status.
Methods
We analyzed 2001–2013 National Health Interview Survey data for children aged 0–17 years. We estimated trends for reported respiratory, food, and skin allergy and the percentage of children with one, two, or all three allergy types by asthma status. We estimated unadjusted trends, and among children with asthma, adjusted associations between demographic characteristics and allergy.
Results
Prevalence of any allergy increased by 0.3 percentage points annually among children without asthma but not among children with asthma. However, underlying patterns changed among children with asthma: food and skin allergy prevalence increased as did the percentage with all three allergy types. Among children with asthma, risk was higher among younger and non-Hispanic black children for reported skin allergy, among non-Hispanic white children for reported respiratory allergy, and among nonpoor children for food and respiratory allergies. Prevalence of having one allergy type decreased by 0.50 percentage points annually, while the percent with all three types increased 0.2 percentage points annually. Non-poor and non-Hispanic white children with asthma were more likely to have multiple allergy types.
Conclusions
While overall allergy prevalence among children with asthma remained stable, patterns in reported allergy type and number suggested a greater proportion may be at risk of adverse asthma outcomes associated with allergy: food allergy increased as did the percentage with all three allergy types.
Keywords: Epidemiology, Pediatrics
INTRODUCTION
Asthma and allergies are sometimes considered nearly synonymous, but the relationship between them is complex.(1) Asthma is included in the childhood “allergic march” model where development of atopic dermatitis in early childhood is accompanied or followed by onset of food allergies and then by allergic rhinitis and asthma.(2, 3) Although this pattern is not universal, atopic dermatitis and allergic rhinitis diagnosed at early ages have been shown to be predictive of future development of asthma.(4–6) In addition, many studies show that allergies are associated with increased asthma severity (7–9) and morbidity including hospitalizations and use of systemic steroids.(10–16) However, patterns of morbidity differ by allergy type.(13) In particular, sensitization to multiple allergens and having a food allergy are risk factors for severe asthma exacerbations and death.(11, 16, 17)
Given the prominence of allergy in the development of asthma and subsequent asthma morbidity, assessing the epidemiology of allergy prevalence among children with asthma can help clarify the burden posed by allergies. The epidemiology of asthma and allergy has changed over the past two decades, with increased prevalence of asthma and certain types of allergies.(18–20) We used nationally representative data to assess three major allergy types reported among children (food, skin, and respiratory) and the percentage of children with multiple allergy types by asthma status. We sought to compare recent national trends in reported allergy prevalence among children with asthma to those without asthma given that allergy prevalence has also changed in the pediatric population as a whole. An additional objective was to assess the demographic characteristics associated with each allergy type and with having multiple allergies among children with asthma. While trends in asthma and allergy prevalence have been assessed separately, the epidemiology of allergies among children with asthma has not been assessed among a nationally representative sample.
METHODS
We analyzed nationally representative 2001–2013 data for consecutive cross-sectional samples of children aged 0–17 years surveyed in the National Health Interview Survey (NHIS). The NHIS is conducted by the National Center for Health Statistics (NCHS) and is a face-to-face household interview of respondents included in a multistage, clustered sample of the noninstitutionalized civilian US population.(21) In each sampled family, if children were present, a responsible adult served as a proxy respondent for a randomly chosen sample child. Final response rates for sample children ranged from 70% to 81% for the survey years included in the study. The NCHS Institutional Review Board approved data collection for the NHIS for each year the survey was conducted.
Asthma and allergy prevalence
Data in the NHIS on current asthma prevalence are available from 2001 onward, and we analyzed data for children who participated in cross-sectional annual samples from 2001 to 2013. Current asthma status was based on affirmative responses to both, “Has a doctor ever told you that your child had asthma?” and “Does your child still have asthma?” Food allergy status was based on affirmative responses to “During the past 12 months, did your child have any kind of food or digestive allergy?” Skin allergy status was determined from responses to, “During the past 12 months, has your child had eczema or any kind of skin allergy?” Respiratory allergy status was based on affirmative responses to either, “During the past 12 months, has your child had hay fever?” and/or, “During the past 12 months, has your child had any kind of respiratory allergy?”
Demographic characteristics
We analyzed age in three categories to capture distinct patterns of asthma prevalence: 0–4 years of age (when transient wheezing is more common),(22) 5–9 years of age (when asthma prevalence is higher among males), and 10–17 years of age (when asthma prevalence increases among females compared to males).(23) Race/ethnicity was categorized into 6 mutually exclusive categories for which there was sufficient sample size for analysis: non-Hispanic white, non-Hispanic black, other non-Hispanic (including Asian and American Indian/Alaska Native), Mexican, Puerto Rican and other Hispanic. Urbanicity was categorized as residence in a principal city of a metropolitan statistical area (MSA), in a MSA outside the principal city, or outside an MSA. Family structure was defined as single parent, or more than one adult in the household. Poverty status was defined using the ratio of family income to the federal poverty level (FPL): family income <100%, 100–<200% and ≥200% FPL.(24)
Missing responses
Missing responses for asthma and allergy questions were excluded from the study (0.9% of records). Missing responses for race (<1% in each survey year) were imputed by NCHS.(21) For 20.5% of the eligible sample, exact family income was not reported. We used NCHS-provided multiply imputed values for missing income according to the recommended methodology.(25)
Analysis
Data were analyzed using SAS 9.3 to calculate national estimates using the provided survey weights. To account for the complex survey sampling design, variance estimates for frequencies and multiple regression results were calculated with SUDAAN and for negative binominal regression with STATA.(26) Trends were assessed using logistic regression with record-level data to estimate the average percentage point (absolute) change per year using predicted margins. We then deconstructed overall trends within groups of children with and without asthma to determine how the overall trends for each group could be explained in terms of the types of allergies reported and the number of allergies reported.
We were specifically interested in describing the association between demographic covariates and prevalence of different allergy types among children with asthma given the potentially greater clinical implications of allergy status among this group.(7–16) Therefore, we limited subsequent analyses to children with current asthma and used separate multiple logistic regression models with each allergy type as the dependent variable and the covariates mentioned above and continuous time in years as independent variables. We assessed interaction terms between time and age group and race/ethnicity to examine whether trends for each allergy type differed by subgroup, but found no significant interactions. To assess the association between demographic characteristics and trends in prevalence of having multiple allergies, we fitted a negative binominal model with the number of allergies reported for each sample child (zero, one, two, or three types of allergies) and demographic variables and time in years as independent variables. Negative binomial regression accounts for overdispersion of count outcome variables. We estimated adjusted marginal means for number of allergy types and report significant differences compared to the referent group at the p<0.05 level.
RESULTS
Demographic characteristics of children with and without asthma are shown in Table 1 for the time period covered in the analysis. Children with asthma were more likely to be older, male, non-Hispanic black or Puerto Rican, live in a single-parent household, have family income below the federal poverty level (FPL), and reside in the Northeast compared to children without asthma. Children with asthma were less likely to be of Mexican ethnicity and to reside in the West. The prevalence of any type of reported allergy (food, skin and/or respiratory) was higher among children with asthma in 2013 (59% among children with asthma versus 24% among children without asthma), but the prevalence of any allergy among children without asthma grew by an average 0.31 percentage points per year from 2001 to 2013 (p<0.0001) compared to remaining stable among children with asthma (data not shown). During this period, the prevalence of asthma increased by an average 0.06 percentage points per year from 2001 to 2013 (see Supplemental Figure).
Table 1.
Characteristics by asthma status, children 0–17 years of age, United States 2001–2013
| Asthma | No asthma | p-valuea | |
|---|---|---|---|
| n | 13736 | 137754 | – |
| Percent (SE)b | |||
| Total | 8.91 (0.05) | 91.09 (0.10) | <0.001 |
| Age (mean years, SD) | 9.56 (0.05) | 8.44 (0.02) | <0.001 |
| Sex | |||
| Male | 57.87 (0.54) | 50.42 (0.18) | <0.001 |
| Race/ethnicity | |||
| Non-Hispanic white | 51.02 (0.65) | 57.76 (0.35) | <0.001 |
| Non-Hispanic black | 22.76 (0.53) | 13.52 (0.23) | |
| Other non-Hispanic | 7.69 (0.34) | 7.61 (0.17) | |
| Puerto Rican | 4.00 (0.22) | 1.67 (0.05) | |
| Mexican | 10.28 (0.35) | 14.72 (0.28) | |
| Other Hispanic | 4.26 (0.19) | 4.72 (0.09) | |
| Family structure | |||
| Single parent | 23.41 (0.47) | 15.75 (0.17) | <0.001 |
| Poverty status | |||
| <100% FPL | 26.94 (0.55) | 19.36 (0.23) | <0.001 |
| 100–<200% FPL | 23.29 (0.49) | 22.60 (0.19) | |
| ≥200% FPL | 50.77 (0.62) | 58.04 (0.31) | |
| Urbanicity | |||
| Core metropolitan | 32.20 (0.73) | 29.82 (0.50) | <0.001 |
| Non-core metropolitan | 51.22 (0.84) | 52.91 (0.62) | |
| Non-metropolitan | 16.58 (0.65) | 17.28 (0.51) | |
| Region | |||
| Northeast | 19.51 (0.54) | 16.77 (0.31) | <0.001 |
| Midwest | 23.89 (0.61) | 23.43 (0.33) | |
| South | 37.37 (0.63) | 36.40 (0.37) | |
| West | 19.23 (0.55) | 23.40 (0.37) | |
| Allergy prevalence (2013)c | |||
| Any allergy | 59.0 (1.9) | 24.1 (0.5) | <0.001 |
| Food allergy | 14.1 (1.3) | 4.9 (0.3) | <0.001 |
| Skin allergy | 25.5 (1.7) | 10.6 (0.4) | <0.001 |
| Respiratory allergy | 48.0 (2.0) | 13.3 (0.4) | <0.001 |
Data source: CDC/NCHS, National Health Interview Survey
FPL: federal poverty level
p-value for chi-square test for all variables except age, for which a t-test was used to compare means.
All estimates in table are percent and standard error except for age for which mean number of years and standard deviation are shown.
Percent of children in 2013 only.
Trends for each reported allergy type are shown in Figure 1. Among children with asthma, the percentage of children with food allergy and skin allergy increased by 0.44 percentage points per year and 0.71 percentage points per year respectively, but the percentage of children with respiratory allergy declined by 0.51 percentage points per year (p<0.001 for all trends). Among children without asthma, the percentage of children with food allergy and skin allergy increased by 0.16 percentage points per year and 0.33 percentage points per year respectively. The percentage of children without asthma with respiratory allergy declined by an average 0.08 percentage points per year (p<0.05 for all trends).
Figure 1.
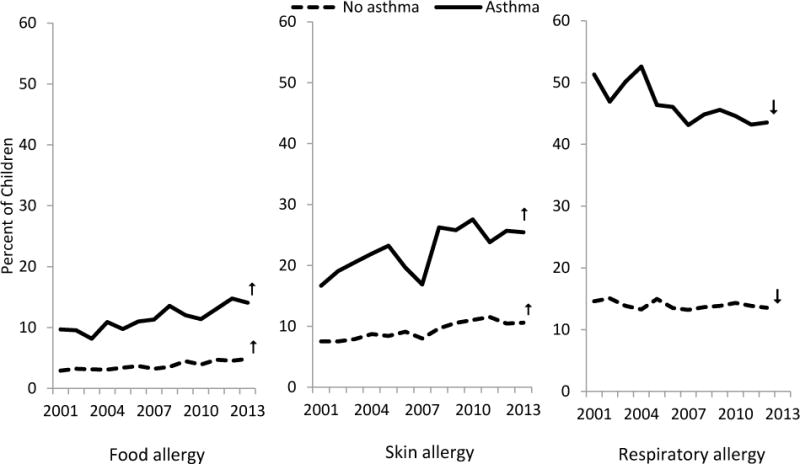
Children with food, skin and respiratory allergy, by asthma status
Data source: National Health Interview Survey
Note: ↑ and ↓ denote significantly changing trends.
We assessed demographic characteristics associated with each reported allergy type among children with asthma using adjusted logistic regression models (Table 2). Mexican children were significantly less likely to have a food allergy reported compared to non-Hispanic white children, and children with family income <100% FPL were less likely than those with family income ≥200% FPL to have a food allergy. For skin allergy among children with asthma, the risk was higher among children 0–4 years and 5–9 years of age compared to 10–17 year olds, and higher among non-Hispanic black while lower among Mexican compared to non-Hispanic white children. Skin allergy was also lower in the Northeast, Midwest and South compared to the West. Finally, for respiratory allergy among children with asthma, the risk was lower among 0–4 compared to 10–17 year olds, lower among all race/ethnic groups compared to non-Hispanic white children, lower among children with family income <100% FPL and 100% – <200% FPL than children with ≥200% FPL, and higher in the South compared to the West. The risk ratios for 2013 versus 2001 reflect the growing prevalence of reported food and skin allergies among children with asthma, and the declining prevalence of respiratory allergies.
Table 2.
Adjusted risk ratio and 95% confidence interval for allergy type among children with asthma (n=13736) ages 0–17 years, United States, 2001–2013
| n | Food allergy | Skin allergy | Respiratory allergy | |
|---|---|---|---|---|
| Age group | ||||
| 0–4 years | 2479 | 1.18 (1.00, 1.39) | 1.38 (1.24, 1.54) | 0.79 (0.74, 0.85) |
| 5–9 years | 3994 | 1.15 (1.00, 1.33) | 1.27 (1.16, 1.39) | 0.97 (0.92, 1.02) |
| 10–17 years | 7263 | Ref | Ref | Ref |
| Sex | ||||
| Male | 7920 | 0.96 (0.85, 1.09) | 0.96 (0.89, 1.04) | 1.05 (1.00, 1.09) |
| Female | 5816 | Ref | Ref | Ref |
| Race/ethnicity | ||||
| Non-Hispanic black | 3445 | 0.88 (0.74, 1.04) | 1.13 (1.02, 1.25) | 0.73 (0.68, 0.78) |
| Other non-Hispanic | 1080 | 1.07 (0.86, 1.33) | 1.10 (0.95, 1.29) | 0.85 (0.78, 0.94) |
| Puerto Rican | 714 | 0.87 (0.64, 1.18) | 1.12 (0.93, 1.36) | 0.73 (0.65, 0.83) |
| Mexican | 1882 | 0.63 (0.49, 0.80) | 0.70 (0.60, 0.82) | 0.85 (0.78, 0.92) |
| Other Hispanic | 869 | 0.89 (0.68, 1.16) | 1.00 (0.83, 1.20) | 0.84 (0.76, 0.94) |
| Non-Hispanic white | 5746 | Ref | Ref | Ref |
| Family structure | ||||
| Single parent | 3597 | 1.06 (0.91, 1.23) | 1.08 (0.98, 1.20) | 1.03 (0.98, 1.09) |
| ≥2 adult family | 10139 | Ref | Ref | Ref |
| Poverty status | ||||
| <100% FPL | 3483 | 0.75 (0.63, 0.91) | 0.90 (0.80, 1.02) | 0.84 (0.79, 0.90) |
| 100–<200% FPL | 3236 | 0.83 (0.69, 1.00) | 1.01 (0.91, 1.12) | 0.88 (0.82, 0.93) |
| ≥200% FPL | 7017 | Ref | Ref | Ref |
| Urbanicity | ||||
| Core metropolitan | 4996 | 1.12 (0.91, 1.37) | 1.11 (0.97, 1.27) | 0.94 (0.97, 1.01) |
| Non-core metro | 6572 | 1.08 (0.91, 1.29) | 1.09 (0.95, 1.24) | 0.96 (0.90, 1.03) |
| Non-metropolitan | 2168 | Ref | Ref | Ref |
| Region | ||||
| Northeast | 2705 | 0.91 (0.75, 1.10) | 0.76 (0.66, 0.87) | 0.92 (0.85, 1.00) |
| Midwest | 2753 | 0.83 (0.68, 1.02) | 0.87 (0.77, 0.99) | 0.97 (0.89, 1.05) |
| South | 5228 | 0.91 (0.77, 1.08) | 0.85 (0.76, 0.96) | 1.14 (1.07, 1.22) |
| West | 3050 | Ref | Ref | Ref |
| Yeara | ||||
| 2013 versus 2001 | 1.69 (1.41, 2.03) | 1.48 (1.30, 1.68) | 0.91 (0.85, 0.98) | |
Data source: CDC/NCHS, National Health Interview Survey
FPL: federal poverty level
Year was modeled continuously. SUDAAN only calculates adjusted risk ratios comparing two specified values of continuous variables, and thus, the period endpoints were chosen to reflect the modeled change over the entire period.
We also assessed trends in the number of allergy types among children by asthma status (Figure 2). Children with asthma had a declining trend in prevalence of having only one allergy (an average 0.50 percentage point decline per year for a prevalence of 35% in 2013), an average annual 0.10 percentage point increase in the prevalence of having two allergies, and an average increase in the percentage of children with three allergies by 0.20 percentage points per year. Among children without asthma, there was an increasing prevalence (average 0.21 percentage point increase per year) of children with only one allergy, an average increase of 0.1 percentage points per year in the percentage of children with two allergies, and no significant change in the percentage of children with three allergies.
Figure 2.
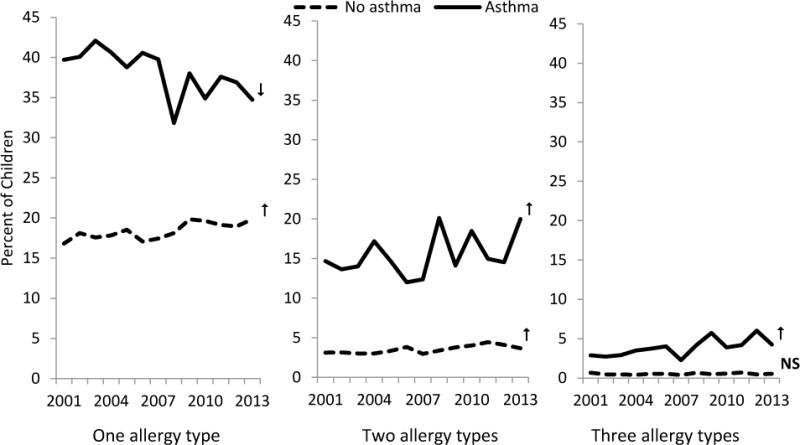
Children with one, two or three types of allergy, by asthma status
Data source: National Health Interview Survey
Note: ↑ and ↓ denote significantly changing trends. NS denotes no statistically significant change in trend.
The percentage of children with asthma with respiratory, food and skin allergies is shown in Figure 3 for 2001–2002 and 2012–2013. Although the prevalence of having any allergy was similar between the two time periods (43.2% of children with asthma had no allergy in 2001–2002 and 41.8% in 2012–2013), 2.8% of children with asthma had all three allergy types in 2001–2002 versus 5.2% in 2012–2013. Table 3 shows the adjusted mean number of allergy types among subgroups of children with asthma. Although means between subgroups were similar, there were some significant differences. Children with asthma who were aged 5–9 years had a higher mean number of allergies compared to 10–17 year olds. Non-Hispanic black, Puerto Rican, Mexican, and other Hispanic children had lower mean numbers of allergy types than non-Hispanic white children. Children with family income <100% and 100–<200% FPL had a lower mean number of allergy types compared to children with family income ≥200% FPL. By region, children with asthma living in the Northeast and Midwest had a lower mean number of allergy types compared to children in the West. Finally, there was a significant increase in the mean number of allergy types across the period 2001–2013.
Figure 3.
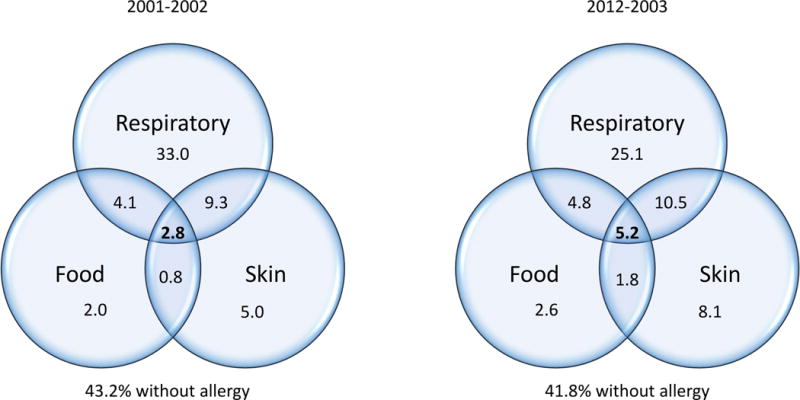
Prevalence of allergy type among children with asthma, 2001–2002 and 2012–2013
Figure not drawn to scale.
Table 3.
Adjusted mean number of allergy typesa for among children 0–17 years with asthma, United States, 2001–2013
| Mean number of allergy types (SE) | ||
|---|---|---|
| Age group | 0–4 years | 1.79 (0.02) |
| 5–9 years | 1.85* (0.02) | |
| 10–17 years (ref) | 1.80 (0.01) | |
| Sex | Female | 1.81 (0.01) |
| Male (ref) | 1.81 (0.01) | |
| Race/ethnicity | Non-Hispanic white (ref) | 1.86 (0.01) |
| Non-Hispanic black | 1.75* (0.02) | |
| Other non-Hispanic | 1.82 (0.03) | |
| Puerto Rican | 1.74* (0.04) | |
| Mexican | 1.67* (0.02) | |
| Other Hispanic | 1.76* (0.04) | |
| Family structure | Single parent | 1.85 (0.02) |
| ≥2 adult family (ref) | 1.80 (0.01) | |
| Poverty status | <100% FPL | 1.72* (0.02) |
| 100–<200% FPL | 1.77* (0.02) | |
| ≥200% FPL (ref) | 1.85 (0.01) | |
| Urbanicity | Core metropolitan | 1.81 (0.02) |
| Non-core metropolitan | 1.81 (0.01) | |
| Non-metropolitan (ref) | 1.80 (0.02) | |
| Region | Northeast | 1.73* (0.02) |
| Midwest | 1.77* (0.02) | |
| South | 1.86 (0.02) | |
| West (ref) | 1.84 (0.02) | |
| Year** | 2001 (ref) | 1.74 (0.01) |
| 2002 | 1.76 (0.01) | |
| 2003 | 1.76 (0.01) | |
| 2004 | 1.77 (0.01) | |
| 2005 | 1.78 (0.01) | |
| 2006 | 1.79 (0.01) | |
| 2007 | 1.80 (0.01) | |
| 2008 | 1.81 (0.01) | |
| 2009 | 1.82 (0.01) | |
| 2010 | 1.83 (0.01) | |
| 2011 | 1.84 (0.01) | |
| 2012 | 1.84 (0.02) | |
| 2013 | 1.85 (0.02) | |
Data source: CDC/NCHS, National Health Interview Survey
FPL: federal poverty level
Negative binomial regression adjusted for all other covariates shown in the table.
p<0.05 for comparison with referent group in the category
Year entered into the model as a continuous value, but marginal mean values by year shown. Overall, the mean number of allergy types increased significantly across years with p<0.001.
DISCUSSION
The percent of children without asthma who had any allergy increased from 2001 to 2013 by 1.4% per year while there was no trend in prevalence of having any allergy among children with asthma. Examining both type and number of allergies helps to provide greater detail to this finding. Among children without asthma, food and skin allergy prevalence increased while there was no significant trend in respiratory allergy. Among children with asthma, the increasing trends in food and skin allergy prevalence were offset by declining respiratory allergy prevalence. By number of allergy types, children without asthma had an increasing trend in the prevalence of having one and two types of allergies. Among children with asthma, the decline in the percentage of children with only one allergy type was offset by the increase in the percentage of children with all three allergy types.
These observed trends in increasing reported food allergy and multiple allergies may suggest that the risk profile among children with asthma may have changed despite the overall stable prevalence among this group of having any allergy. Certain allergy profiles may indicate higher risk for adverse outcomes for children with asthma.(7–16) In particular, higher prevalence of food allergy and sensitization to multiple allergens among children with more severe asthma has been previously observed.(16, 17) Furthermore, persistence of wheezing beyond early childhood is associated with receiving a medical diagnosis of a skin allergy (eczema), as opposed to transient wheezing that resolves after infancy and toddlerhood which is less likely to be associated with allergies.(4) Co-existent asthma and eczema may also have implications for choice in controller medication to step up therapy to better control asthma.(29)
A multivariate analysis among children with asthma assessing association of demographic characteristics with allergy showed that food allergy was associated with nonpoor income status, and that the mean number of allergy types was higher among non-Hispanic white children and those with nonpoor income status. These patterns may be surprising, given that these risk factors do not align with those for adverse asthma outcomes (minority race and low income).(18, 30) However, the underlying factors for adverse outcomes may vary between race/ethnic and socioeconomic subgroups, and understanding the epidemiology of various risk factors helps inform interventions designed to reduce morbidity among all children.
Our findings are subject to limitations. We used cross-sectional annual data sets in this analysis, and therefore no causation can be assumed to underlie the associations observed. The data gathered on children in NHIS are based on proxy report by an adult knowledgeable about the health status of the sample child. While asthma status is determined by asking a question about receiving a diagnosis from a health professional, allergy status is not anchored to a question about a medical diagnosis, nor is there guidance provided to respondents about what constitutes an allergy. Furthermore, food allergy is best established based on oral food challenges, but no nationally representative studies of this outcome have been conducted.(31) However, food allergy prevalence estimates from the NHIS are similar to those from a much smaller, but more detailed and specific survey.(32) Additionally, the 2007 National Survey of Children’s Health (NSCH) did include receiving a doctor’s diagnosis in questions about the same three types of allergies, and NSCH estimates were the same or slightly higher compared to NHIS estimates.(33) Also, NHIS estimates of food allergy prevalence among all children are lower than the food allergy prevalence estimate of 8% based on a review of several sources that also concluded that food allergy prevalence is increasing.(31) An additional limitation regarding specificity of the survey questions is that the NHIS does not contain any information the specific allergies included in the three allergy types (e.g., peanut versus milk, tree pollen versus mold) which could give greater insight into the associated risk of morbidity for children with asthma. Finally, smaller samples of for allergy types and counts among children with asthma may have limited our ability to detect significant differences, particularly for lower prevalence conditions such as food allergy and having all three allergy types.
In sum, nationally representative data over the past decade suggest that the profile of allergy prevalence is changing for both children with and without asthma. While children with asthma were no more likely to have any allergy in 2013 compared with 2001, they were more likely to have a food or skin allergy (like children without asthma), but less likely to have a respiratory allergy (in contrast to children without asthma). Children with asthma were also more likely in 2013 than 2001 to have all three allergy types.
Supplementary Material
Abbreviations
- APC
average annual percent change
- ARR
adjusted risk ratio
- FPL
federal poverty level
- MSA
metropolitan statistical area
- NCHS
National Center for Health Statistics
- NHIS
National Health Interview Survey
- NSCH
National Survey of Children’s Health
Footnotes
Declaration of interest:
The authors report no conflicts of interest. The authors alone are responsible for the content and writing of the paper. No external funding was sought or obtained to support the work described in the manuscript.
References
- 1.Sun HL, Yeh CJ, Ku MS, Lue KH. Coexistence of allergic diseases: patterns and frequencies. Allergy and asthma proceedings: the official journal of regional and state allergy societies. 2012;33(1):e1–4. doi: 10.2500/aap.2012.33.3506. [DOI] [PubMed] [Google Scholar]
- 2.Kulig M, Bergmann R, Klettke U, Wahn V, Tacke U, Wahn U. Natural course of sensitization to food and inhalant allergens during the first 6 years of life. The Journal of allergy and clinical immunology. 1999;103(6):1173–9. doi: 10.1016/s0091-6749(99)70195-8. [DOI] [PubMed] [Google Scholar]
- 3.Spergel JM. From atopic dermatitis to asthma: the atopic march. Annals of allergy, asthma & immunology: official publication of the American College of Allergy, Asthma, & Immunology. 2010;105(2):99–106. doi: 10.1016/j.anai.2009.10.002. quiz 7–9, 17. [DOI] [PubMed] [Google Scholar]
- 4.Castro-Rodriguez JA. The Asthma Predictive Index: early diagnosis of asthma. Current opinion in allergy and clinical immunology. 2011;11(3):157–61. doi: 10.1097/ACI.0b013e3283464c4a. [DOI] [PubMed] [Google Scholar]
- 5.Kotaniemi-Syrjanen A, Reijonen TM, Romppanen J, Korhonen K, Savolainen K, Korppi M. Allergen-specific immunoglobulin E antibodies in wheezing infants: the risk for asthma in later childhood. Pediatrics. 2003;111(3):e255–61. doi: 10.1542/peds.111.3.e255. [DOI] [PubMed] [Google Scholar]
- 6.Martin PE, Matheson MC, Gurrin L, Burgess JA, Osborne N, Lowe AJ, et al. Childhood eczema and rhinitis predict atopic but not nonatopic adult asthma: a prospective cohort study over 4 decades. The Journal of allergy and clinical immunology. 2011;127(6):1473–9 e1. doi: 10.1016/j.jaci.2011.02.041. [DOI] [PubMed] [Google Scholar]
- 7.Chipps BE, Zeiger RS, Borish L, Wenzel SE, Yegin A, Hayden ML, et al. Key findings and clinical implications from The Epidemiology and Natural History of Asthma: Outcomes and Treatment Regimens (TENOR) study. The Journal of allergy and clinical immunology. 2012;130(2):332–42 e10. doi: 10.1016/j.jaci.2012.04.014. [DOI] [PMC free article] [PubMed] [Google Scholar]
- 8.Haselkorn T, Lee JH, Mink DR, Weiss ST, Group TS Racial disparities in asthma-related health outcomes in severe or difficult-to-treat asthma. Annals of allergy, asthma & immunology: official publication of the American College of Allergy, Asthma, & Immunology. 2008;101(3):256–63. doi: 10.1016/S1081-1206(10)60490-5. [DOI] [PubMed] [Google Scholar]
- 9.Rastogi D, Reddy M, Neugebauer R. Comparison of patterns of allergen sensitization among inner-city Hispanic and African American children with asthma. Annals of allergy, asthma & immunology: official publication of the American College of Allergy, Asthma, & Immunology. 2006;97(5):636–42. doi: 10.1016/S1081-1206(10)61093-9. [DOI] [PubMed] [Google Scholar]
- 10.Carroll WD, Lenney W, Child F, Strange RC, Jones PW, Whyte MK, et al. Asthma severity and atopy: how clear is the relationship? Archives of disease in childhood. 2006;91(5):405–9. doi: 10.1136/adc.2005.088278. [DOI] [PMC free article] [PubMed] [Google Scholar]
- 11.Friedlander JL, Sheehan WJ, Baxi SN, Kopel LS, Gaffin JM, Ozonoff A, et al. Food allergy and increased asthma morbidity in a School-based Inner-City Asthma Study. The journal of allergy and clinical immunology In practice. 2013;1(5):479–84. doi: 10.1016/j.jaip.2013.06.007. [DOI] [PMC free article] [PubMed] [Google Scholar]
- 12.Ponsonby AL, Gatenby P, Glasgow N, Mullins R, McDonald T, Hurwitz M. Which clinical subgroups within the spectrum of child asthma are attributable to atopy? Chest. 2002;121(1):135–42. doi: 10.1378/chest.121.1.135. [DOI] [PubMed] [Google Scholar]
- 13.Rosenstreich DL, Eggleston P, Kattan M, Baker D, Slavin RG, Gergen P, et al. The role of cockroach allergy and exposure to cockroach allergen in causing morbidity among inner-city children with asthma. The New England journal of medicine. 1997;336(19):1356–63. doi: 10.1056/NEJM199705083361904. [DOI] [PubMed] [Google Scholar]
- 14.Simpson AB, Glutting J, Yousef E. Food allergy and asthma morbidity in children. Pediatric pulmonology. 2007;42(6):489–95. doi: 10.1002/ppul.20605. [DOI] [PubMed] [Google Scholar]
- 15.Wang J, Visness CM, Sampson HA. Food allergen sensitization in inner-city children with asthma. The Journal of allergy and clinical immunology. 2005;115(5):1076–80. doi: 10.1016/j.jaci.2005.02.014. [DOI] [PubMed] [Google Scholar]
- 16.Liu AH, Jaramillo R, Sicherer SH, Wood RA, Bock SA, Burks AW, et al. National prevalence and risk factors for food allergy and relationship to asthma: results from the National Health and Nutrition Examination Survey 2005–2006. The Journal of allergy and clinical immunology. 2010;126(4):798–806 e13. doi: 10.1016/j.jaci.2010.07.026. [DOI] [PMC free article] [PubMed] [Google Scholar]
- 17.Roberts G, Patel N, Levi-Schaffer F, Habibi P, Lack G. Food allergy as a risk factor for life-threatening asthma in childhood: a case-controlled study. The Journal of allergy and clinical immunology. 2003;112(1):168–74. doi: 10.1067/mai.2003.1569. [DOI] [PubMed] [Google Scholar]
- 18.Akinbami LJ, Moorman JE, Simon AE, Schoendorf KC. Trends in racial disparities for asthma outcomes among children 0 to 17 years, 2001–2010. The Journal of allergy and clinical immunology. 2014;134(3):547–53 e5. doi: 10.1016/j.jaci.2014.05.037. [DOI] [PMC free article] [PubMed] [Google Scholar]
- 19.Branum AM, Lukacs SL. Food allergy among children in the United States. Pediatrics. 2009;124(6):1549–55. doi: 10.1542/peds.2009-1210. [DOI] [PubMed] [Google Scholar]
- 20.Jackson KD, Howie LD, Akinbami LJ. Trends in allergic conditions among children: United States, 1997–2011. NCHS data brief. 2013;(121):1–8. [PubMed] [Google Scholar]
- 21.Division of Health Interview Statistics. 2013 National Health Interview Survey (NHIS) Public Use Data Release 2014 November 14. 2014 Available from: ftp://ftp.cdc.gov/pub/Health_Statistics/NCHS/Dataset_Documentation/NHIS/2013/srvydesc.pdf.
- 22.Martinez FD, Wright AL, Taussig LM, Holberg CJ, Halonen M, Morgan WJ. Asthma and wheezing in the first six years of life. The Group Health Medical Associates. The New England journal of medicine. 1995;332(3):133–8. doi: 10.1056/NEJM199501193320301. [DOI] [PubMed] [Google Scholar]
- 23.Akinbami LJ, Moorman JE, Liu X. Asthma prevalence, health care use, and mortality: United States, 2005–2009. National health statistics reports. 2011;(32):1–14. [PubMed] [Google Scholar]
- 24.Poverty [Internet] U.S. Census Bureau; 2011. [cited 12/10/2013]. Available from: http://www.census.gov/hhes/www/poverty/ [Google Scholar]
- 25.Division of Health Interview Statistics. Multiple Imputation of Family Income and Personal Earnings in the National Health Interview Survey: Methods and Examples. 2014 Available from: http://www.cdc.gov/nchs/data/nhis/tecdoc13.pdf.
- 26.Research Triangle Institute. SUDAAN Language Manual. Research Triangle Park, NC: Research Triangle Institute; 2008. Release 10.0. [Google Scholar]
- 27.National Cancer Institute. Joinpoint regression program. National Institutes of Health; 2010. [Google Scholar]
- 28.National Cancer Institute. Joinpoint documentatin: comparability test2013 9/27/2013. Available from: http://surveillance.cancer.gov/joinpoint/comparabilitytest.html.
- 29.Malka J, Mauger DT, Covar R, Rabinovitch N, Lemanske RF, Jr, Spahn JD, et al. Eczema and race as combined determinants for differential response to step-up asthma therapy. The Journal of allergy and clinical immunology. 2014;134(2):483–5. doi: 10.1016/j.jaci.2014.03.039. [DOI] [PMC free article] [PubMed] [Google Scholar]
- 30.Forno E, Celedon JC. Asthma and ethnic minorities: socioeconomic status and beyond. Current opinion in allergy and clinical immunology. 2009;9(2):154–60. doi: 10.1097/aci.0b013e3283292207. [DOI] [PMC free article] [PubMed] [Google Scholar]
- 31.Sicherer SH, Sampson HA. Food allergy: Epidemiology, pathogenesis, diagnosis, and treatment. The Journal of allergy and clinical immunology. 2014;133(2):291–307. doi: 10.1016/j.jaci.2013.11.020. quiz 8. [DOI] [PubMed] [Google Scholar]
- 32.Sicherer SH, Munoz-Furlong A, Burks AW, Sampson HA. Prevalence of peanut and tree nut allergy in the US determined by a random digit dial telephone survey. The Journal of allergy and clinical immunology. 1999;103(4):559–62. doi: 10.1016/s0091-6749(99)70224-1. [DOI] [PubMed] [Google Scholar]
- 33.The Child and Adolescent Health Measurement Initiative. Data Resource Center for Child & Adolescent Health. Health Resources and Services Administration, Maternal and Child Health Bureau; 2012. [Google Scholar]
Associated Data
This section collects any data citations, data availability statements, or supplementary materials included in this article.